Ethereum Daily Analysis: ETH at $1,772 Tests EMA200 in Bearish Setup
Market Overview
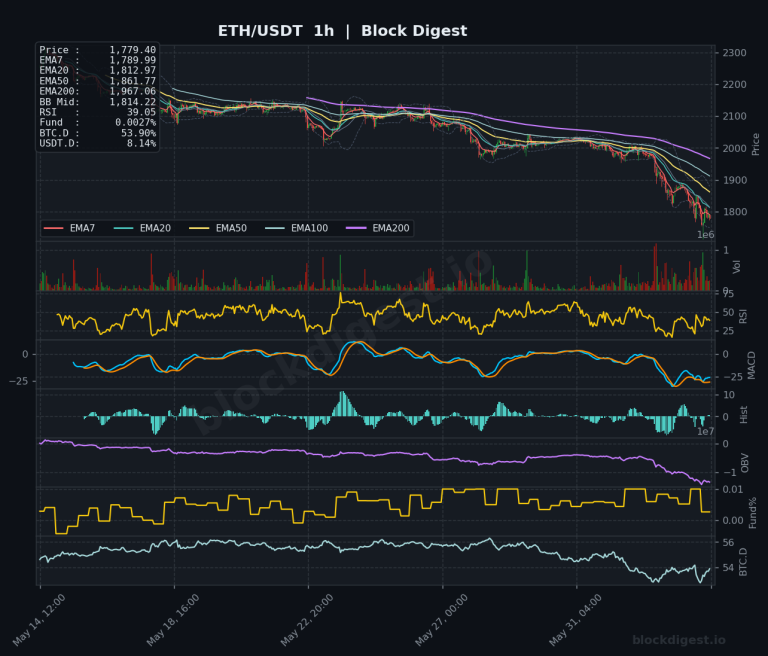
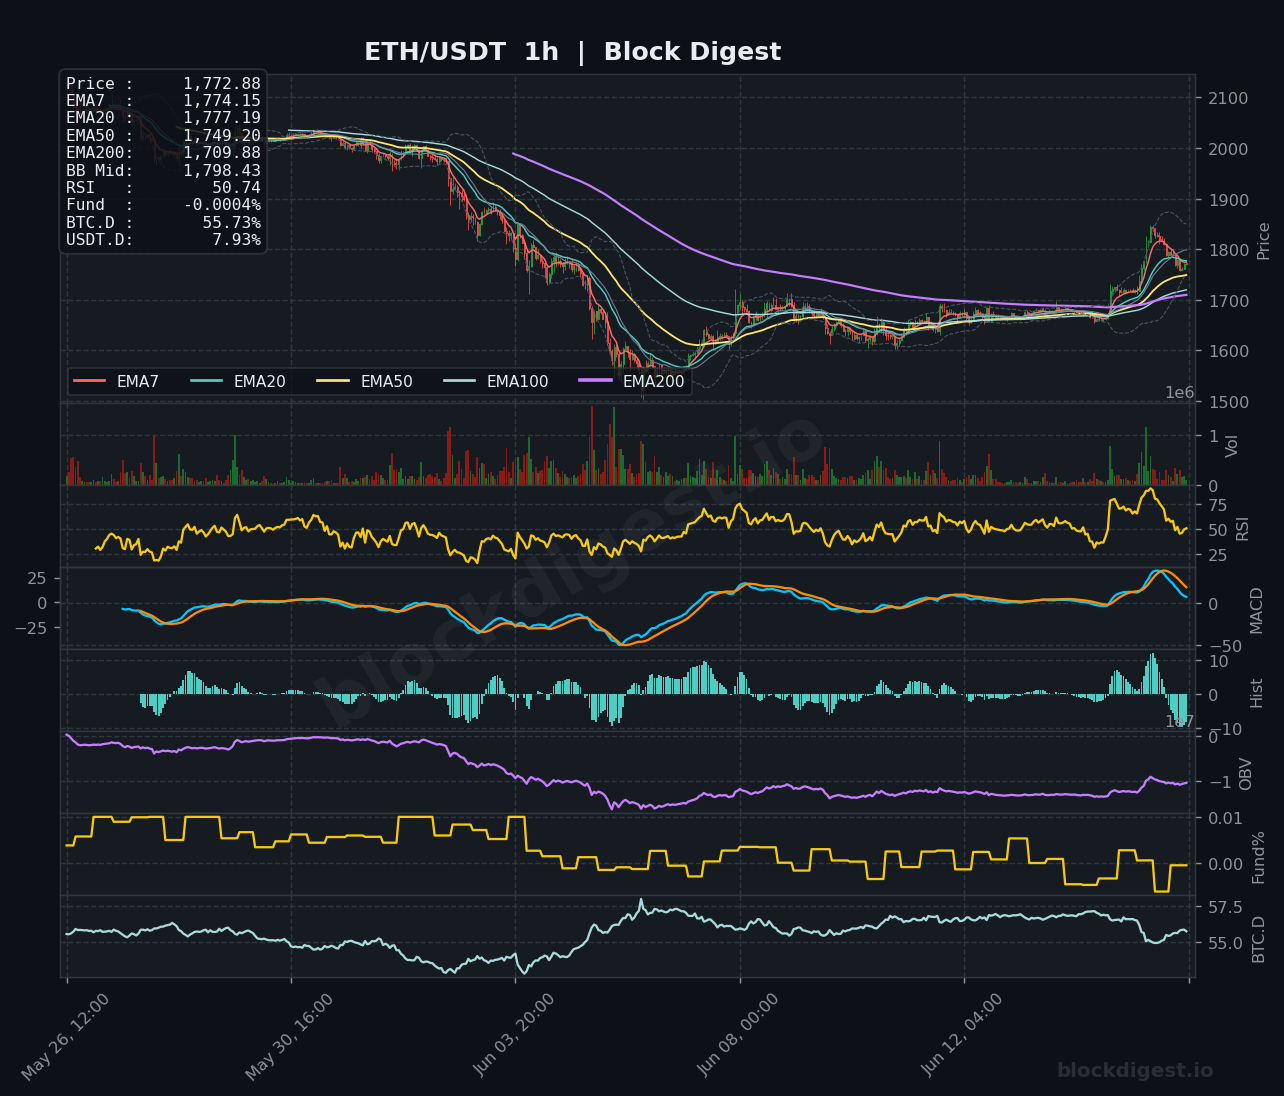
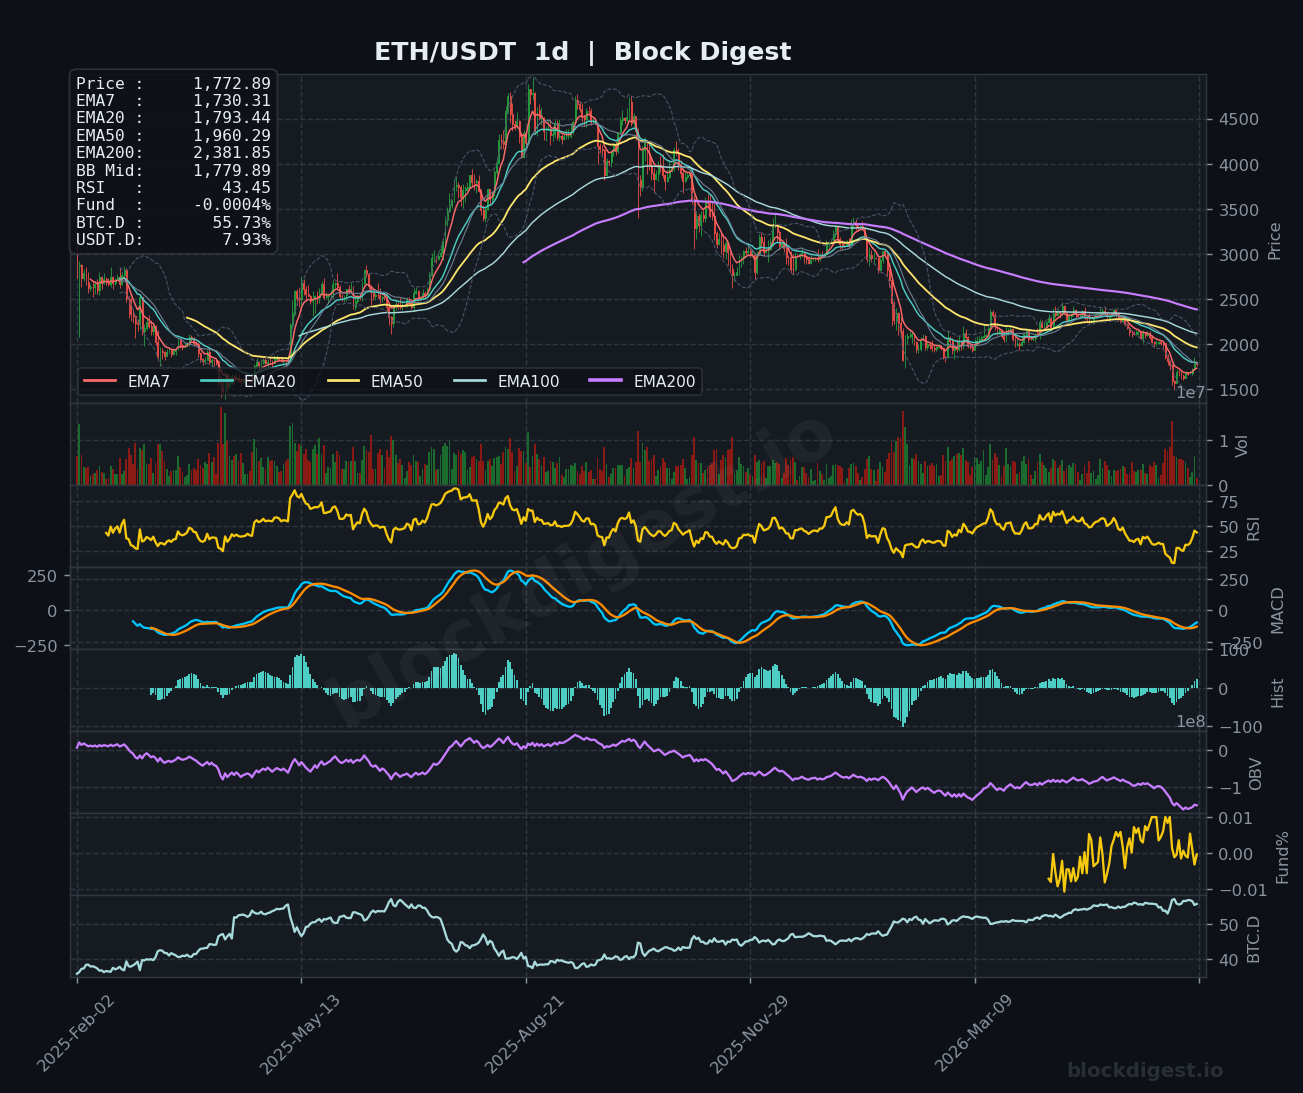
ETH/USDT is currently trading at $1,772.89, caught in a structurally bearish macro environment while attempting a short-term recovery from recent lows near $1,600. Price remains well below the daily EMA200 at $2,381.85 and the EMA50 at $1,960.29, confirming the dominant downtrend on the higher timeframe. The daily Bollinger Band midline sits at $1,779.89 — nearly coincident with current price — representing an immediate inflection point that bulls must defend and reclaim convincingly. The overall daily structure reflects a prolonged distribution phase that has progressively eroded value from the 2025 highs above $4,000, with each EMA layer acting as sequential overhead resistance.
Multi-Timeframe Confluence
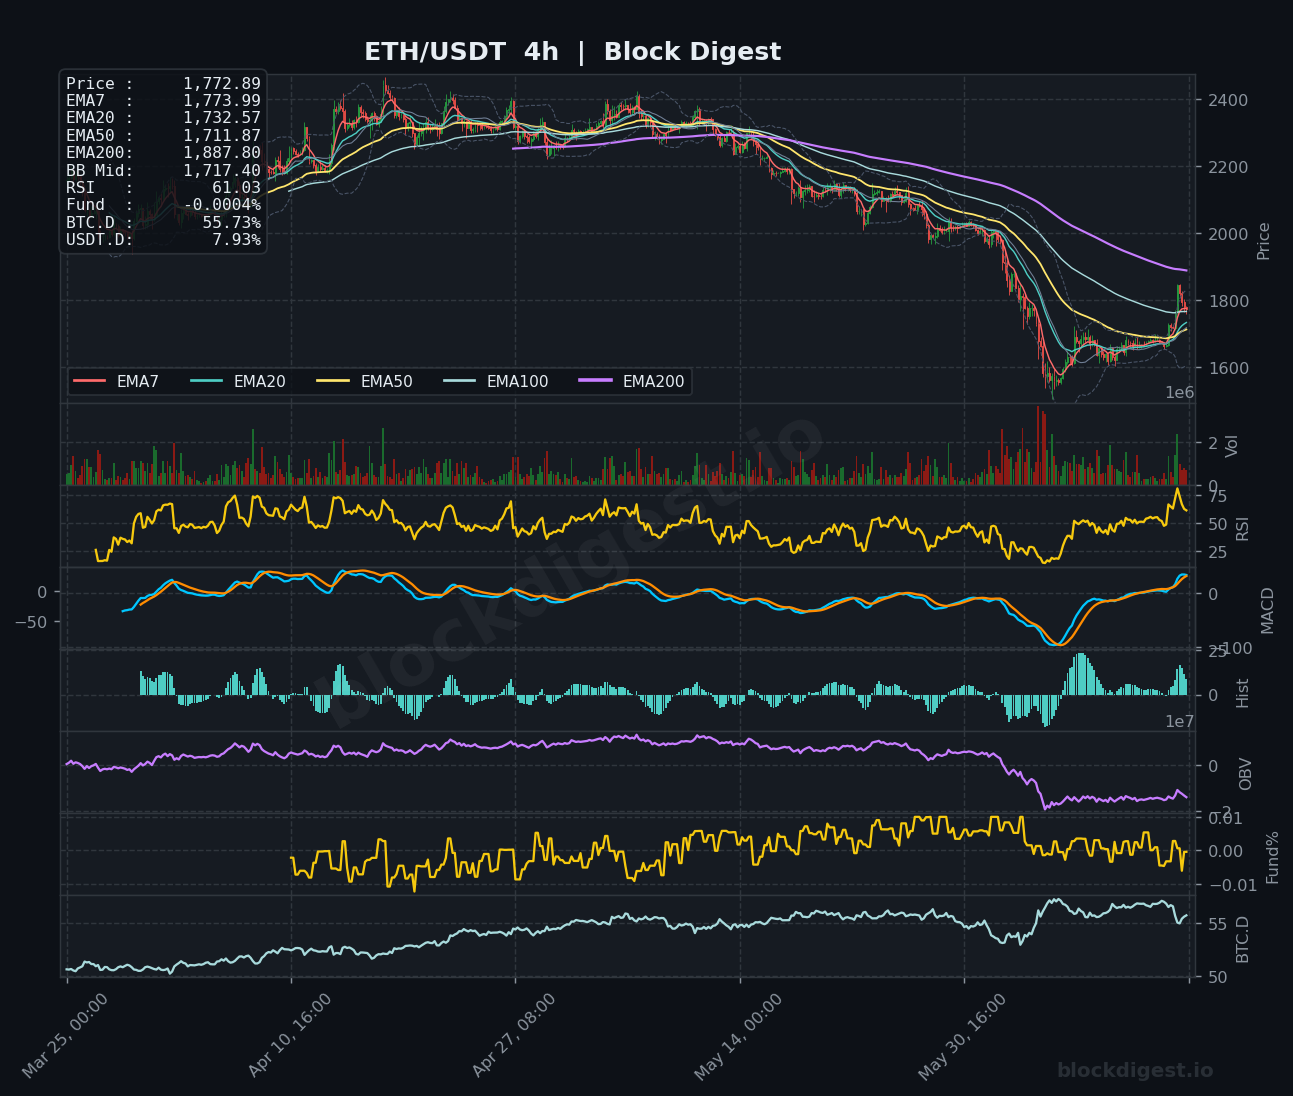
On the 1-hour chart, price is trading just below the EMA20 ($1,777.19) and EMA7 ($1,774.15), with the shorter-term EMAs tightly compressed — a sign of indecision following the recent bounce. The 4-hour timeframe shows a more constructive picture, with price having cleared the EMA20 ($1,732.57) and EMA50 ($1,711.87), and RSI climbing to 61.03, indicating recovering intermediate momentum. However, the daily chart’s bearish EMA stack — where EMA7 ($1,730.31) sits below EMA20 ($1,793.44), which sits far below EMA50 ($1,960.29) — warns that any bounce remains a counter-trend move within a larger downtrend. The $1,780–$1,800 zone represents a critical confluence of resistance across all three timeframes.
Key Levels to Watch
- Resistance: $1,798–$1,800 — the 1-hour BB midline and a key psychological level where prior recovery attempts have stalled; $1,850–$1,870 — a former consolidation shelf and the next meaningful overhead cluster visible on the 4-hour chart; $1,960 — the daily EMA50, which has been acting as major resistance and would represent a significant structural reclaim if breached.
- Support: $1,730–$1,733 — the 4-hour EMA20 and daily EMA7, the first meaningful support zone on a pullback; $1,680–$1,700 — a prior consolidation base visible on the 1-hour chart that provided a springboard for the recent bounce; $1,600–$1,620 — the multi-week swing low, a loss of which would open downside toward the $1,500 psychological level.
Momentum & On-Chain Signals
The 1-hour RSI at 50.74 reflects a neutral momentum state, having cooled from the overbought spike that accompanied the recent rally to near $1,870. The 4-hour MACD shows a bullish crossover developing with a positive histogram, but the signal remains relatively shallow and has yet to print a convincing separation. On the daily timeframe, RSI at 43.45 remains in bearish territory, while the daily MACD continues trending negatively, with both lines below zero and no crossover imminent. OBV on both the 1-hour and 4-hour charts remains in a declining trend overall, suggesting the recent price recovery has not yet been accompanied by sustained accumulation — a notable bearish divergence worth monitoring.
BTC Dominance & Market Sentiment
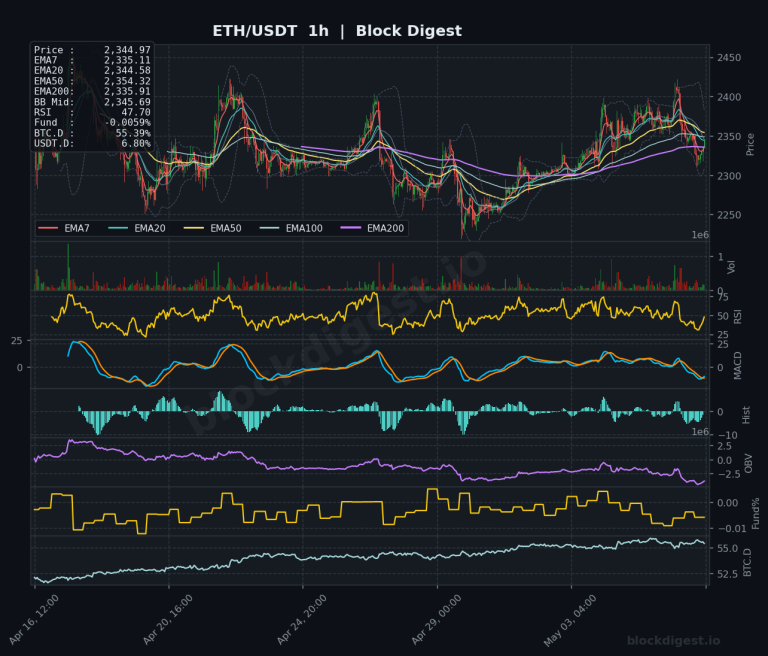
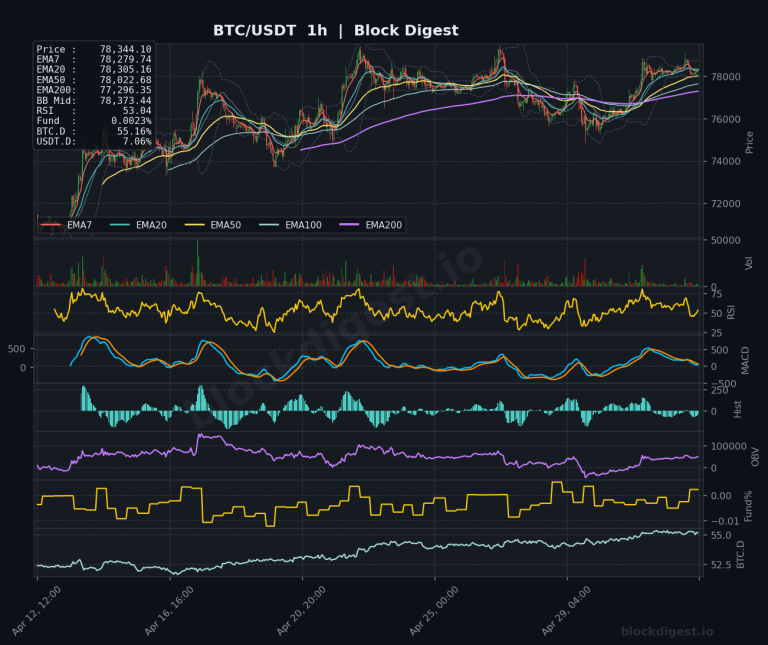
BTC dominance sits at 55.73%, a level that has been rising persistently across the 4-hour chart’s full lookback window, reflecting continued capital rotation into Bitcoin at the expense of altcoins including ETH. USDT dominance at 7.93% remains elevated, suggesting a meaningful portion of market participants remain in cash or stablecoins, indicating cautious risk appetite across the broader market. For ETH specifically, a sustained decline in BTC.D — which recently showed a minor pullback on the 1-hour chart — would be a necessary precondition for any meaningful altcoin outperformance or ETH trend reversal.
Risk Scenarios
- Bullish case: A decisive 4-hour close above $1,800, followed by reclaiming the daily BB midline with volume confirmation, would open a path toward the $1,870 resistance zone and potentially $1,960 over a multi-day horizon. Continuation would require BTC.D to roll over and OBV to trend higher across timeframes.
- Bearish case: Failure to hold $1,730 on a 4-hour closing basis would signal exhaustion of the current recovery and likely trigger a retest of the $1,680–$1,700 support cluster. A clean break below $1,650 would expose the $1,600 swing low and reinforce the broader bearish macro structure.
Outlook
ETH sits at a pivotal short-term juncture near the $1,780–$1,800 resistance confluence, with intermediate momentum showing some improvement on the 4-hour timeframe but the daily structure remaining decidedly bearish. The next 24–48 hours will be telling: a sustained hold and close above $1,800 shifts the short-term bias cautiously bullish, while rejection at current levels keeps the counter-trend rally thesis in question. Bulls need to see OBV confirmation and BTC.D softening to validate any upside continuation. Until ETH reclaims the $1,960 daily EMA50 on a sustained basis, any rallies should be treated as recoveries within a downtrend rather than structural reversals.
Disclaimer: This analysis is for informational purposes only and does not constitute financial advice. Cryptocurrency markets are highly volatile and unpredictable. All trading decisions should be made based on your own research and risk tolerance. Block Digest is not responsible for any financial losses incurred as a result of acting on this content.