Bitcoin Daily Analysis: BTC Below EMAs at $65,435, Bearish Structure
Market Overview
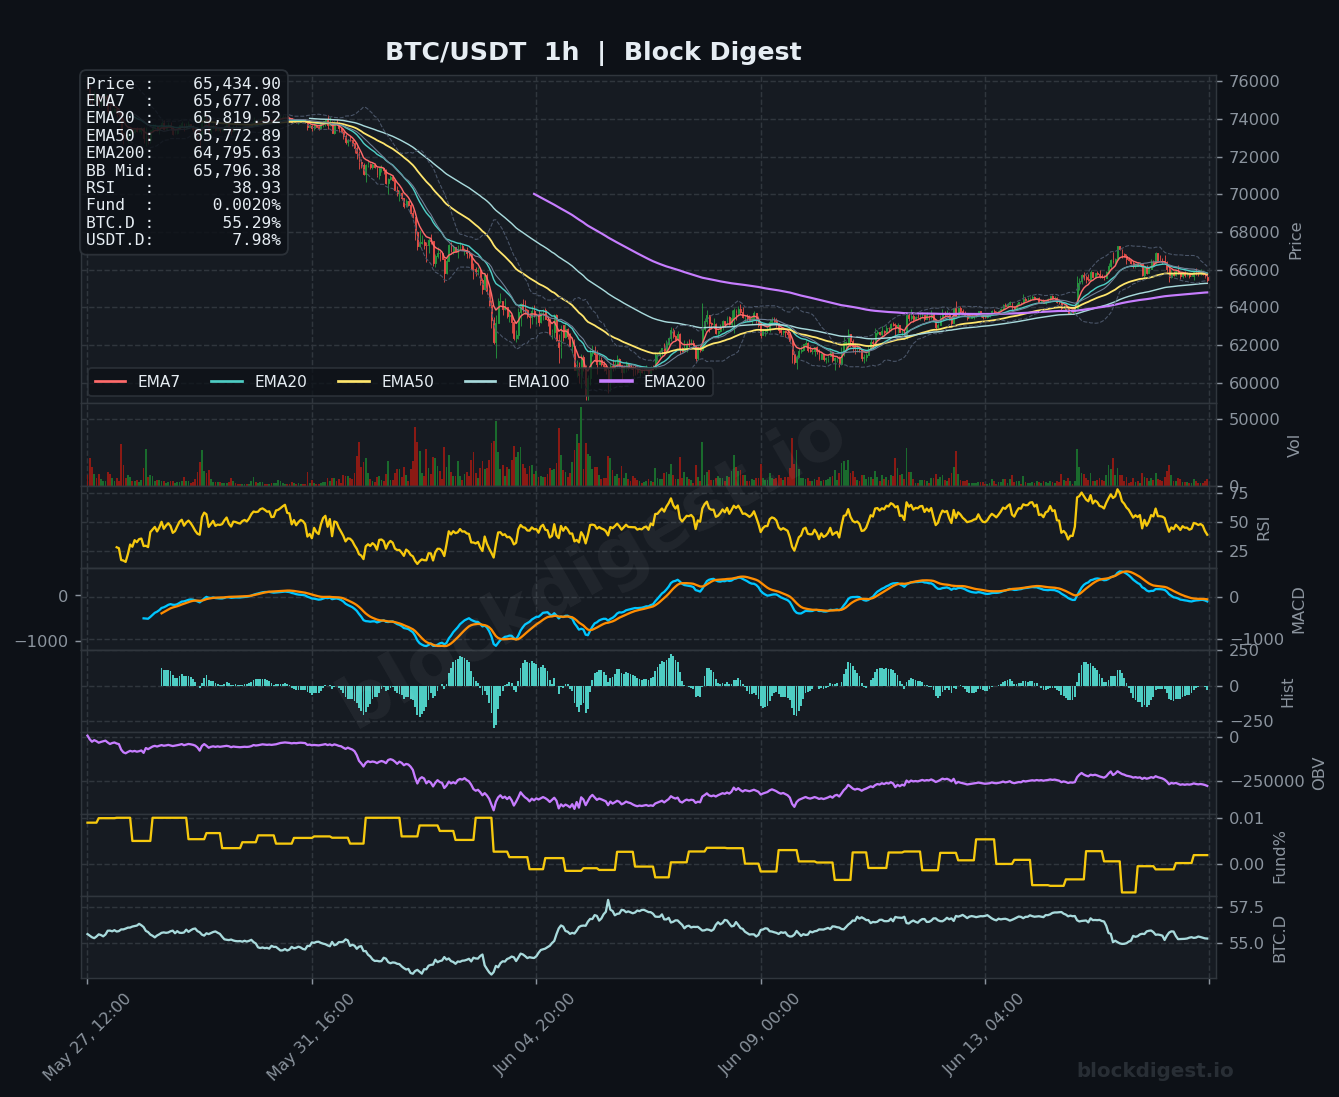
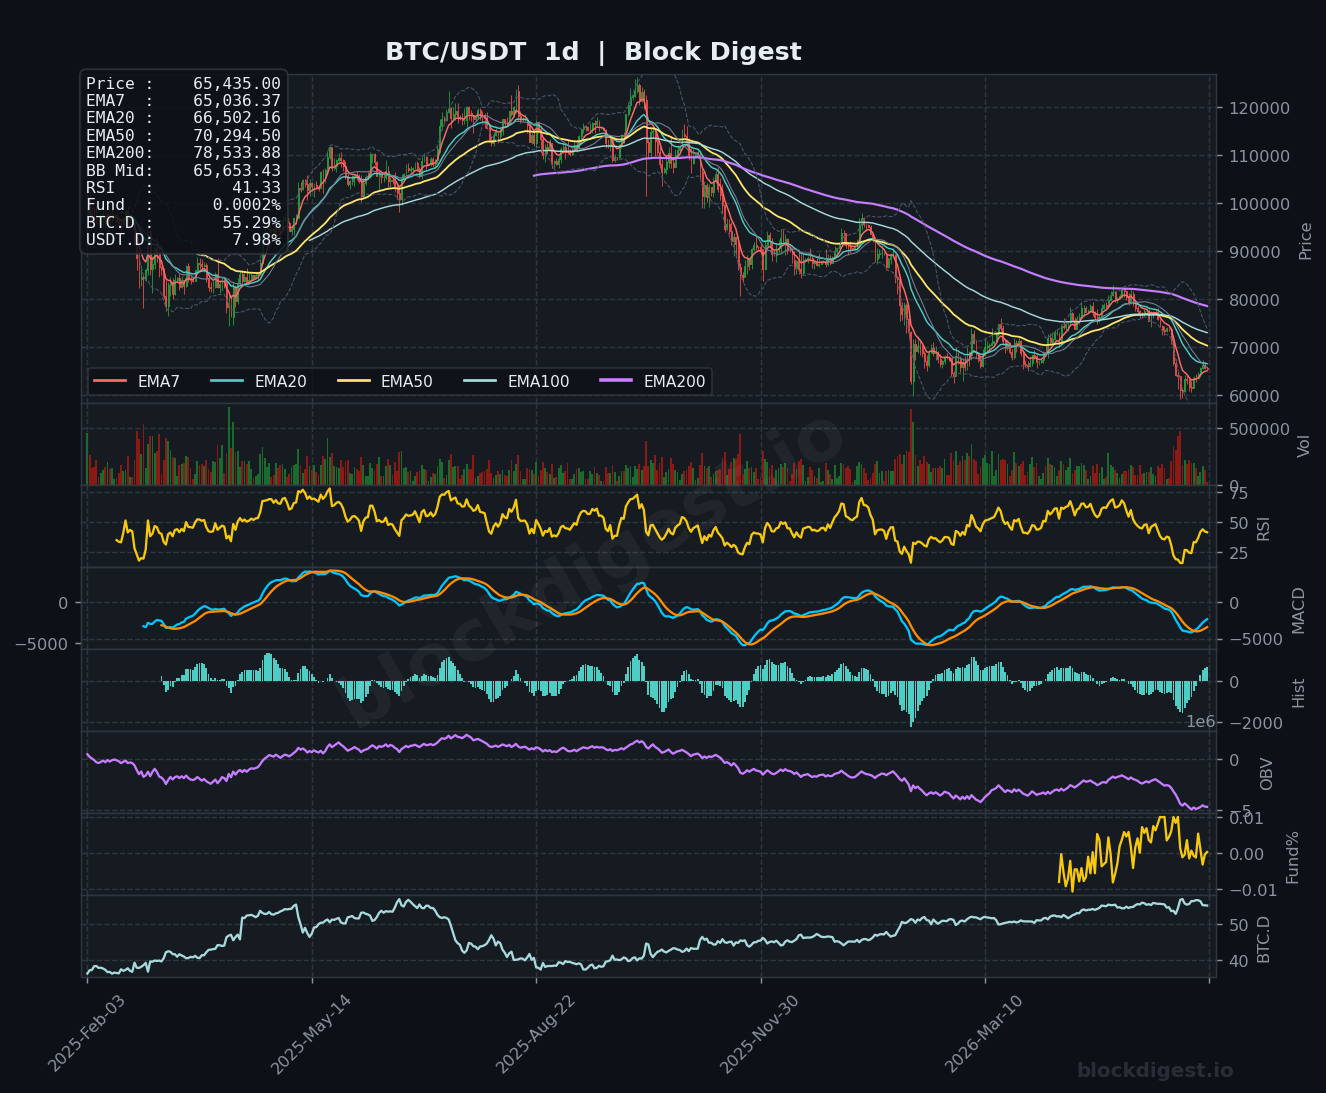
BTC/USDT is currently trading at $65,435, sitting below all major short-term EMAs on both the 1-hour and 4-hour timeframes, reflecting a structurally weak near-term posture. On the daily chart, price remains well below the EMA50 ($70,294) and EMA200 ($78,533), confirming that the dominant macro trend is bearish following an extended correction from the cycle highs. The daily Bollinger Band midline sits at $65,653, and price is pressing against the lower half of the band, indicating persistent selling pressure without a decisive breakdown or recovery. The EMA7 on the daily ($65,036) is the only near-term dynamic level providing marginal support beneath current price.
Multi-Timeframe Confluence
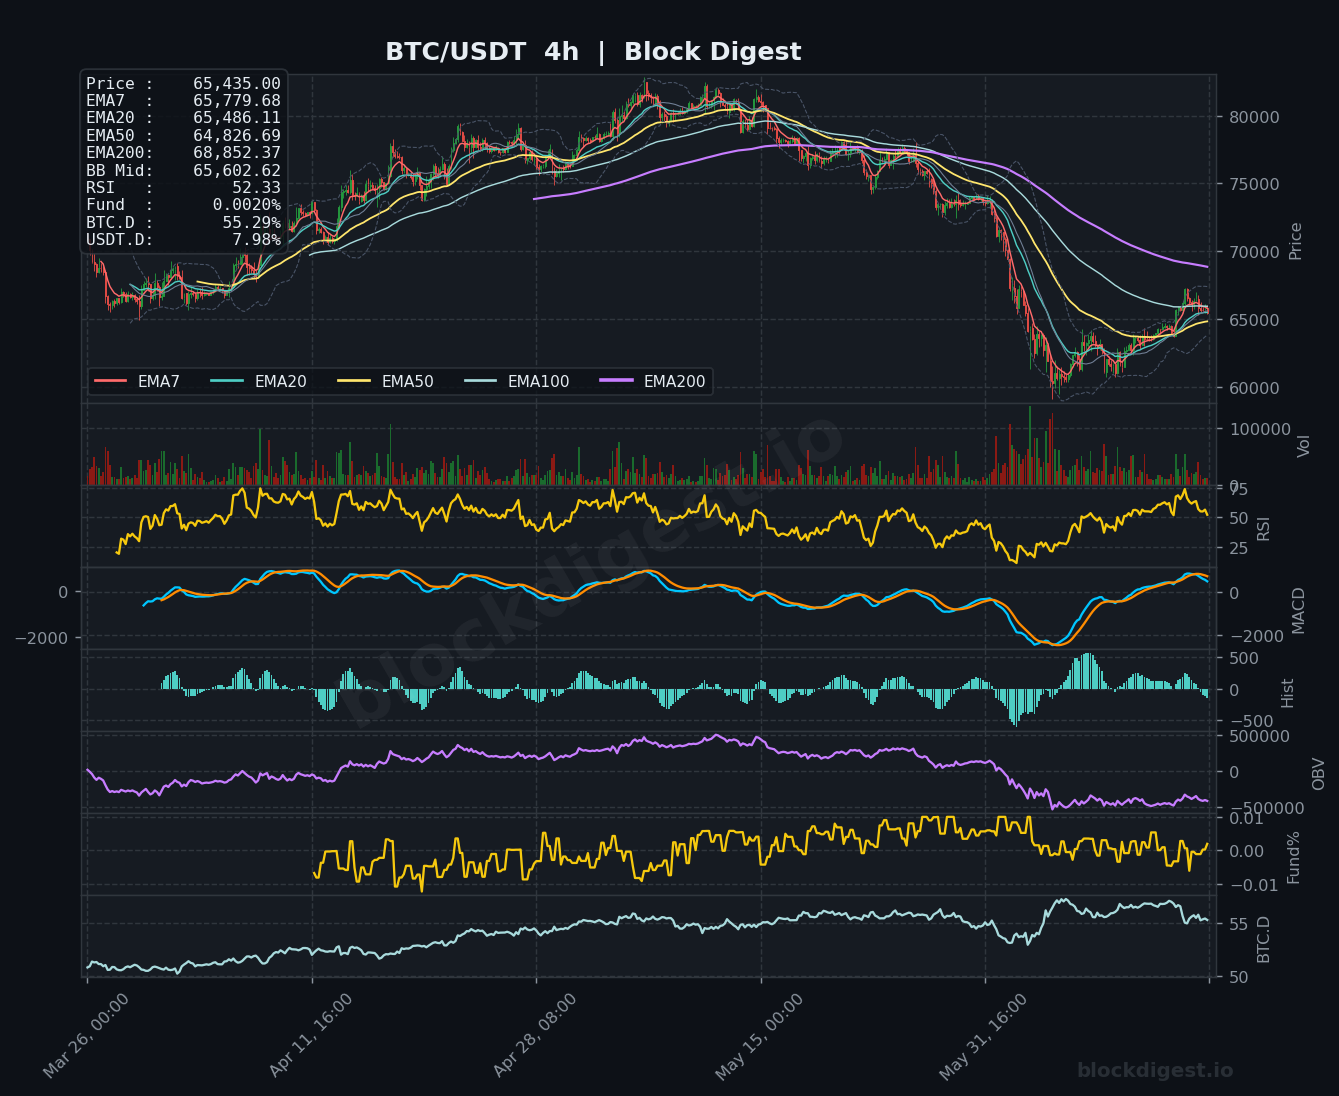
Across all three timeframes, the EMA structure is broadly bearish — price is trading beneath the EMA7, EMA20, and EMA50 on the 1-hour chart ($65,677, $65,819, and $65,772 respectively), while the 4-hour EMA200 at $68,852 acts as a significant macro ceiling. The 4-hour RSI has recovered to 52.33, suggesting a modest relief bounce from oversold conditions, but this uptick is not yet confirmed by the 1-hour RSI reading of 38.93, which remains in bearish territory. The daily RSI at 41.33 reinforces the broader downtrend without yet signaling a washout-level capitulation. Short-term momentum appears to be attempting stabilization, but this contradicts the higher timeframe bearish trend, suggesting the current bounce could be corrective rather than impulsive.
Key Levels to Watch
- Resistance: $65,820 — the 1-hour EMA20 and closely clustered EMA50/EMA7 zone forming immediate overhead supply
- Resistance: $66,502 — the daily EMA20, a key dynamic resistance level that has capped multiple recovery attempts and would need to be reclaimed for any meaningful bullish thesis
- Resistance: $68,852 — the 4-hour EMA200, the macro resistance barrier that defined the breakdown structure and represents a major level for trend reversal confirmation
- Support: $65,036 — the daily EMA7, the nearest dynamic support below current price; a daily close beneath this would be a bearish signal
- Support: $63,500–$64,000 — the recent swing low zone visible on the 4-hour chart where the prior relief rally originated; a critical structural floor
- Support: $61,000–$62,000 — the lower Bollinger Band boundary on the daily timeframe and the approximate demand zone from the most recent significant bottom
Momentum & On-Chain Signals
The 1-hour MACD is hovering near the zero line with a flat histogram, suggesting indecision after a prior bearish impulse, while the 4-hour MACD has recently crossed upward with growing positive histogram bars — a tentatively constructive short-term signal. The daily MACD remains in negative territory with the signal line still below zero, indicating the macro momentum has not yet turned bullish. The OBV on all three timeframes is trending downward or flat, particularly notable on the daily where it shows a persistent declining slope, indicating ongoing distribution rather than accumulation. The funding rate across timeframes is a modest +0.0020%, essentially neutral, suggesting the market is not heavily leveraged in either direction and reducing the risk of a sharp liquidation cascade.
BTC Dominance & Market Sentiment
BTC dominance is sitting at 55.29%, elevated relative to earlier cycle levels, which historically signals risk-off behavior where capital rotates into BTC away from altcoins rather than deploying broadly into the crypto market. USDT dominance at 7.98% remains elevated, consistent with significant sidelined capital and a cautious market sentiment that has not yet committed to risk assets. Together, these readings suggest the broader crypto market lacks the appetite for aggressive risk-taking, and while BTC may be relatively outperforming altcoins, that outperformance is a defensive positioning characteristic rather than a bullish accumulation signal.
Risk Scenarios
- Bullish case: A confirmed 4-hour close above $66,502 (daily EMA20) with expanding volume and a 4-hour RSI push above 60 would indicate a genuine trend shift, opening a path toward the $68,852 EMA200 zone and potentially $70,000–$70,300.
- Bearish case: Failure to hold the $65,036 daily EMA7 on a closing basis, combined with renewed OBV deterioration and 4-hour RSI rolling back below 45, would signal the corrective bounce is exhausted and expose the $63,500–$62,000 support cluster.
Outlook
The overall setup on June 17, 2026 is cautiously bearish on the macro timeframe, with BTC trading in a structurally damaged zone beneath all major daily EMAs following a prolonged corrective phase. The near-term picture offers a tentative stabilization signal — the 4-hour MACD crossover and mild RSI recovery suggest a potential short-term relief bounce is in play, but the weight of evidence from daily momentum, declining OBV, and bearish EMA alignment limits conviction on the upside. The critical trigger to watch in the next 24–48 hours is whether BTC can sustain above $65,820 and challenge the $66,502 daily EMA20 resistance; failure at that level would confirm the bounce as a dead-cat structure. Until a daily close above $66,500 is achieved, the path of least resistance remains downward, and traders should manage risk accordingly.
Disclaimer: This analysis is for informational purposes only and does not constitute financial advice. Cryptocurrency markets are highly volatile and unpredictable. All trading decisions should be made based on your own research and risk tolerance. Block Digest is not responsible for any financial losses incurred as a result of acting on this content.