Weekly Market Overview
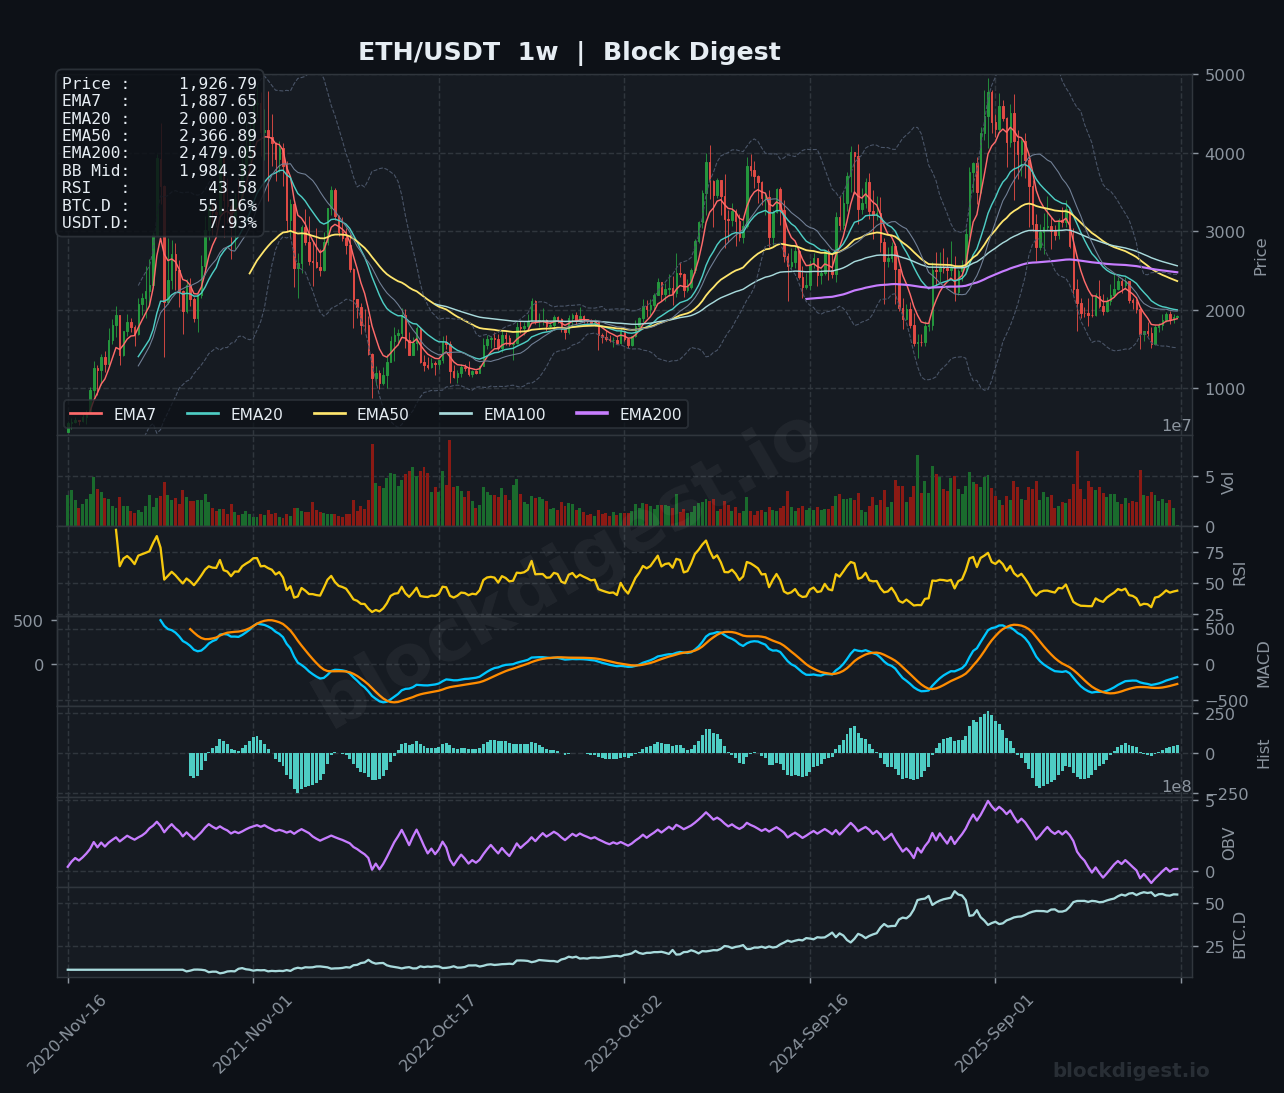
Ethereum closed the week at approximately $1,926, posting a modest gain of roughly 0.33% as price action continued to consolidate within a historically significant range just below the psychologically important $2,000 level. The weekly candle structure reflects subdued directional conviction — a tight-bodied candle with contained wicks — suggesting an ongoing tug-of-war between buyers defending the $1,880–$1,900 support shelf and sellers capping advances near prior resistance. This consolidation follows a prolonged multi-month recovery from the devastating early-2026 selloff that dragged ETH toward the $1,500–$1,600 range, and the current structure represents ETH’s most sustained attempt at reclaiming the $2,000 handle since that breakdown. The broader macro backdrop — including a softer U.S. jobs report, $1.1 billion in ETF inflows across BTC and ETH vehicles, and renewed speculation around the Senate’s CLARITY Act vote — has provided a constructive but cautious bid under the market.
Higher Timeframe Structure
On the weekly chart, the EMA stack remains in a deeply bearish configuration at the macro level: the EMA200 at $2,479 and EMA50 at $2,367 both sit far above current price, acting as formidable long-term overhead resistance that will take many months of sustained buying to meaningfully challenge. Price is currently sandwiched between the weekly EMA7 ($1,887) below and the weekly EMA20 at exactly $2,000 above — making that $2,000 level a technically loaded pivot that doubles as both psychological resistance and a major moving average. Bollinger Band positioning on the weekly frame shows price trading near the midline at $1,984, which aligns closely with the EMA20, reinforcing that zone as the primary battleground for the weeks ahead. Historically, ETH’s previous recovery cycles from the 2022 bear market lows followed similar patterns of EMA compression before directional resolution, and the current setup echoes that accumulation dynamic — though without yet confirming bullish momentum.
Multi-Timeframe Confluence
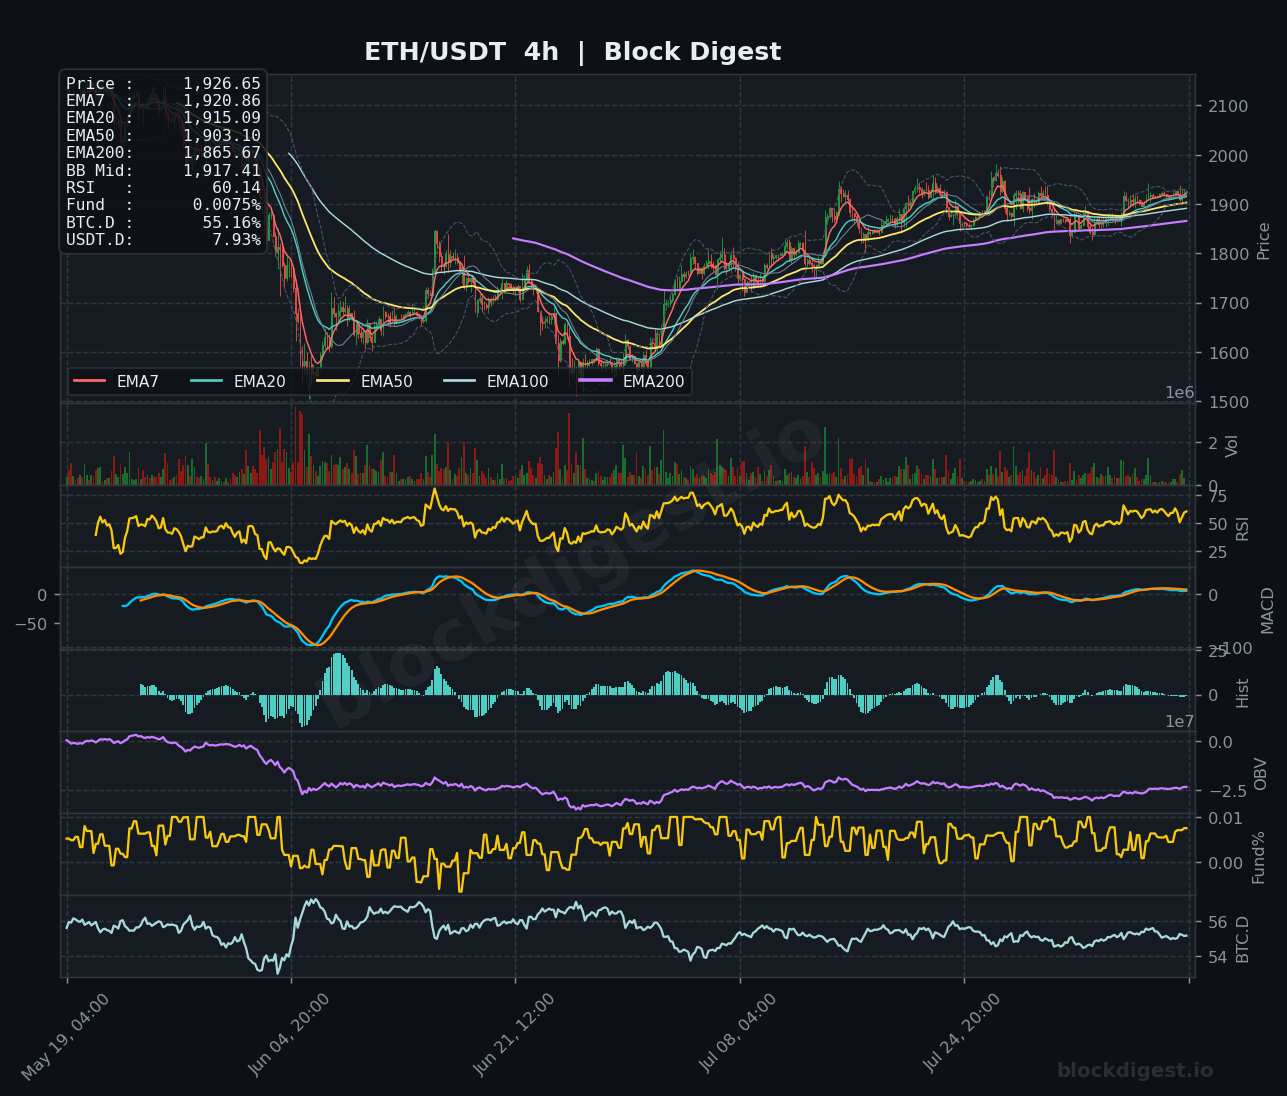
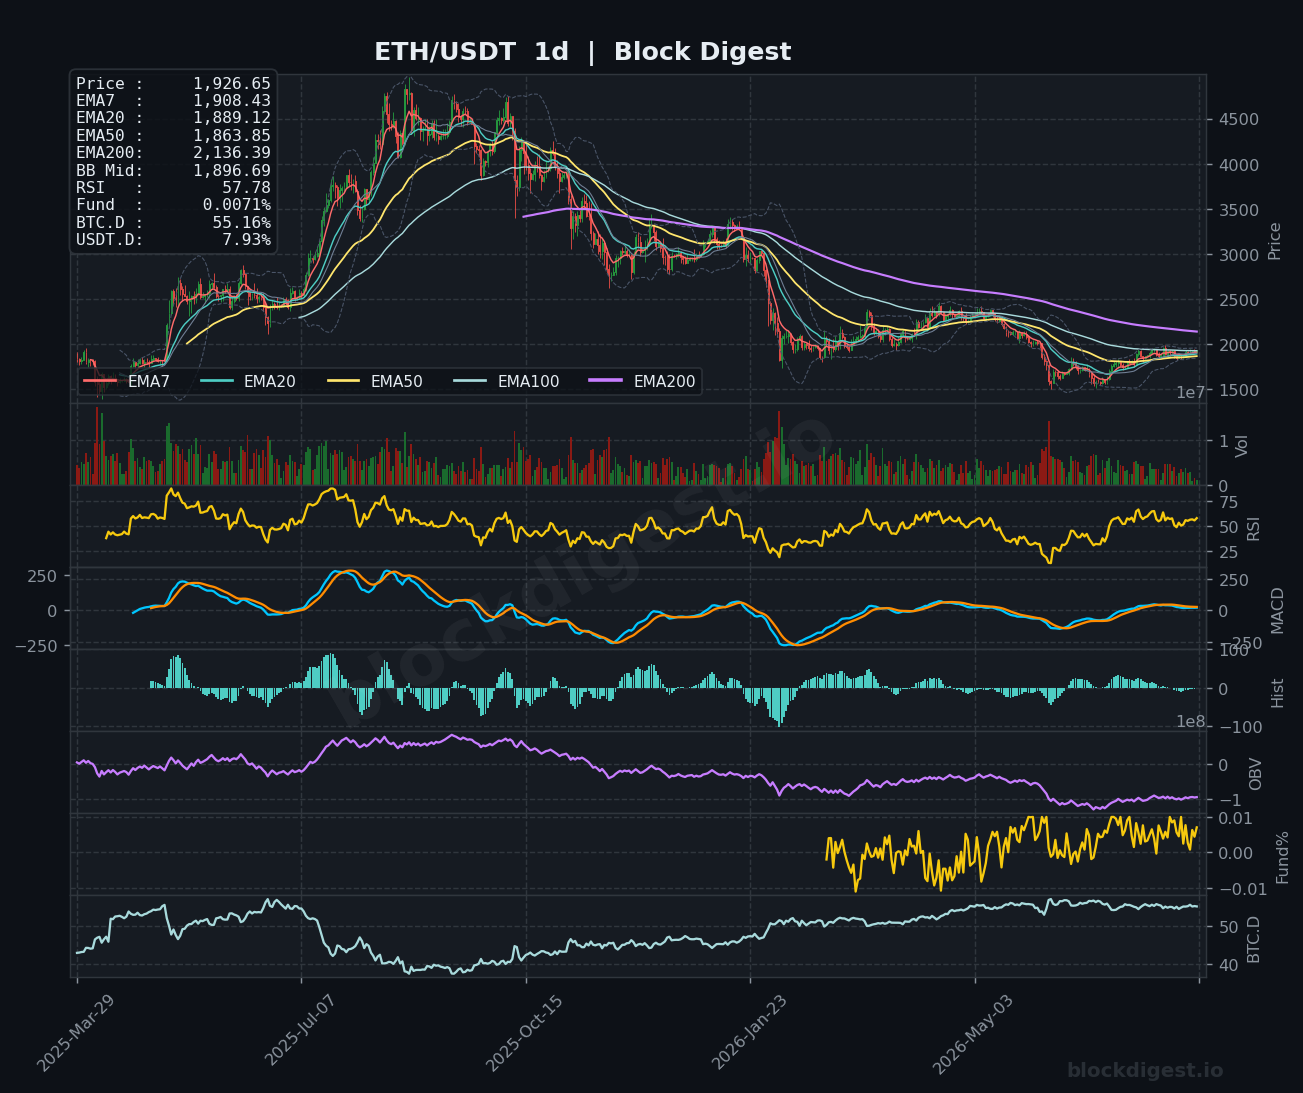
Across all three timeframes, the $1,900–$1,920 zone emerges as the clearest point of convergence: on the 4-hour chart, all short-term EMAs (7, 20, 50) are clustered between $1,903 and $1,921, price sits marginally above the Bollinger Band midline at $1,917, and the structure remains constructively bullish intraday following the recovery from July lows. The daily chart reinforces this picture, with the EMA7 at $1,908 and EMA20 at $1,889 acting as dynamic support while price trades above the daily BB midline of $1,896 — a sign that medium-term momentum has stabilized. The key friction point across all timeframes is the $1,950–$2,000 zone, where the weekly EMA20, multiple prior swing highs from the recent recovery, and the psychologically significant round number converge to create a dense resistance cluster that has so far rejected every intraweek rally attempt. Until ETH achieves a decisive weekly close above $2,000, the multi-timeframe structure must be interpreted as recovery-phase consolidation rather than confirmed trend reversal.
Key Weekly Levels
- Weekly Resistance: $1,950–$1,960 (near-term supply zone from recent swing highs and intraweek rejection wicks), $2,000–$2,010 (weekly EMA20 confluence with the psychologically critical round number), $2,100–$2,150 (prior consolidation range and next meaningful supply cluster visible on the daily chart)
- Weekly Support: $1,880–$1,900 (weekly EMA7 and daily EMA cluster — first line of defense on any pullback), $1,840–$1,860 (daily EMA50 at $1,863 and prior breakout retest zone), $1,750–$1,780 (structural support from the base of the recent recovery range; loss of this level would signal trend deterioration)
Momentum & Volume Analysis
Block Digest’s BD Pulse score sits at a cautious 39/100, firmly in bearish territory, which aligns with the weekly RSI reading of 43.58 — hovering below the neutral 50 level and reflecting the absence of genuine bullish momentum on the higher timeframe. The 4-hour RSI has recovered to 60.14, showing that short-term price action carries more energy than the weekly trend currently justifies, a divergence worth monitoring for signs of exhaustion. On the weekly MACD, the histogram bars have been contracting toward zero following a protracted negative phase, suggesting the bearish impulse is waning but a confirmed bullish crossover has not yet materialized — a pattern that historically precedes either a sustained recovery or a failed rally followed by capitulation. The BD Pulse funding rate of +0.0048% is marginally positive but well within neutral territory, indicating that leveraged longs have not become dangerously overcrowded, which reduces the immediate risk of a long squeeze but also confirms that conviction among bulls remains limited.
BTC Dominance & Altcoin Implications
BTC dominance at 55.17% remains elevated and, as shown on the weekly BTC.D chart, has been in a multi-year uptrend since 2023 — a structural headwind for ETH and altcoins that limits the likelihood of a sustained altcoin season in the near term. USDT.D at 7.93% is moderately elevated, suggesting stablecoin capital remains on the sidelines rather than rotating aggressively into risk assets, which constrains upside velocity for ETH specifically. A meaningful ETH rally would likely require BTC.D to stall or roll over below the 55% level, so traders should watch dominance closely as a leading indicator for any rotation catalyst.
Risk Scenarios
- Bull case: A weekly close above $2,000 — confirmed by the weekly EMA20 — would represent the most significant technical breakout for ETH in several months, opening the path toward $2,100 and ultimately the $2,350–$2,400 resistance zone where the daily EMA200 and prior range highs converge. This scenario would be catalyzed by a positive CLARITY Act outcome, continued ETF inflows sustaining the $1.1 billion weekly pace, and a softening in BTC dominance allowing capital to rotate into ETH.
- Bear case: Failure to hold the $1,880–$1,900 EMA cluster on a weekly closing basis would signal that the recovery has stalled, with the next meaningful support at the daily EMA50 near $1,860 and a deeper retest of the $1,750–$1,780 structural range becoming probable. A resurgence in BTC dominance above 56%, combined with deteriorating macro sentiment ahead of the Fed’s September window, would amplify downside pressure and risk invalidating the current recovery structure entirely.
Weekly Outlook
Ethereum enters the week of August 10 in a technically neutral-to-cautiously-constructive posture, with price holding above key short-term EMAs and consolidating just below the critical $2,000 resistance — but the BD Pulse score of 39/100 and a weekly RSI of 43.58 both serve as reminders that the underlying trend has not yet flipped bullish on the higher timeframe. The primary catalyst to watch is the Senate’s final vote on the CLARITY Act, which could function as a significant risk-on or risk-off trigger for the entire digital asset complex, while continued ETF inflow data and any Fed-related macro developments will shape sentiment around BTC’s stability above $64,000 and its downstream effect on ETH. Technically, the make-or-break level for the week is $2,000: a convincing breakout and hold above this level with volume confirmation would shift the weekly bias to bullish and open upside toward $2,100–$2,150, while a rejection here followed by a daily close below $1,880 would favor a deeper consolidation toward the $1,840–$1,860 zone. The long/short account ratio of 1.11 (52.6% longs vs. 47.4% shorts) reflects a modestly bullish lean among participants but falls well short of the overcrowded positioning that typically precedes sharp reversals. Overall, the risk/reward this week slightly favors patient bulls who wait for a confirmed break of $2,000 rather than chasing the current range, with defined invalidation below $1,850.
Disclaimer: This analysis is for informational purposes only and does not constitute financial advice. Cryptocurrency markets are highly volatile and unpredictable. All trading decisions should be made based on your own research and risk tolerance. Block Digest is not responsible for any financial losses incurred as a result of acting on this content.
Stay Ahead of the Market
Follow BlockDigest for crypto market intelligence, research and real-time updates.