Macro Market Overview
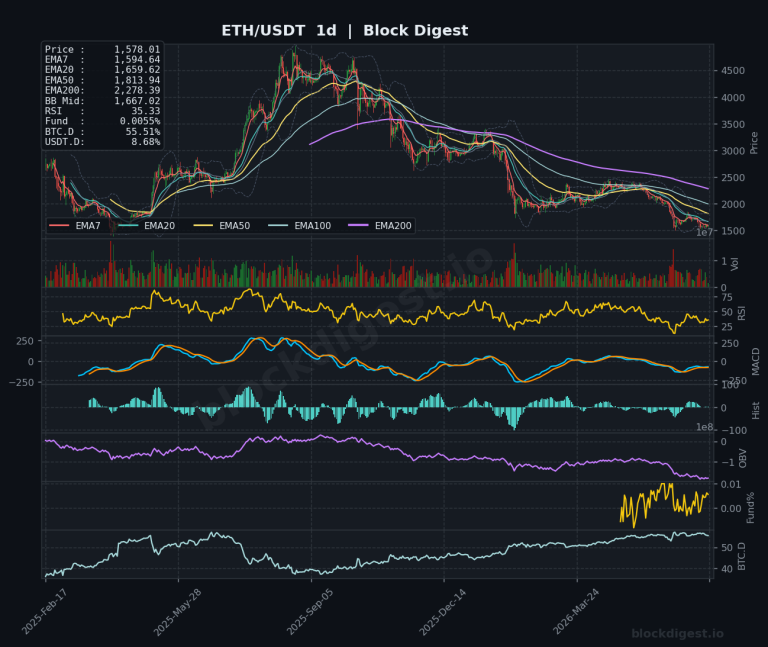
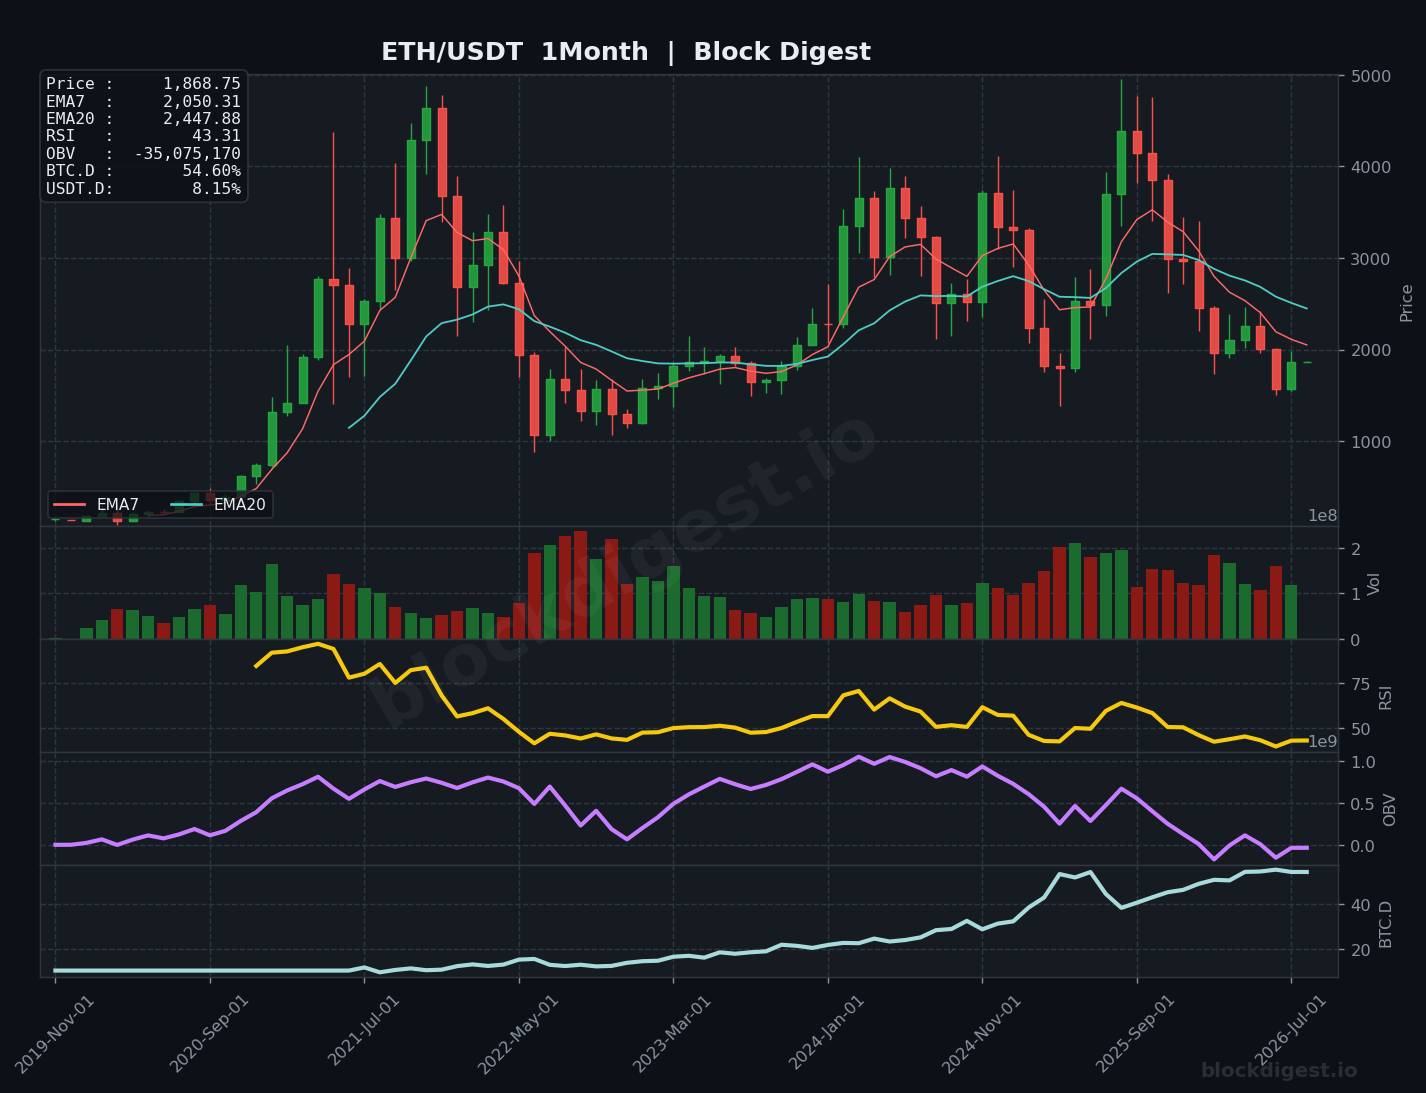
Ethereum enters August 2026 printing what is shaping up to be a structurally significant monthly candle, currently holding near $1,868 after a pronounced multi-month downtrend that has erased the majority of the 2024–2025 bull cycle gains. On the monthly chart, price has now retraced deep into the macro consolidation zone that defined the 2023 base-building phase, placing ETH in territory last consistently occupied around the $1,800–$2,000 range. The monthly EMA7 has crossed decisively below the EMA20 — currently sitting at $2,050 and $2,448 respectively — confirming that the long-term trend structure remains bearish and that any near-term recovery must be assessed against significant overhead. Notably, ETH has gained approximately 21.6% against Bitcoin over the past month, suggesting relative strength may be emerging at the asset level even as the broader macro picture remains challenged. Whether this constitutes genuine cycle rotation or merely a counter-trend relief move within an ongoing markdown phase is the central question heading into August.
Long-Term Trend Structure
The monthly chart reveals a textbook post-distribution markdown phase: the EMA7 ($2,050) is now well below the EMA20 ($2,448), a bearish configuration that historically has persisted for multiple quarters once established at this timeframe. The Bollinger Bands on the monthly have contracted and are now pointing lower, with price testing the lower band region around current levels — a zone that, during the 2022 bear cycle, briefly provided support before a final capitulation leg. The $1,800–$2,000 zone carries significant historical weight, having served as a macro accumulation range during the 2023 bear market lows and again as a launchpad for the 2024 bull run; its current role as contested support is therefore critical to the macro thesis. Monthly OBV on the chart reads at -35,075,170, representing a sustained and steep decline that mirrors the distribution patterns visible near the 2021 and 2025 cycle tops — institutional selling pressure has not abated meaningfully. Until the monthly EMA7 reclaims the EMA20 and OBV begins trending higher, this cycle phase is best characterized as late markdown, with nascent accumulation possible but not yet confirmed.
Weekly Timeframe Context
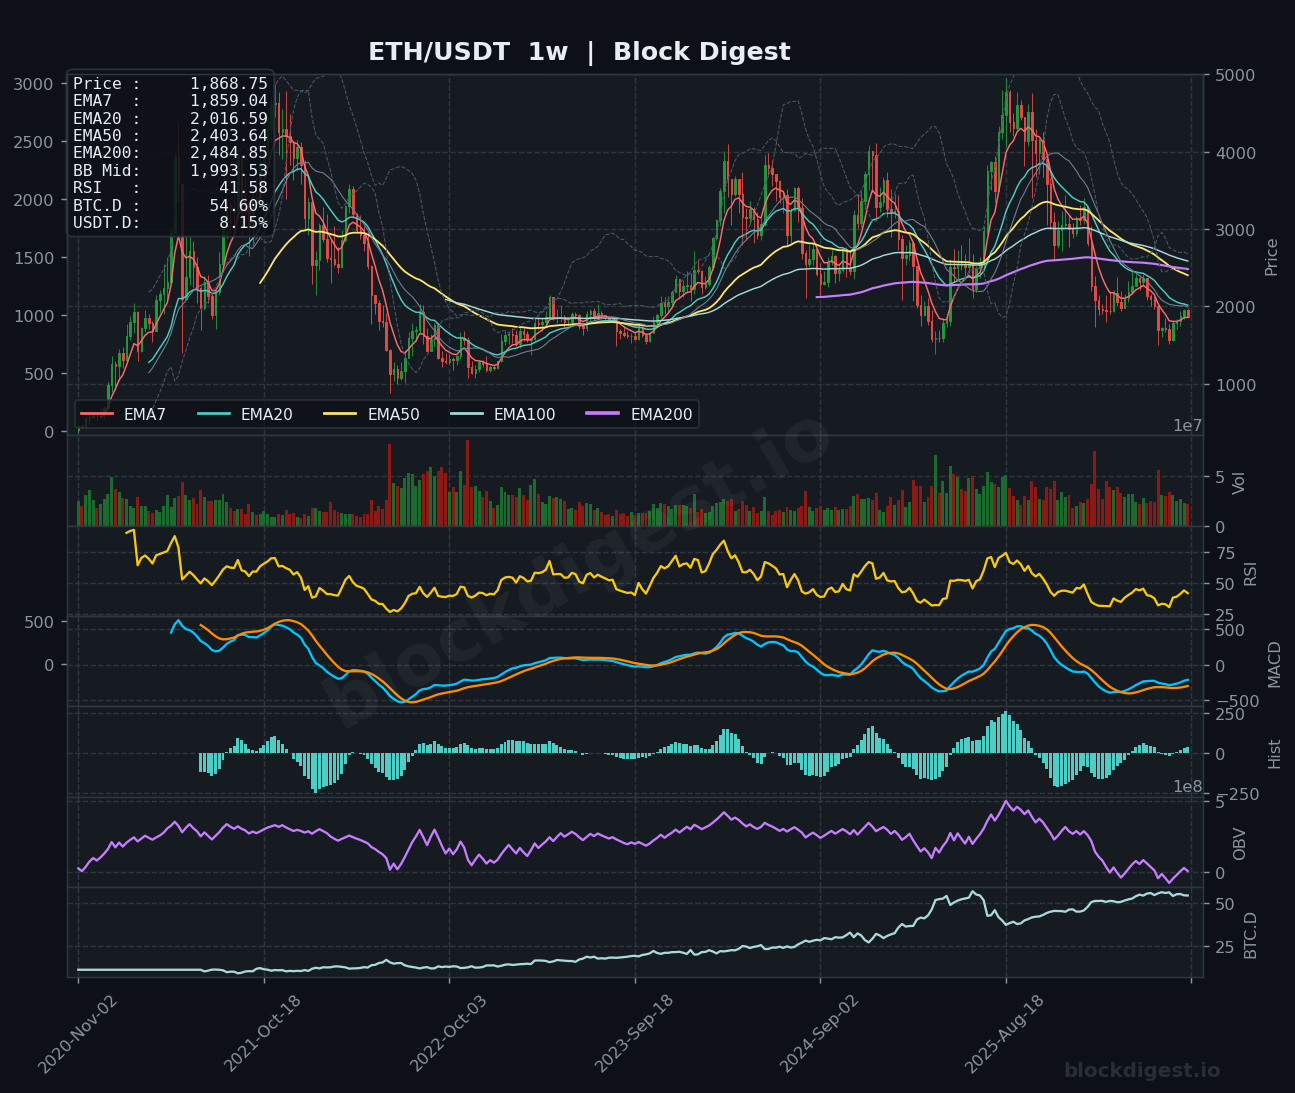
On the weekly chart, the EMA structure paints an even more sobering picture: price at $1,868 sits well below all major weekly EMAs — EMA20 at $2,016, EMA50 at $2,403, EMA100 at approximately $2,485, and EMA200 at $2,484 — creating a full bearish EMA stack that represents layered overhead resistance across every intermediate time horizon. The weekly Bollinger Band midline at $1,993 is the first meaningful recovery target, and ETH’s failure to reclaim the $2,000 psychological level on a sustained weekly close suggests that selling pressure remains dominant at any meaningful bounce. Weekly MACD lines remain in negative territory, though the histogram has shown incremental improvement over recent sessions, hinting at decelerating bearish momentum rather than a confirmed reversal. This weekly structure reinforces the monthly thesis: the path of least resistance remains lower, but the rate of descent is slowing, which is a precondition for eventual base formation.
Key Macro Levels
- Major Resistance:
- $2,000–$2,016: Weekly BB midline and EMA20 convergence — the first structural hurdle and key battleground for any recovery attempt
- $2,403–$2,484: Weekly EMA50 through EMA200 cluster — a dense supply zone that capped multiple recovery rallies during the 2025–2026 drawdown
- $2,800–$3,000: Prior macro support turned resistance from the 2024 consolidation range, representing the broader distribution ceiling
- $3,500–$4,000: Historical distribution zone and cycle high region; reclaiming this would signal a full macro trend reversal
- Major Support:
- $1,800: Immediate psychological and structural support, the lower bound of the 2023 macro accumulation range currently under active test
- $1,500–$1,550: Major cycle low from the 2022–2023 bear market trough; the last line of macro defense before uncharted territory for this cycle
- $1,200–$1,300: Deep macro support representing the pre-bull-run baseline; a breach here would signal a catastrophic cycle failure
- $1,868 (current): Short-term pivot that must hold on a monthly closing basis to avoid accelerated downside
Momentum & Accumulation Analysis
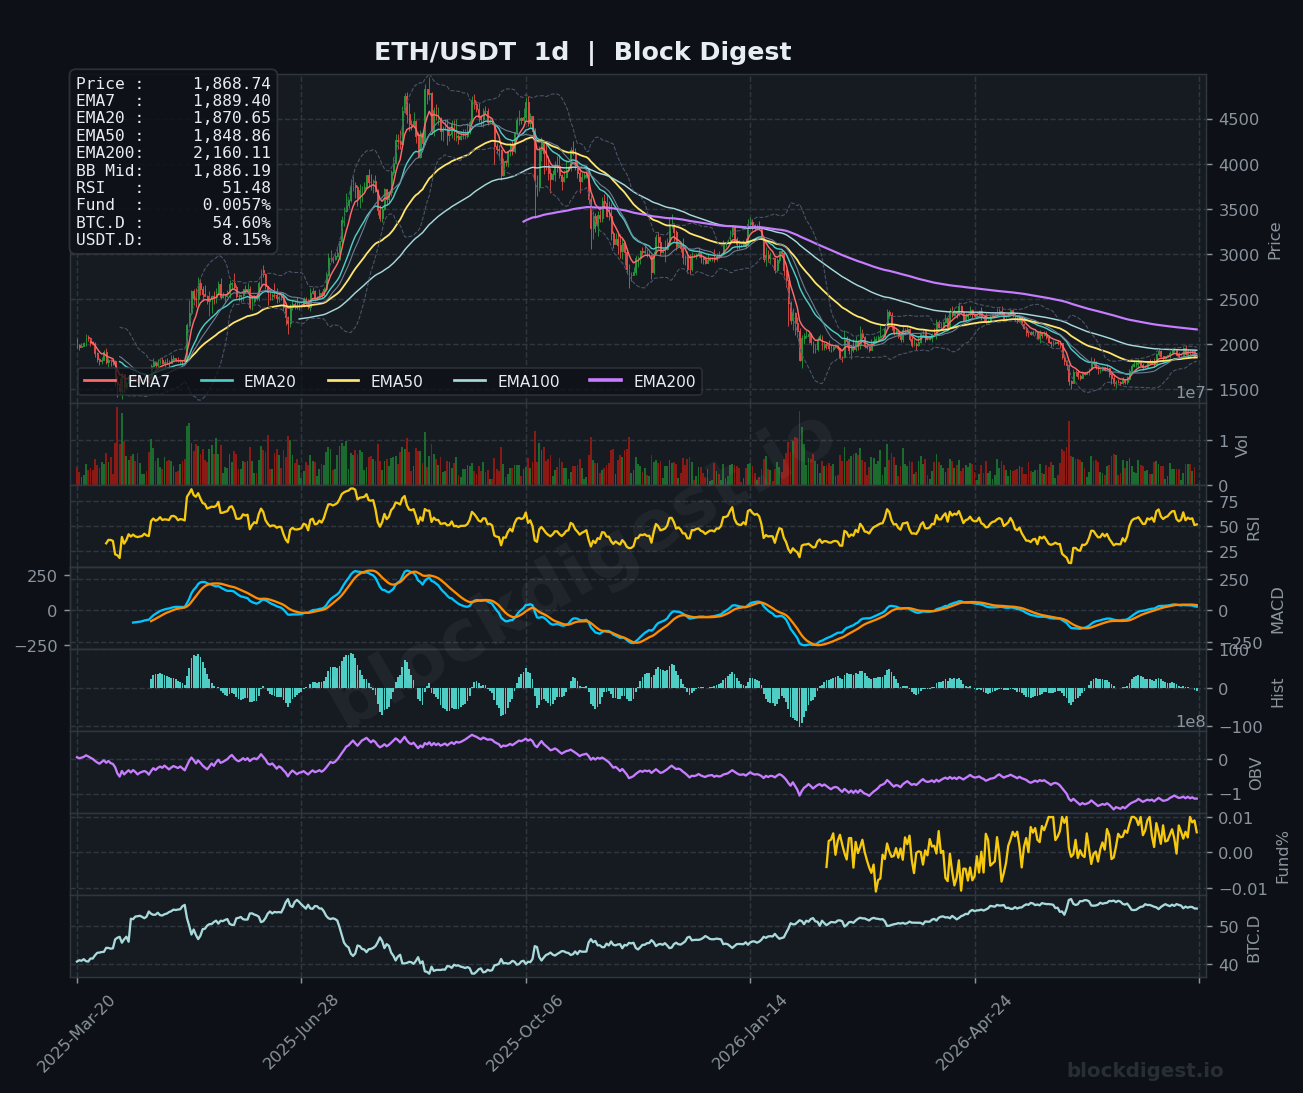
Block Digest’s proprietary BD Pulse score currently reads 28/100, firmly in bearish territory, which is consistent with what the monthly RSI of 43.31 is communicating — a reading that sits in the lower half of the neutral range and mirrors levels seen during the 2022 extended bear market prior to final capitulation. Critically, the BD Extreme Index has reached -1.27σ oversold on our model, suggesting that while the macro trend remains bearish, the market is approaching a zone where short-term exhaustion of sellers can produce sharp counter-trend bounces. The daily chart RSI of 51.48 provides a mild near-term positive divergence against the weaker monthly reading, indicating that price has stabilized temporarily at the daily level even as the longer-term momentum structure has yet to recover. Weekly OBV continues to trend lower from its 2024 cycle peak, confirming that macro distribution has not concluded — this is perhaps the most bearish single data point in the current setup, as genuine bull cycle beginnings are almost universally accompanied by rising OBV. Until OBV inflects higher on both the weekly and monthly timeframes, momentum indicators suggesting oversold conditions should be treated as caution signals for bears rather than buy signals for bulls.
BTC Dominance – Cycle Context
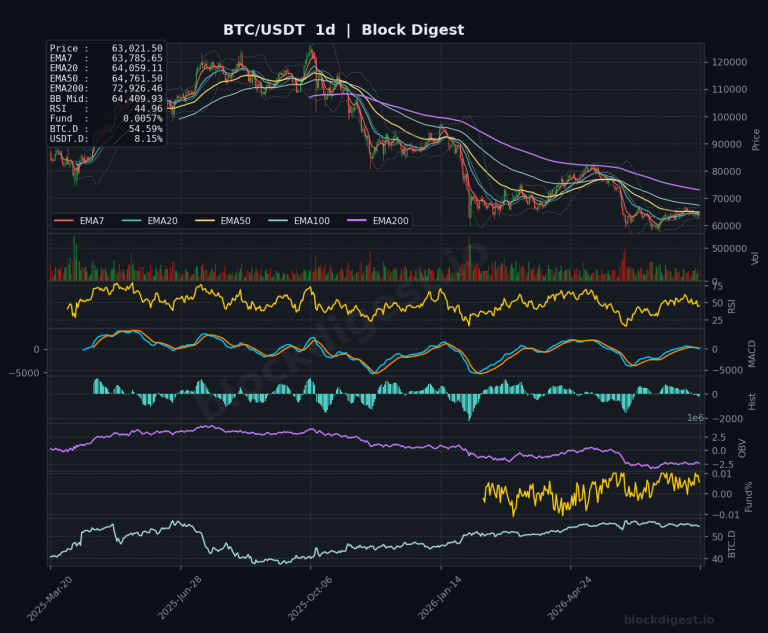
Bitcoin dominance is currently sitting at 54.59% per our BD Pulse data, a level that historically has marked a transitional zone where altcoin cycles begin to mature — but the direction of travel matters enormously, and the monthly chart shows BTC.D in a clear uptrend from the lows of approximately 38% seen during the peak altcoin season of 2021. The fact that ETH has outperformed Bitcoin by over 21% in the past month is a notable development, but it comes from a position of significant underperformance and must be sustained over multiple weeks before it signals a genuine altcoin rotation cycle is underway. USDT dominance at 8.15% remains historically elevated, indicating that a meaningful portion of crypto market capital is still parked on the sidelines in stablecoins — this is a double-edged signal, representing latent buying power that has not yet re-entered the market. A decline in USDT.D accompanied by falling BTC.D would be the classic confirmation of a broad altcoin season, but neither condition has yet been met with conviction.
Risk Scenarios
- Bull case: A monthly close above $2,000 reclaiming the weekly BB midline, combined with improving macro liquidity conditions and declining dollar strength, would set the stage for a test of the $2,400–$2,484 EMA cluster. Sustained institutional inflows and real-world blockchain adoption catalysts could accelerate the timeline, with Standard Chartered’s $100,000 BTC year-end target providing a macro tailwind that historically lifts ETH disproportionately. In this scenario, a recovery toward the $2,800–$3,200 range by Q4 2026 becomes viable, with the BD Extreme Index’s oversold reading acting as the coiled spring for a sharp mean-reversion move.
- Bear case: Failure to hold the $1,800 macro support level on a monthly closing basis would signal that the markdown phase has further to run, with the 2022 bear market lows near $1,500–$1,550 becoming the next logical target. Persistent dollar strength, continued tightening liquidity, and the ongoing reality that top buyers between $75,000–$126,000 in Bitcoin are underwater could trigger cascading liquidations across the altcoin complex, dragging ETH lower. In a worst-case scenario where $1,500 fails to hold, the $1,200–$1,300 deep macro support zone comes into play, representing a greater than 30% drawdown from current levels.
Monthly Outlook
Entering August 2026, Ethereum’s macro setup is best described as a high-stakes holding pattern at a historically significant support cluster, with the weight of evidence — bearish monthly EMA structure, declining OBV, and a BD Pulse score of 28/
Disclaimer: This analysis is for informational purposes only and does not constitute financial advice. Cryptocurrency markets are highly volatile and unpredictable. All trading decisions should be made based on your own research and risk tolerance. Block Digest is not responsible for any financial losses incurred as a result of acting on this content.
Stay Ahead of the Market
Follow BlockDigest for crypto market intelligence, research and real-time updates.