Ethereum Weekly Analysis: Ethereum Rejected at $2,000 Resistance Level
Weekly Market Overview
Ethereum is trading at $1,965.40 as of the July 27, 2026 analysis date, holding just below the psychologically significant $2,000 level after a volatile week defined by a sharp intraweek rally followed by a pullback. The weekly candle is forming a potential bearish wick rejection near $2,000, suggesting sellers remain active at that round-number resistance. Earlier in the week, ETH managed a brief push above $1,960–$1,980 but failed to sustain momentum as Bitcoin spot ETFs recorded $225 million in net outflows on Thursday, dragging broader risk appetite lower. Despite the turbulence, ETH remains constructively positioned above recent swing lows, keeping the short-term recovery thesis nominally intact but fragile.
Higher Timeframe Structure
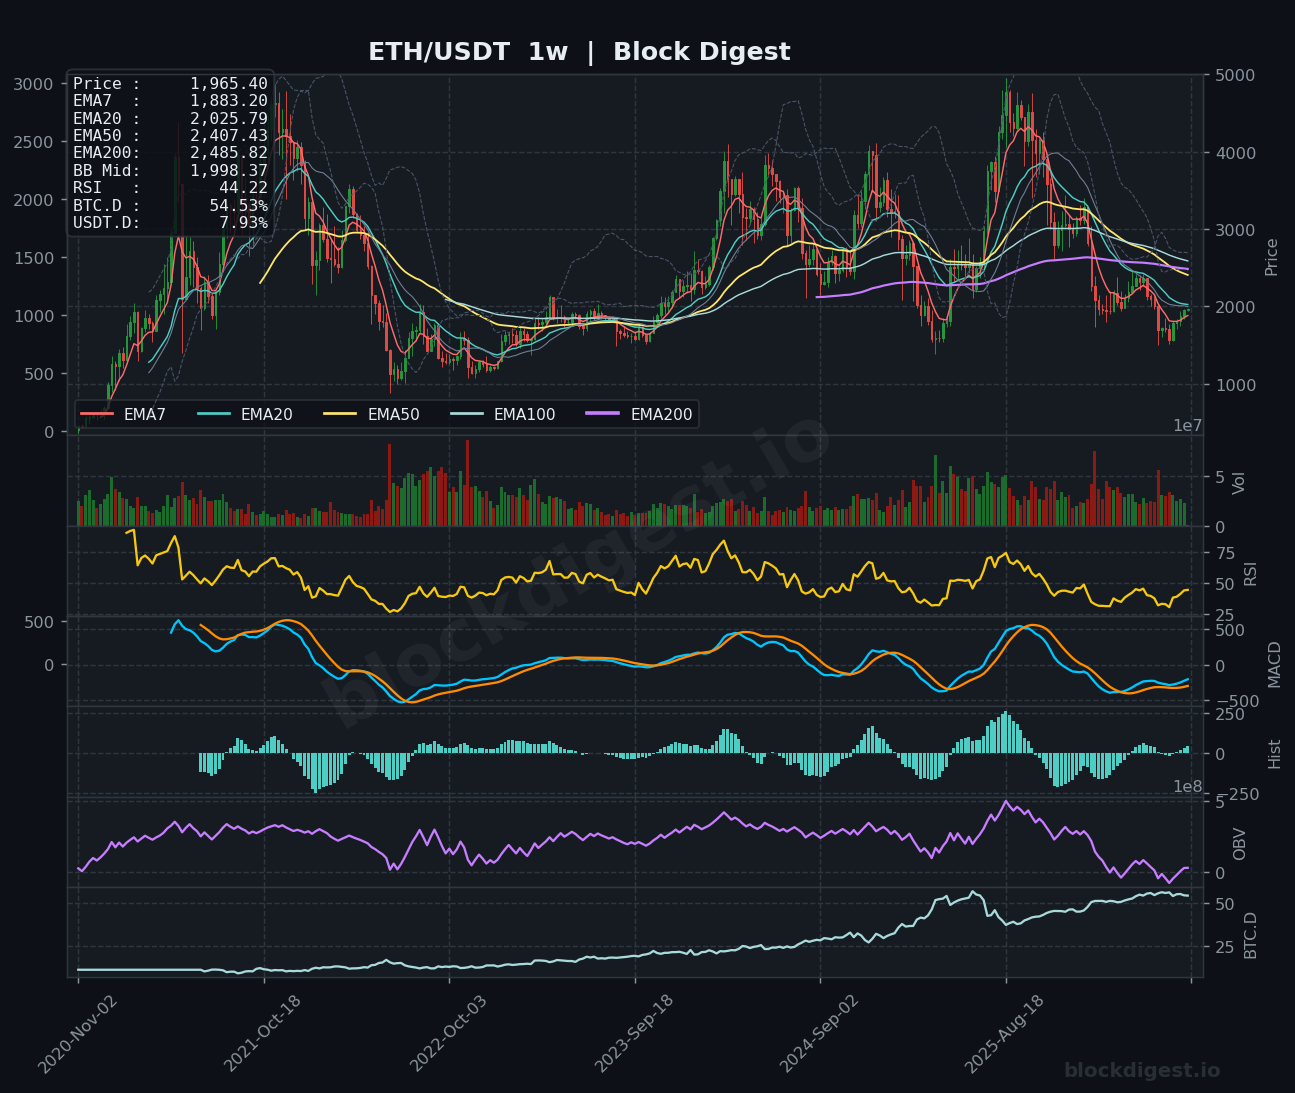
On the weekly chart, the EMA stack remains deeply bearish — price sits below the EMA20 ($2,025), EMA50 ($2,407), and EMA200 ($2,485), reflecting a structural downtrend that has been in place since the 2025 highs above $4,000. The current price of $1,965 is trading below the weekly Bollinger Band midline at $1,998, which itself acts as a near-term dynamic resistance that ETH has yet to reclaim convincingly. The EMA7 ($1,883) has begun curling upward from the cycle lows seen earlier this year near $1,400–$1,500, which offers a faint early signal that selling pressure may be abating. However, until price reclaims and closes weekly above the BB midline and EMA20 cluster around $2,000–$2,026, the macro trend remains structurally bearish.
Multi-Timeframe Confluence
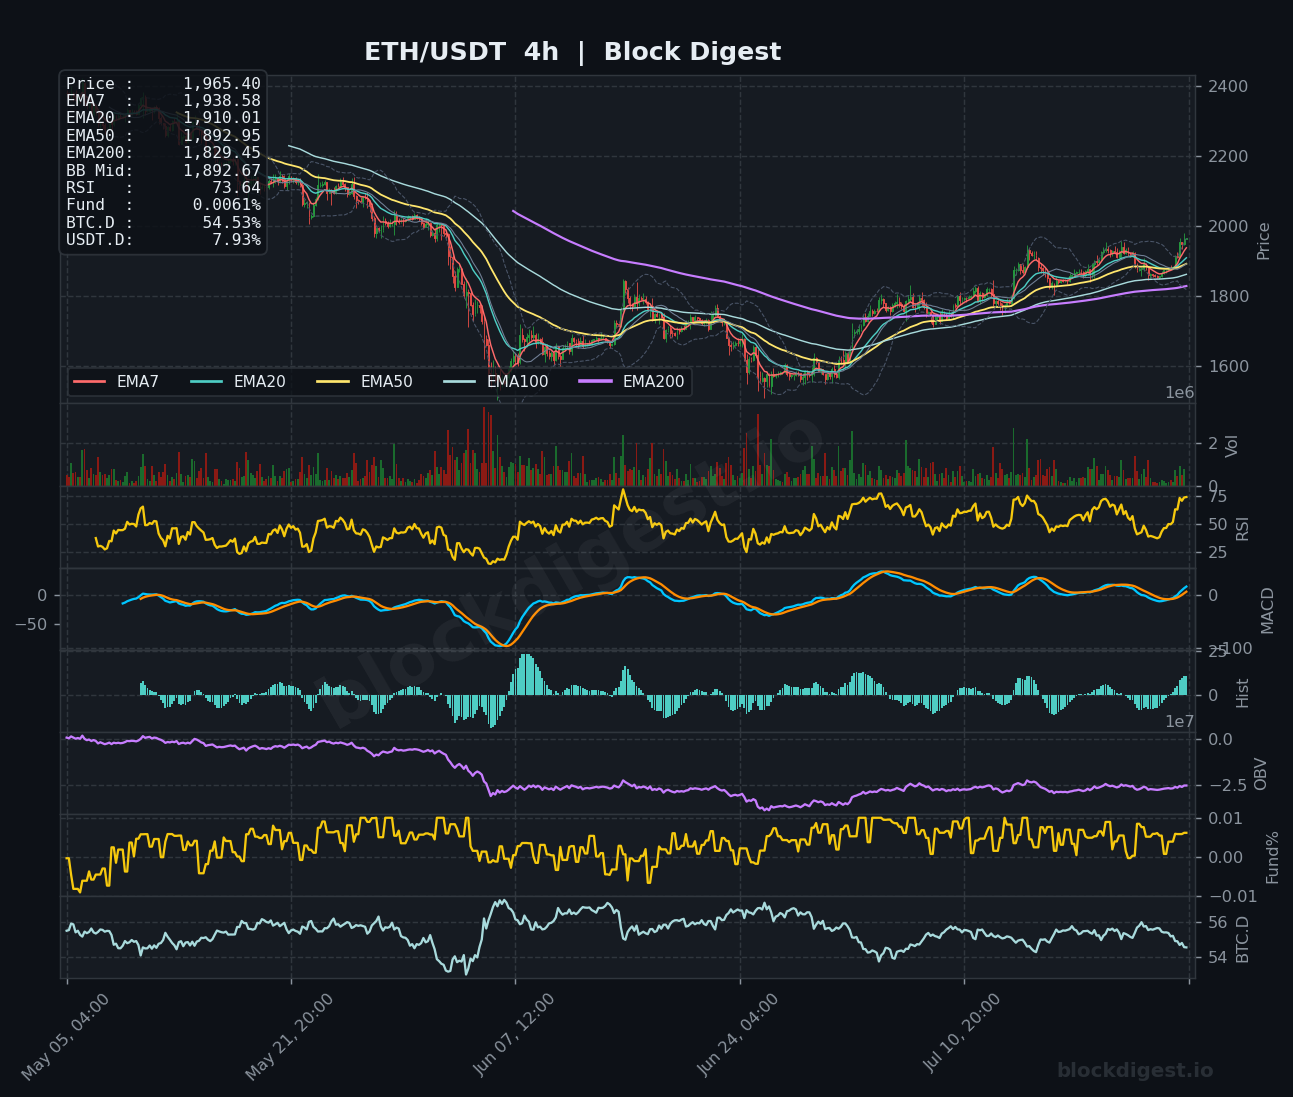
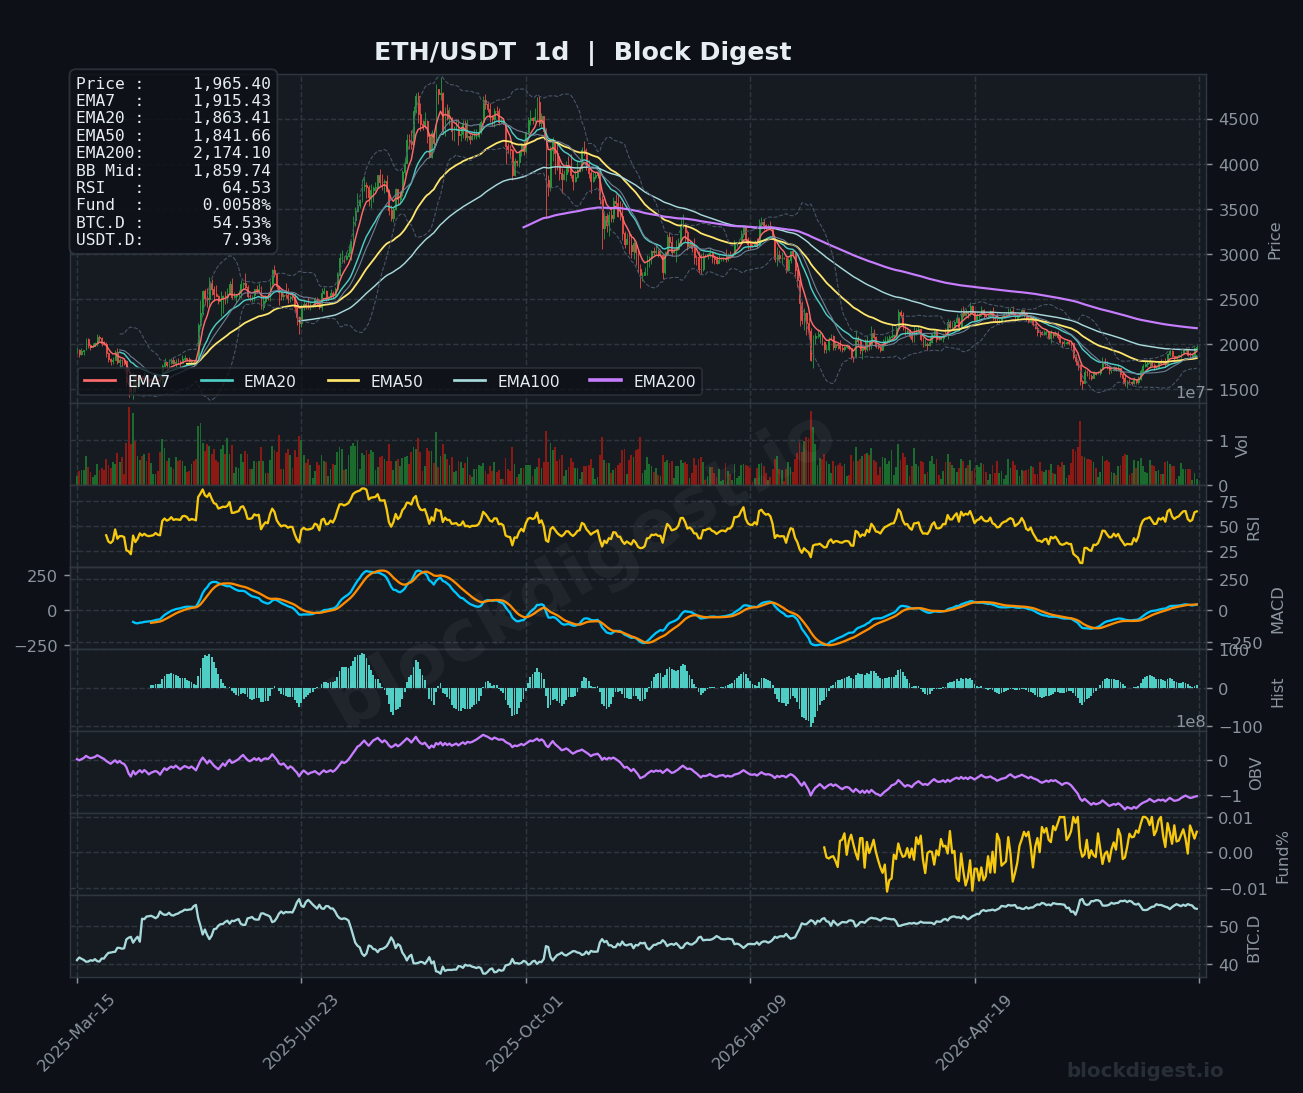
Across all three timeframes, there is a clear confluence of resistance clustered between $1,960 and $2,030, making this zone the pivotal battleground for the week ahead. On the daily chart, the EMA7 ($1,915) and EMA20 ($1,863) have achieved a bullish short-term alignment, with price trading above both — a positive development that supports the nascent recovery case seen from the April–May lows. However, on the 4-hour chart, RSI has surged to an elevated 73.64 following the intraweek rally, indicating short-term overbought conditions that historically precede mean-reversion pullbacks. The convergence of weekly resistance and 4H overbought readings at the same price zone warrants caution for directional traders looking to add long exposure at current levels.
Key Weekly Levels
- Weekly Resistance:
- $2,000–$2,026 — Psychological round number confluent with weekly BB midline ($1,998) and EMA20 ($2,025); primary resistance zone for this weekly candle
- $2,174 — Daily EMA200, a major macro resistance level that marked the ceiling of prior recovery attempts and would represent a significant structural reclaim
- $2,400–$2,410 — Weekly EMA50 area; a level that aligns with prior consolidation zones from late 2025 and represents a medium-term bull/bear structural pivot
- Weekly Support:
- $1,840–$1,863 — Daily EMA50 ($1,841) and EMA20 ($1,863) cluster; first meaningful support on any retracement from current levels
- $1,750–$1,780 — Prior horizontal base that served as a key accumulation zone during the mid-2026 lows and a structural floor on the weekly chart
- $1,500–$1,550 — Cycle low support region from early 2026; a breakdown to this area would represent a significant deterioration in market structure
Momentum & Volume Analysis
The weekly RSI at 44.22 reflects a market that is recovering from deeply oversold territory but has not yet reached a neutral reading of 50 — historically, sustained rallies require this level to be reclaimed and held as support. On the daily timeframe, the RSI at 64.53 shows more constructive momentum and is approaching overbought territory, mirroring the stretched 4H reading of 73.64 that suggests the intraweek move may need to consolidate before continuing. Block Digest’s BD Pulse Score of 30/100 reinforces a bearish structural read, and the OBV trend reading of -1 confirms that cumulative volume pressure remains net negative — the rally has not yet been accompanied by the kind of sustained buying volume needed to validate a genuine trend reversal. The funding rate of +0.0048% remains mildly positive, indicating a slight long bias in the derivatives market without the excessive leverage that typically precedes violent liquidations.
BTC Dominance & Altcoin Implications
BTC dominance is holding at 54.58%, having risen steadily from the low-40% range seen in the 2024 altcoin season, a trend that continues to suppress ETH’s relative performance and limit the broader altcoin rotation. The elevated dominance reading — visible on the BTC.D subpanel across all three charts — suggests capital remains consolidated in Bitcoin rather than rotating into Ethereum and altcoins, consistent with the cautious macro environment driven by geopolitical tensions and rate expectations. For a meaningful ETH outperformance leg to materialize, BTC.D would need to show a convincing reversal from current levels, which at this stage has not been confirmed.
Risk Scenarios
- Bull case: A weekly close above $2,026 (EMA20) and the BB midline would signal a structural shift on the weekly chart, opening the door toward the $2,174 daily EMA200 and eventually the $2,400 region. This scenario is supported if the two consecutive weeks of Bitcoin ETF inflows continue, macro conditions stabilize, and the 60.5% long positioning in the market (per BD Pulse data) is rewarded by follow-through buying.
- Bear case: A rejection from the $2,000–$2,026 resistance zone followed by a daily close below the $1,863 EMA20 would signal the recovery is exhausted and reinstate the broader downtrend. This outcome becomes increasingly likely if ETF outflows accelerate, BTC dominance rises further, or macro headwinds from the U.S.-Iran conflict and sticky rates intensify — with initial downside targets at $1,750 and, in a worst-case scenario, a retest of $1,500.
Weekly Outlook
ETH enters the final days of July 2026 at a decisive inflection point — trading directly below the $2,000 psychological level and the weekly BB midline, with the market’s short-term fate hinging on whether bulls can absorb the overhead supply concentrated in the $2,000–$2,026 zone. The 4H RSI at 73.64 and the BD Pulse Score of 30/100 both argue for caution here, suggesting a near-term consolidation or pullback is more probable than an immediate continuation higher. The macro backdrop remains challenging, with the U.S.-Iran conflict, a stronger dollar, and competition from AI equities all weighing on risk appetite, though Standard Chartered’s renewed $100,000 BTC year-end target provides a constructive longer-term narrative. Key events to monitor this week include any continuation of Bitcoin ETF flow data, further signals from the SEC’s crypto rulemaking agenda, and Q2 earnings that may influence broader risk-on sentiment. The overall weekly bias is cautiously neutral to bearish in the near term, with a watchful eye on $2,000 as the line in the sand — a clean daily close above it would meaningfully shift the risk/reward in favor of bulls.
Disclaimer: This analysis is for informational purposes only and does not constitute financial advice. Cryptocurrency markets are highly volatile and unpredictable. All trading decisions should be made based on your own research and risk tolerance. Block Digest is not responsible for any financial losses incurred as a result of acting on this content.