Weekly Market Overview
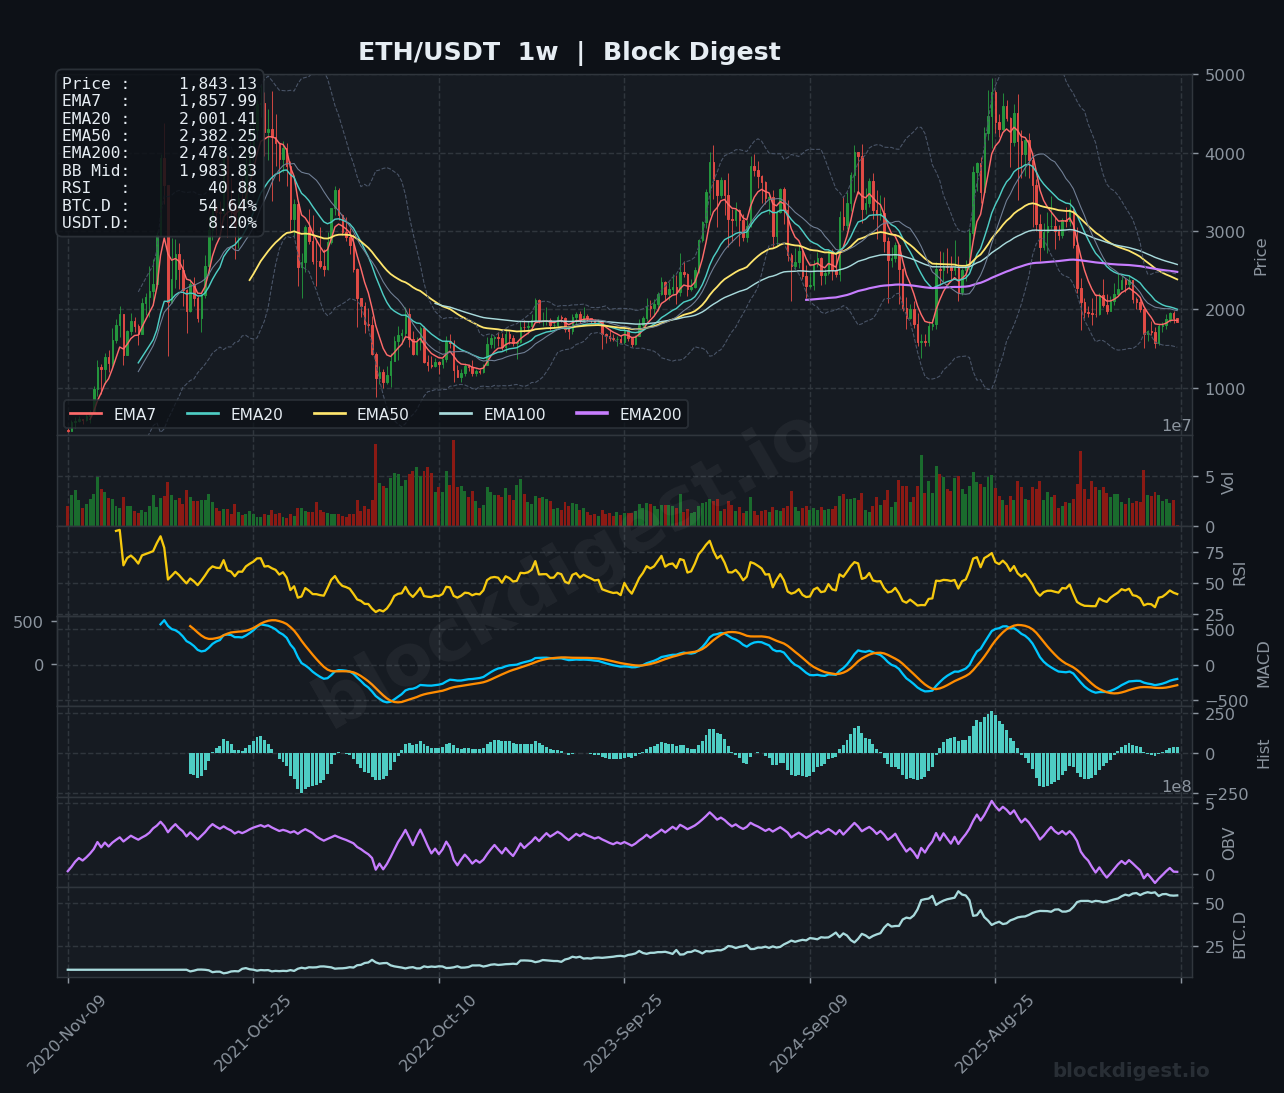
Ethereum enters the week of August 3, 2026 under meaningful selling pressure, with price trading around $1,843 after a 3%+ decline in the most recent session. The weekly candle structure reflects a continuation of the broader downtrend that has dominated ETH since its cycle highs, with price struggling to sustain any meaningful recovery above the $1,950 resistance band. The July recovery attempt — which briefly pushed ETH toward the $1,950–$2,000 zone — has now visibly stalled, and sellers are reasserting control as the market sits compressed near multi-month lows. The current structure is one of distribution rather than accumulation, with each rally failing at progressively lower highs.
Higher Timeframe Structure
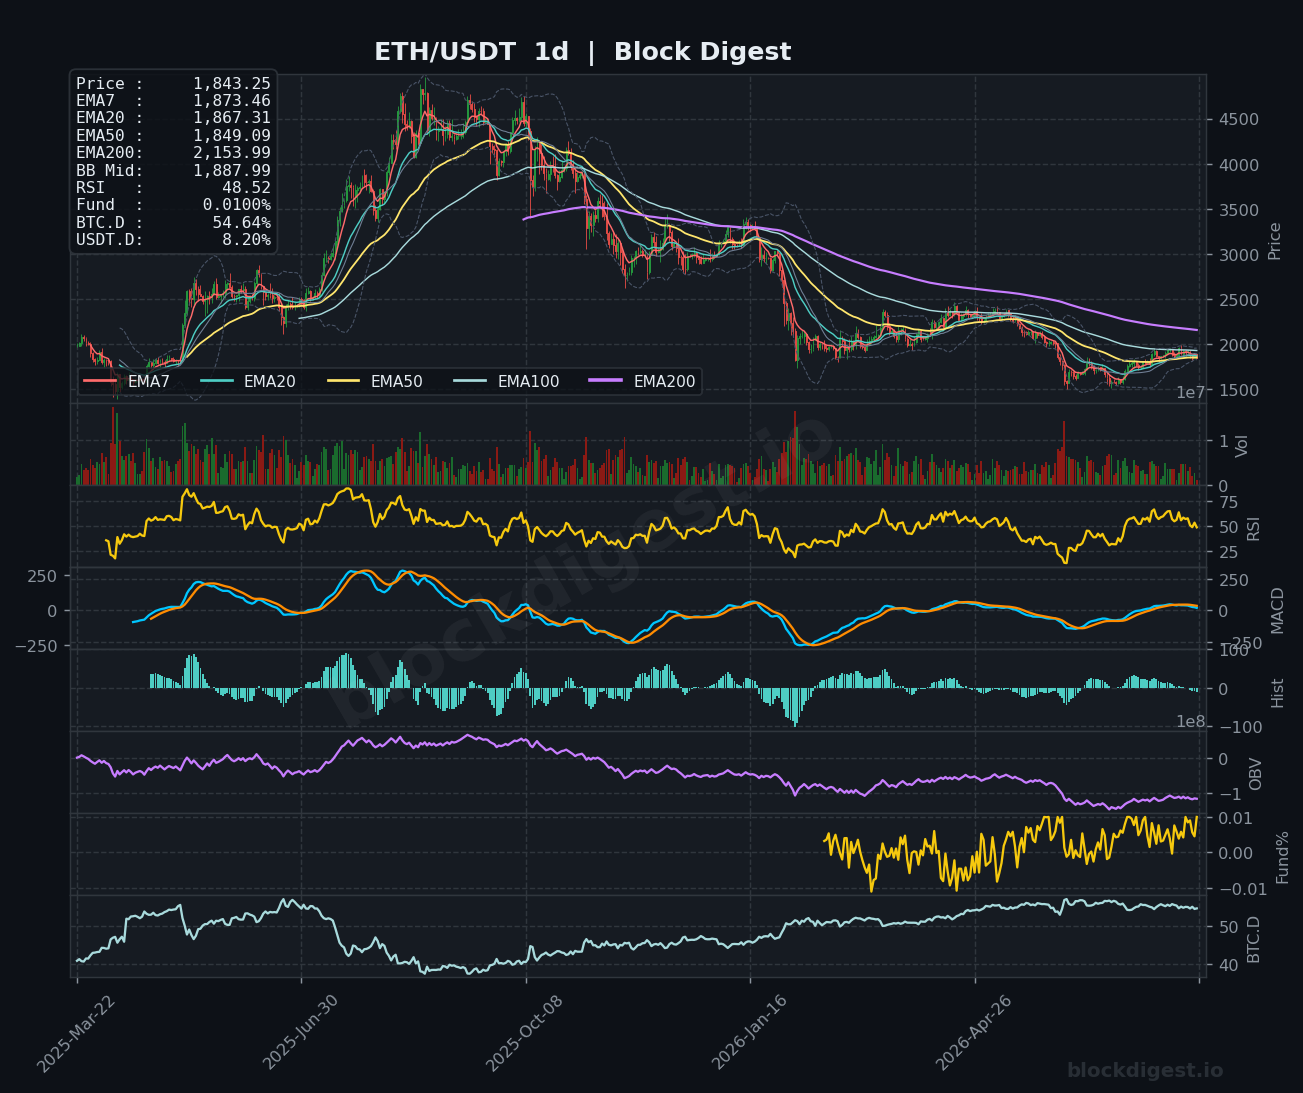
On the weekly chart, ETH’s EMA alignment is unambiguously bearish: price sits below the EMA7 ($1,857), EMA20 ($2,001), EMA50 ($2,382), and the EMA200 ($2,478), with all higher EMAs acting as overhead resistance in a waterfall formation. The weekly Bollinger Band midline sits at approximately $1,983, and price remains pinned below it — a historically bearish positioning that suggests the path of least resistance continues lower. The weekly RSI of 40.88 reflects sustained bearish momentum without yet reaching the extreme oversold readings that historically precede major cycle reversals; ETH has visited the low-30s RSI range before meaningful bounces in prior cycles, suggesting further compression is possible. Macro context from the daily chart reinforces this — the EMA200 on the daily sits at $2,153, a level ETH has failed to reclaim for months.
Multi-Timeframe Confluence
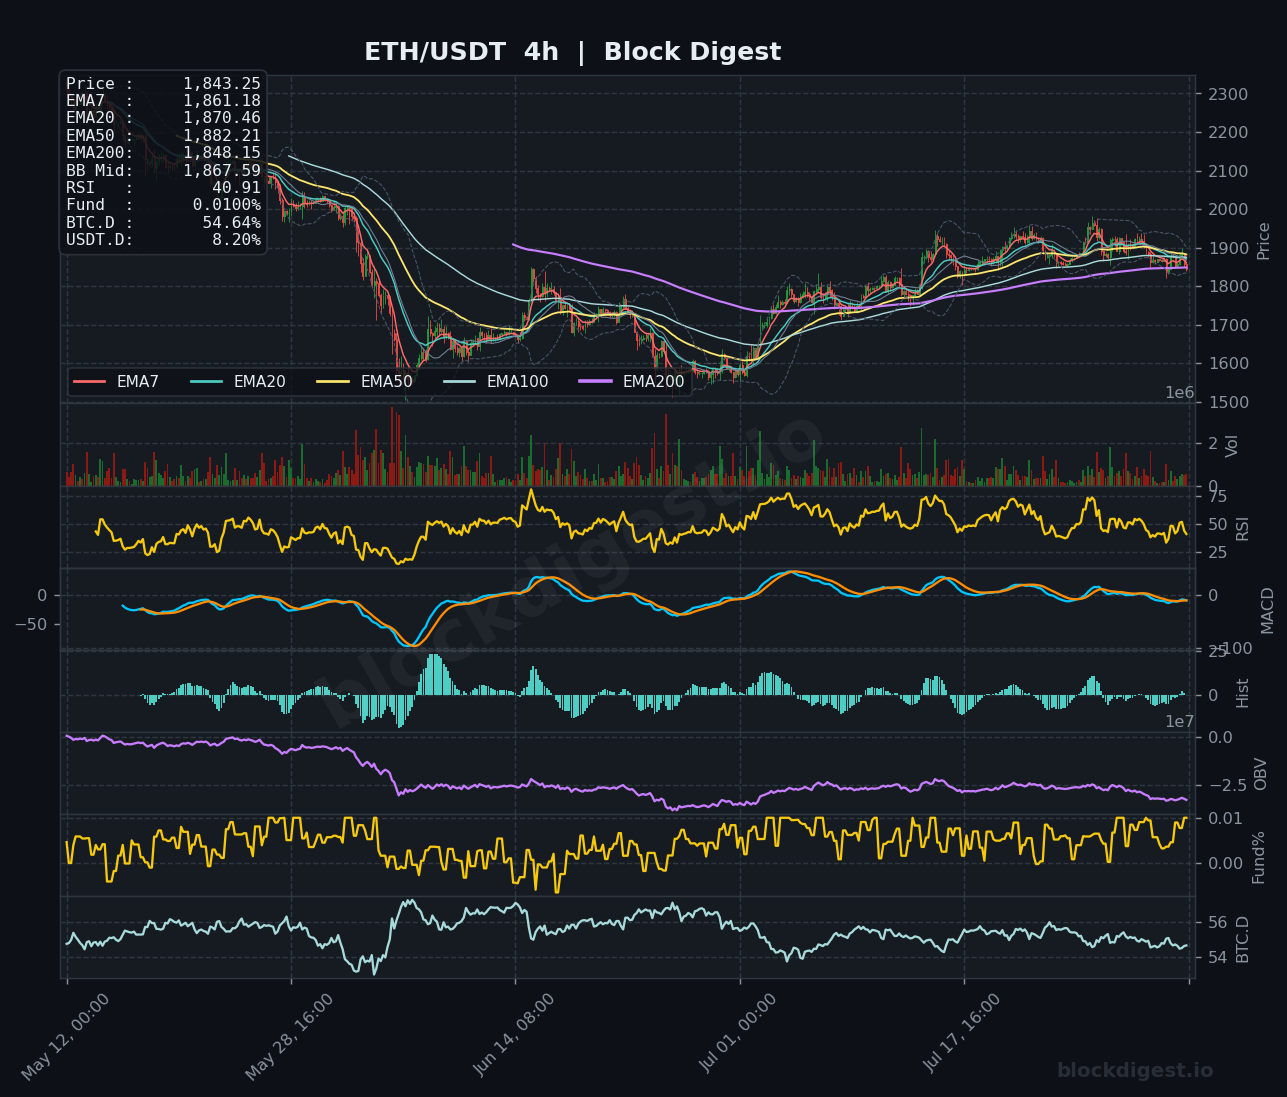
All three timeframes are aligned in bearish confluence, with no meaningful divergence offering near-term bullish hope. On the 4-hour chart, price is trading below the EMA7 ($1,861), EMA20 ($1,870), EMA50 ($1,882), and even the local EMA200 ($1,848), with the price action consolidating in a tight band just above the EMA200 — a precarious perch. The daily chart confirms the breakdown from the rising trendline that supported the July recovery, with the daily RSI at 48.52 fading from the midline and threatening to slip back into bearish territory. Collectively, the weekly, daily, and 4-hour structures agree: ETH is trapped below a dense cluster of resistance EMAs between $1,857 and $1,882, and until those are reclaimed with conviction, intraweek rallies are likely to be sold.
Key Weekly Levels
- Weekly Resistance: $1,950 — the immediate rejection zone where July’s recovery stalled and where the local EMA cluster converges; $2,000–$2,001 — the psychological round number aligning with the weekly EMA20, a critical reclaim level for any structural trend reversal; $2,153 — the daily EMA200, representing the macro bear-to-bull pivot that ETH has failed to recapture.
- Weekly Support: $1,800 — the near-term psychological floor and demand zone that has provided intermittent buying interest; $1,750 — the next significant structural support from prior consolidation lows, a level whose failure would accelerate bearish momentum; $1,600 — a deeper macro support zone that aligns with the lower Bollinger Band range on the weekly and represents a potential capitulation target if sentiment deteriorates sharply.
Momentum & Volume Analysis
Our proprietary BD Pulse Score — currently reading 23/100 (Extreme Bear) — paints a stark picture of the underlying momentum environment, corroborating what the charts are showing technically. Weekly RSI at 40.88 and the 4-hour RSI at 40.91 are in agreement, both hovering in the lower half of the range without reaching oversold extremes, meaning there is no technical exhaustion signal to trigger a meaningful bounce yet. The OBV on both the weekly and daily charts continues trending negatively, consistent with our BD Pulse OBV Trend reading of -1, confirming that volume is flowing out of ETH rather than accumulating at current levels — a telling sign that smart money is not aggressively defending this price range. The funding rate of +0.0066% is marginally positive, suggesting the market isn’t leaning heavily short despite the weakness, which paradoxically removes a potential short-squeeze catalyst that could otherwise spark a relief rally.
BTC Dominance & Altcoin Implications
BTC dominance at 54.65% — confirmed across all three chart timeframes — remains elevated and continues to trend upward on the weekly, signaling that capital rotation into altcoins like ETH has not yet materialized in any sustained way. USDT dominance at 8.20% remains a meaningful sidelined cash figure, but the absence of a catalyst to deploy it into ETH specifically is notable, particularly as institutional portfolios now have diversified expressions of risk appetite beyond crypto. Until BTC dominance shows a clear weekly rejection and rollover from current levels, ETH and broader altcoins are likely to continue underperforming relative to Bitcoin.
Risk Scenarios
- Bull case: A daily close above $1,950 with expanding volume would be the first credible signal of a short-term trend reversal, potentially opening a move toward the $2,000–$2,050 zone where the weekly EMA20 and the psychological round number converge. Sustained reclaim of $2,000 on a weekly closing basis, combined with a reversal in the BD Pulse Score above 40, would meaningfully shift the macro outlook and could target $2,153 (daily EMA200) as the next structural objective.
- Bear case: Failure to hold the $1,800 support zone on a daily closing basis would expose ETH to a swift move toward $1,750, and a break there would likely trigger stop-driven selling toward the $1,600 capitulation zone. Given the negative OBV trend and extreme bear BD Pulse reading, a broader market risk-off event — or sustained BTC dominance expansion — could accelerate this scenario without meaningful technical support until the $1,600 region.
Weekly Outlook
The directional bias for the week ahead is cautiously bearish, with the burden of proof firmly on bulls to demonstrate they can recapture the $1,882–$1,950 EMA cluster before any constructive long bias can be entertained. The immediate priority for bears watching for confirmation is a clean daily close below $1,800 — that would likely trigger accelerated downside toward $1,750 and beyond. Key catalysts to monitor include any macro risk sentiment shifts, BTC’s ability to hold its own critical support levels, and whether the Fear & Greed Index recovery noted in broader market data can translate into actual ETH buying flows rather than just sentiment improvement. The long/short ratio of 2.04 (67.1% long) suggests retail participants remain stubbornly positioned for a bounce, which historically creates fuel for further liquidation-driven moves lower if key supports give way. Until ETH reclaims $1,950 with volume and the BD Pulse Score begins recovering from its extreme bear reading, the risk/reward favors defensive positioning and patience over aggressive long entries.
Disclaimer: This analysis is for informational purposes only and does not constitute financial advice. Cryptocurrency markets are highly volatile and unpredictable. All trading decisions should be made based on your own research and risk tolerance. Block Digest is not responsible for any financial losses incurred as a result of acting on this content.
Stay Ahead of the Market
Follow BlockDigest for crypto market intelligence, research and real-time updates.