Weekly Market Overview
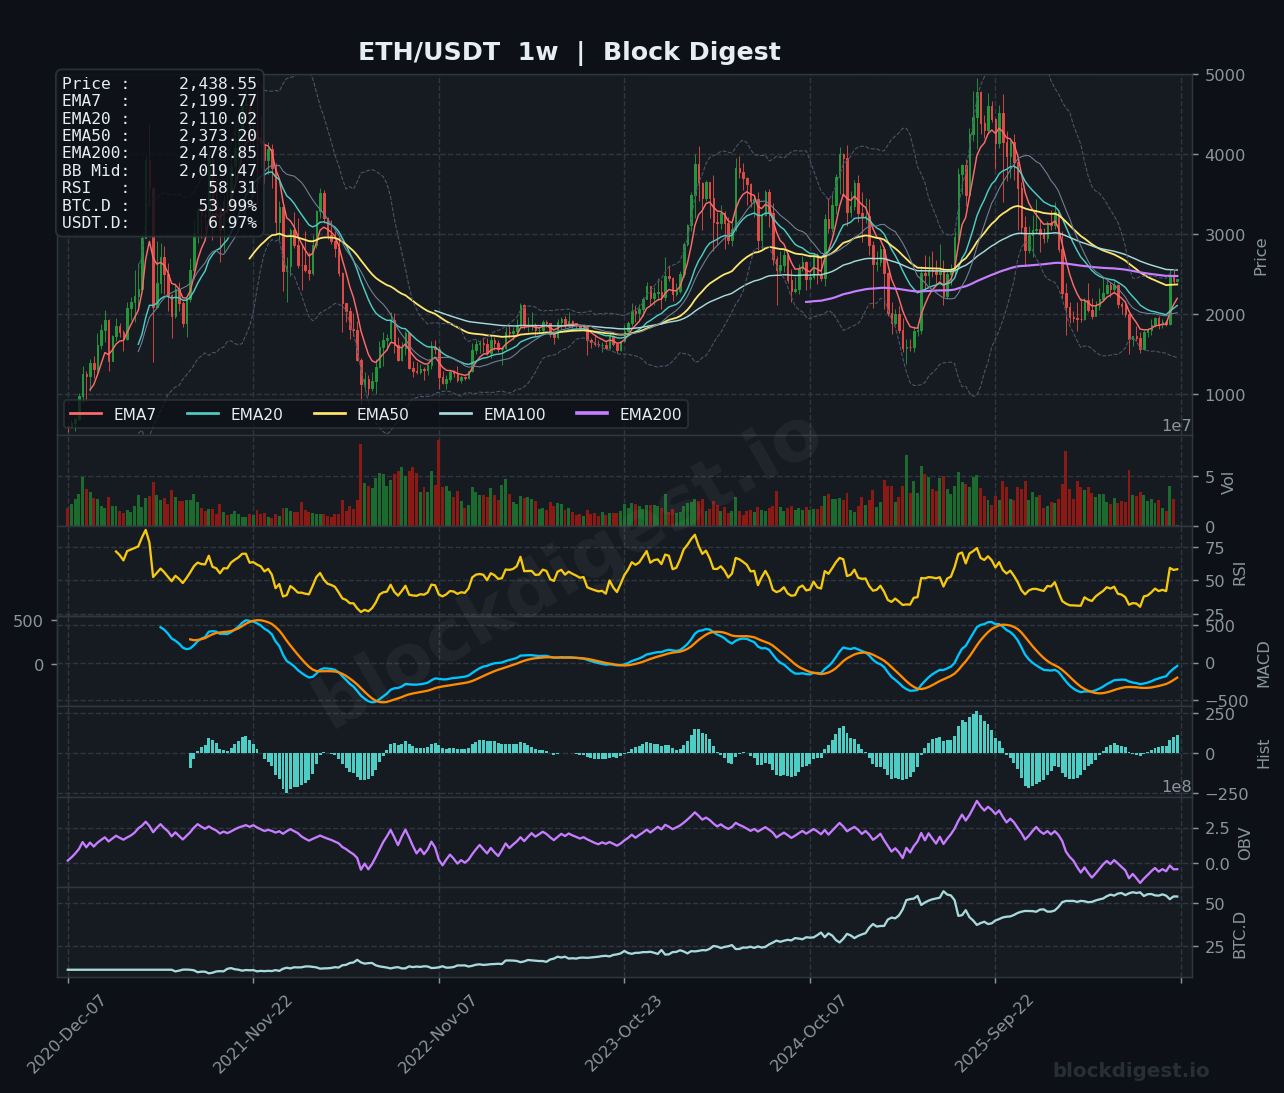
Ethereum trades at $2,438.55 as the final weekly candle of August consolidates near multi-month highs following a powerful impulsive expansion off the summer base. The weekly structure shows aggressive absorption of overhead supply, with price reclaiming the weekly 50 EMA at $2,373.20 and pressing directly into major structural resistance. This transition shifts Ethereum from an extended range-bound accumulation phase into an active retest of mid-cycle supply zones. Trading volume remains elevated relative to early-summer baselines, signaling that institutional and spot participation continue to underpin the broader advance.
Higher Timeframe Structure
The weekly chart reflects a decisive structural shift as price holds comfortably above both the 7-week EMA ($2,199.77) and 20-week EMA ($2,110.02). Price is now pressing against the cluster formed by the 200-week EMA at $2,478.85 and the descending 100-week EMA at $2,553.60, the primary macro pivot zones established during the 2025 breakdown. Positioned well above the 20-week Bollinger Band baseline ($2,019.47) and testing the upper band envelope at $2,577.36, Ethereum is challenging the ceiling of its macro mean-reversion range. A sustained weekly close above the 100-week EMA would resolve a multi-year consolidation pattern and confirm a high-timeframe structural regime change.
Multi-Timeframe Confluence
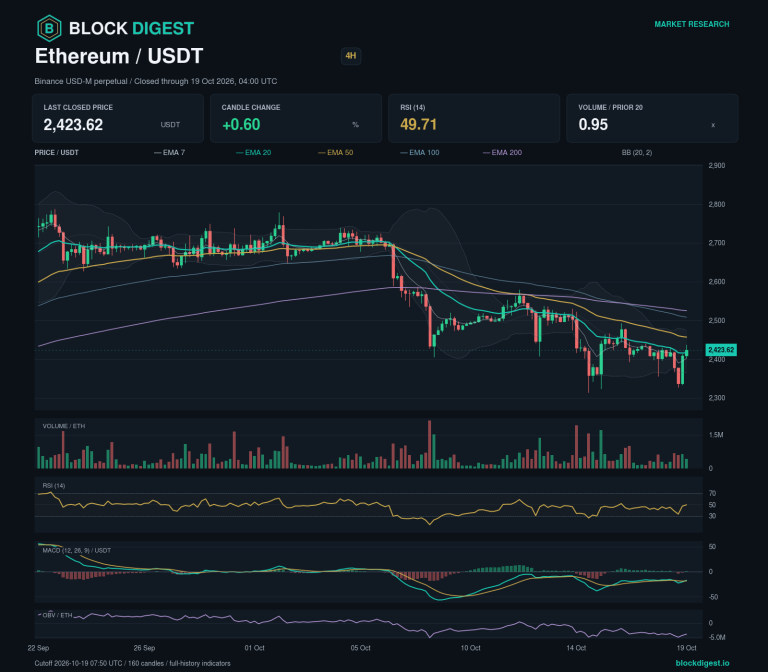
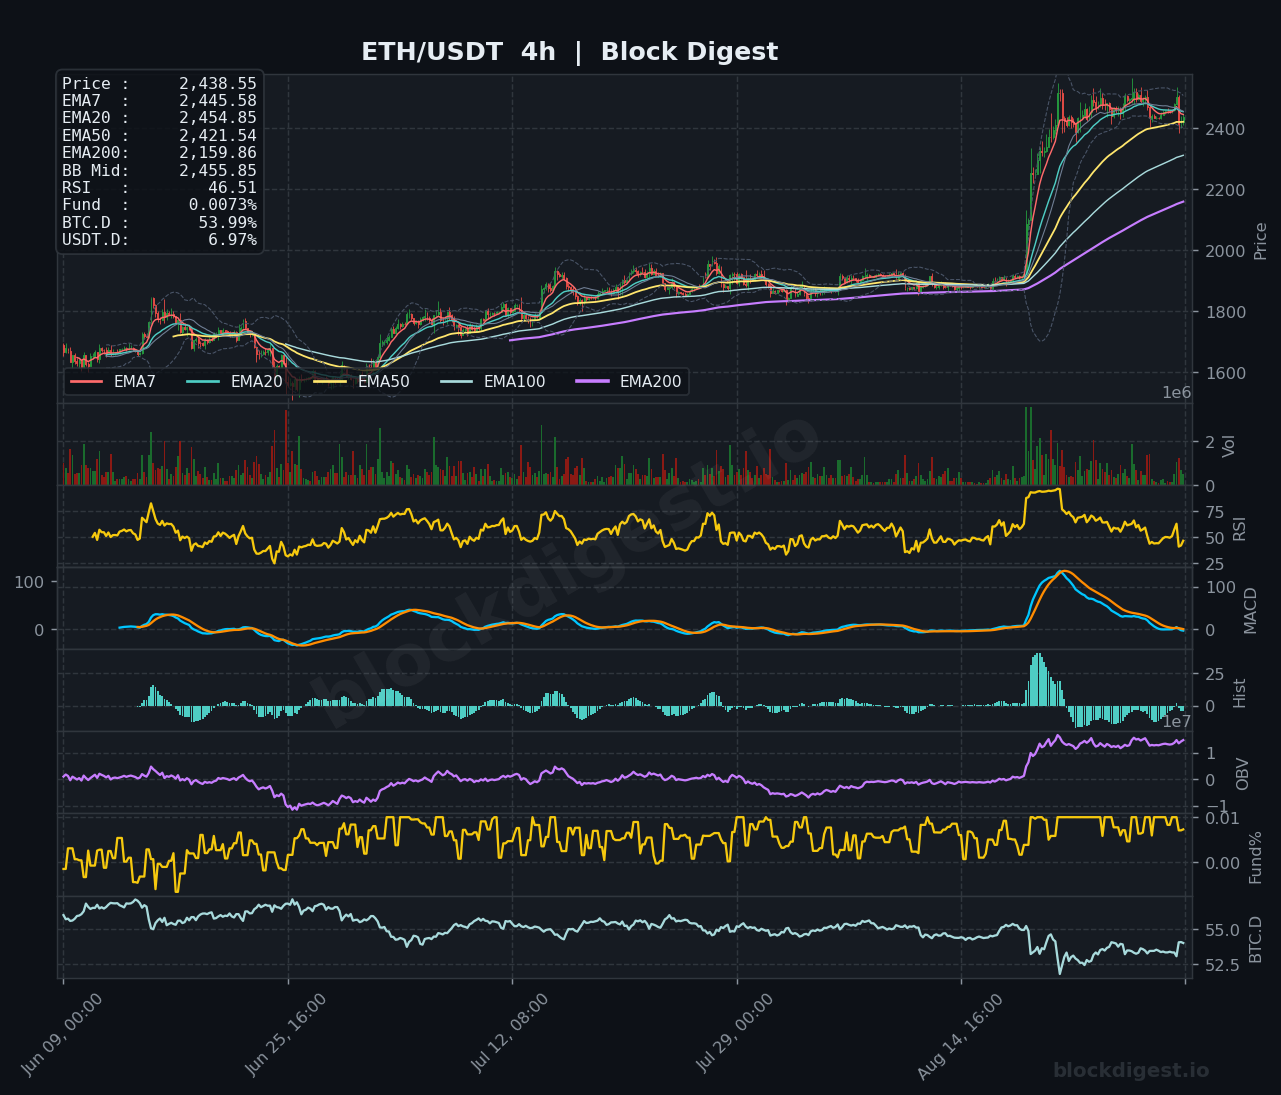
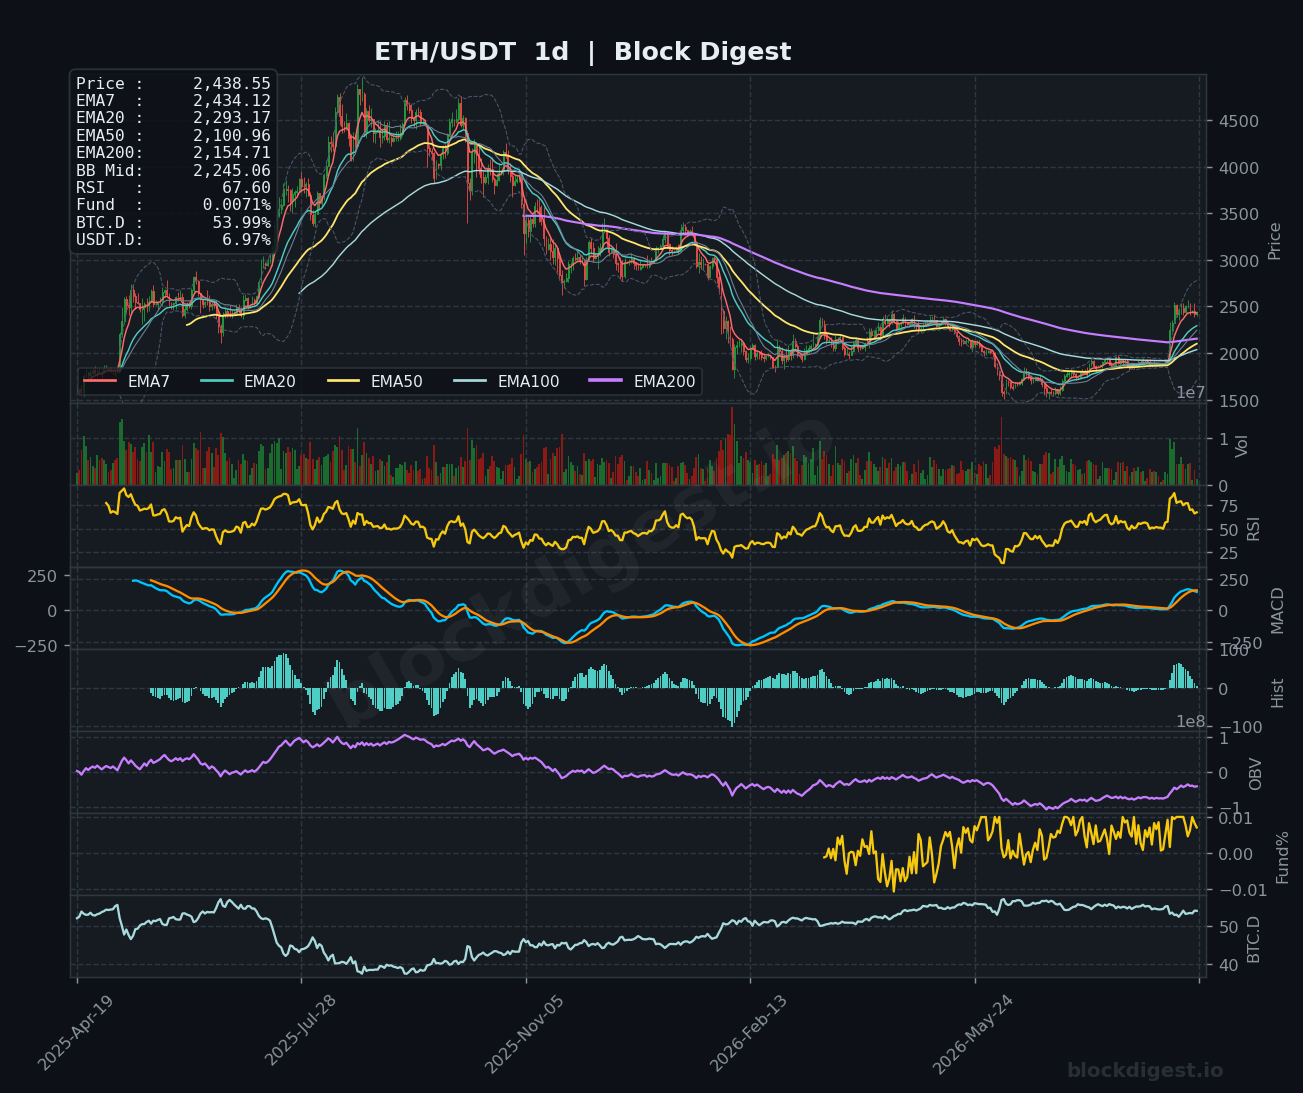
Alignment across multiple timeframes favors buyers, with lower timeframes undergoing routine digestion after the vertical expansion. On the daily timeframe, a textbook moving average stack has formed, with the 7-day EMA ($2,434.12) and 20-day EMA ($2,293.17) trending sharply above the rising 200-day EMA ($2,154.71). The 4-hour timeframe displays orderly sideways compression between its lower Bollinger Band ($2,404.20) and upper band ($2,507.50), allowing the 4-hour RSI to reset to 46.51 while the 50-period EMA ($2,421.54) provides immediate dynamic support. This intraweek consolidation directly above the weekly 50 EMA ($2,373.20) suggests shallow pullbacks are being aggressively absorbed before the next potential leg higher.
Key Weekly Levels
- Weekly Resistance:
- $2,478–$2,508: Immediate supply ceiling defined by the 200-week EMA ($2,478.85), the 4-hour upper Bollinger Band ($2,507.50), and August swing highs.
- $2,554–$2,578: Major macro inflection band where the 100-week EMA ($2,553.60) aligns with the weekly upper Bollinger Band ($2,577.36).
- $2,778–$2,850: Extended technical target marked by the daily upper Bollinger Band ($2,778.60) and the primary breakdown origin from late 2025.
- Weekly Support:
- $2,404–$2,421: Immediate tactical floor formed by the 4-hour lower Bollinger Band ($2,404.20) and the 4-hour 50 EMA ($2,421.54).
- $2,293–$2,373: High-confluence intermediate base anchored by the daily 20 EMA ($2,293.17), daily mid Bollinger Band ($2,245.06), and weekly 50 EMA ($2,373.20).
- $2,110–$2,155: Structural trendline support combining the daily 200 EMA ($2,154.71), weekly 20 EMA ($2,110.02), and the macro breakout shelf.
Momentum & Volume Analysis
Momentum indicators across daily and weekly horizons confirm that market strength remains structurally intact. The weekly MACD histogram shows clear expansion at +110.49 as the MACD line (-45.75) surges toward a positive crossover against its signal line (-156.24), confirming powerful multi-week trend velocity. Complementing this, Block Digest’s proprietary BD Pulse prints 61/100, positioning market dynamics in bullish territory without entering overheated extremes. This controlled expansion is corroborated by the BD Extreme Index at +0.93σ, indicating room for further upward volatility before statistical exhaustion triggers.
| Indicator | Value | Context |
|---|---|---|
| ETH/USDT Spot Price | $2,438.55 | Testing weekly 200 EMA supply |
| Weekly 200 EMA | $2,478.85 | Primary resistance hurdle |
| Weekly 50 EMA | $2,373.20 | Reclaimed macro pivot support |
| Weekly 20 EMA | $2,110.02 | Long-term trend floor |
| Daily RSI (14) | 67.60 | Constructive bullish momentum |
| Weekly MACD Histogram | +110.49 | Accelerating trend velocity |
| Funding Rate | +0.0082% | Healthy, non-speculative leverage |
| Long/Short Ratio | 1.12 (52.8%) | Balanced derivative positioning |
Volume flow indicators paint a constructive picture. The daily RSI holds at 67.60, cooling slightly from overbought territory while avoiding any bearish divergence against local price peaks. Derivative positioning remains balanced; the aggregate funding rate hovers at +0.0082% alongside a Long/Short account ratio of 1.12. This absence of aggressive speculative leverage reduces the risk of cascading long squeezes and indicates that current price action is primarily driven by spot accumulation.
BTC Dominance & Altcoin Implications
Bitcoin Dominance (BTC.D) trades at 54.02%, pausing its multi-month climb and flattening near short-term local support. USDT Dominance (USDT.D) sits steady at 6.97%, reflecting stable liquidity conditions. With Bitcoin dominance stalling below recent cycle highs, Ethereum’s ability to maintain price stability above $2,400 provides the foundation for capital rotation into major altcoins. A decisive weekly breakout by ETH through $2,550 would likely trigger accelerated BTC.D compression, signaling a broader altcoin expansion phase heading into the final quarter of the year.
Risk Scenarios
- Bull case: A clean break and daily close above the 200-week EMA at $2,478.85 opens immediate continuation toward the 100-week EMA confluence zone at $2,553–$2,577. Sustained buy volume through this threshold invalidates multi-month bear market structures and clears a path toward the daily upper Bollinger Band target at $2,778.60.
- Bear case: Rejection at the $2,480–$2,500 supply cluster that breaks below the 4-hour 50 EMA ($2,421.54) and local lower band at $2,404.20 risks triggering a deeper liquidity sweep. Such a breakdown would expose the daily 20 EMA and weekly 50 EMA cluster between $2,293 and $2,373 as the primary secondary defense zone.
Weekly Outlook
Ethereum enters the first week of September with a constructive technical bias, supported by higher timeframe moving average recoveries and neutral derivative funding. Price action is now focused on clearing the $2,480–$2,550 supply block to confirm a new leg of the macro recovery.
Disclaimer: This analysis is for informational purposes only and does not constitute financial advice. Cryptocurrency markets are highly volatile and unpredictable. All trading decisions should be made based on your own research and risk tolerance. Block Digest is not responsible for any financial losses incurred as a result of acting on this content.
Stay Ahead of the Market
Follow BlockDigest for crypto market intelligence, research and real-time updates.