BTC Daily Analysis — May 01, 2026
**BTC Daily Analysis – May 01, 2026**
**Market Overview**
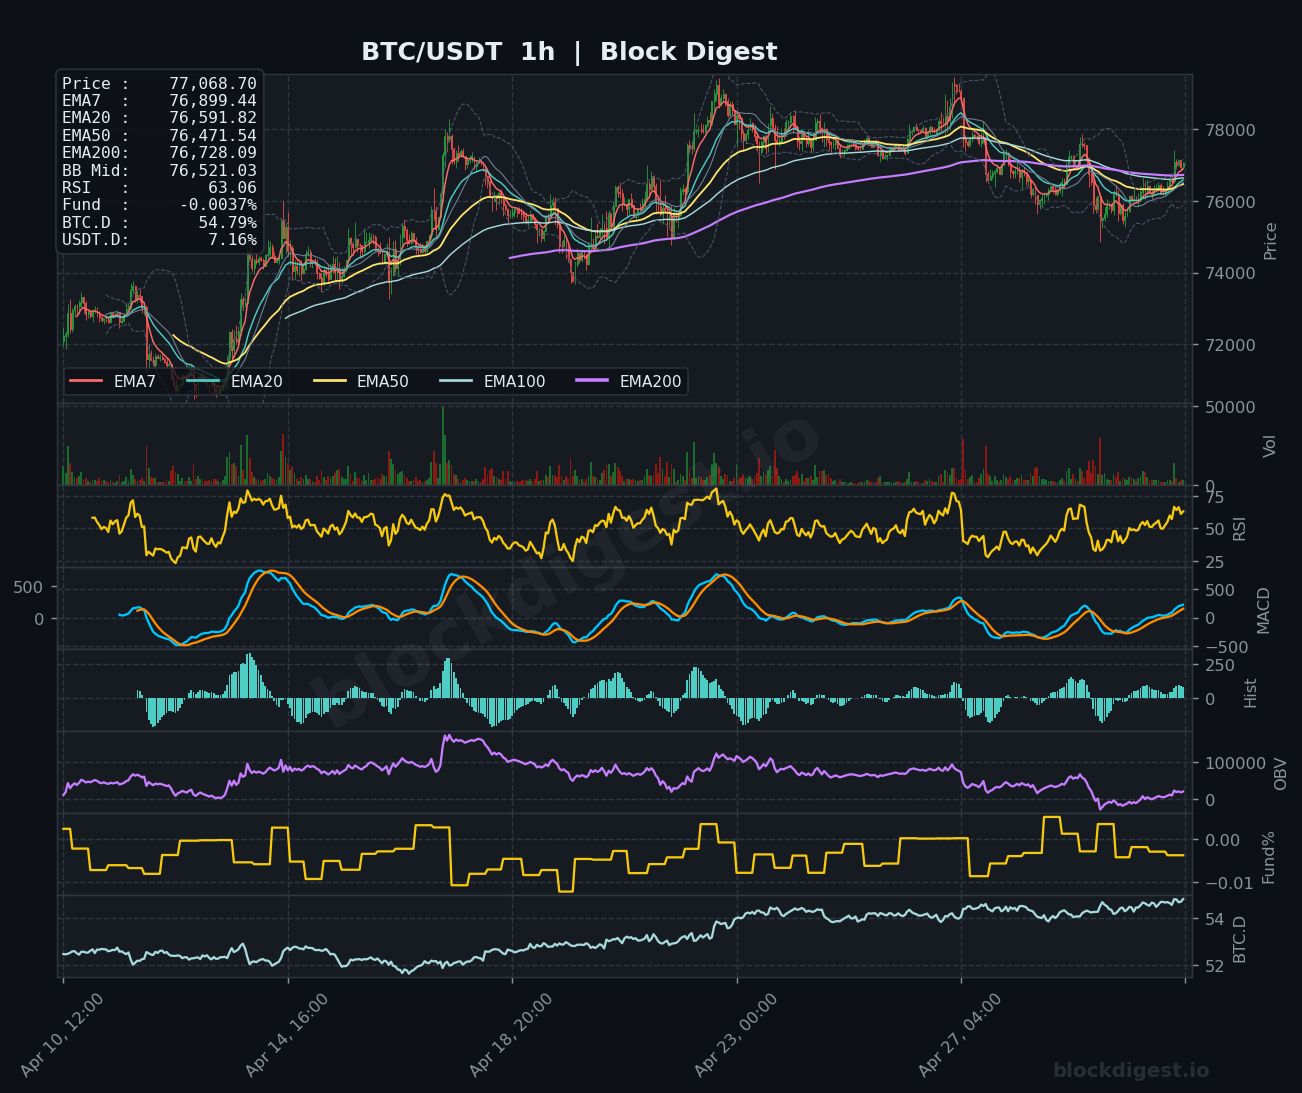
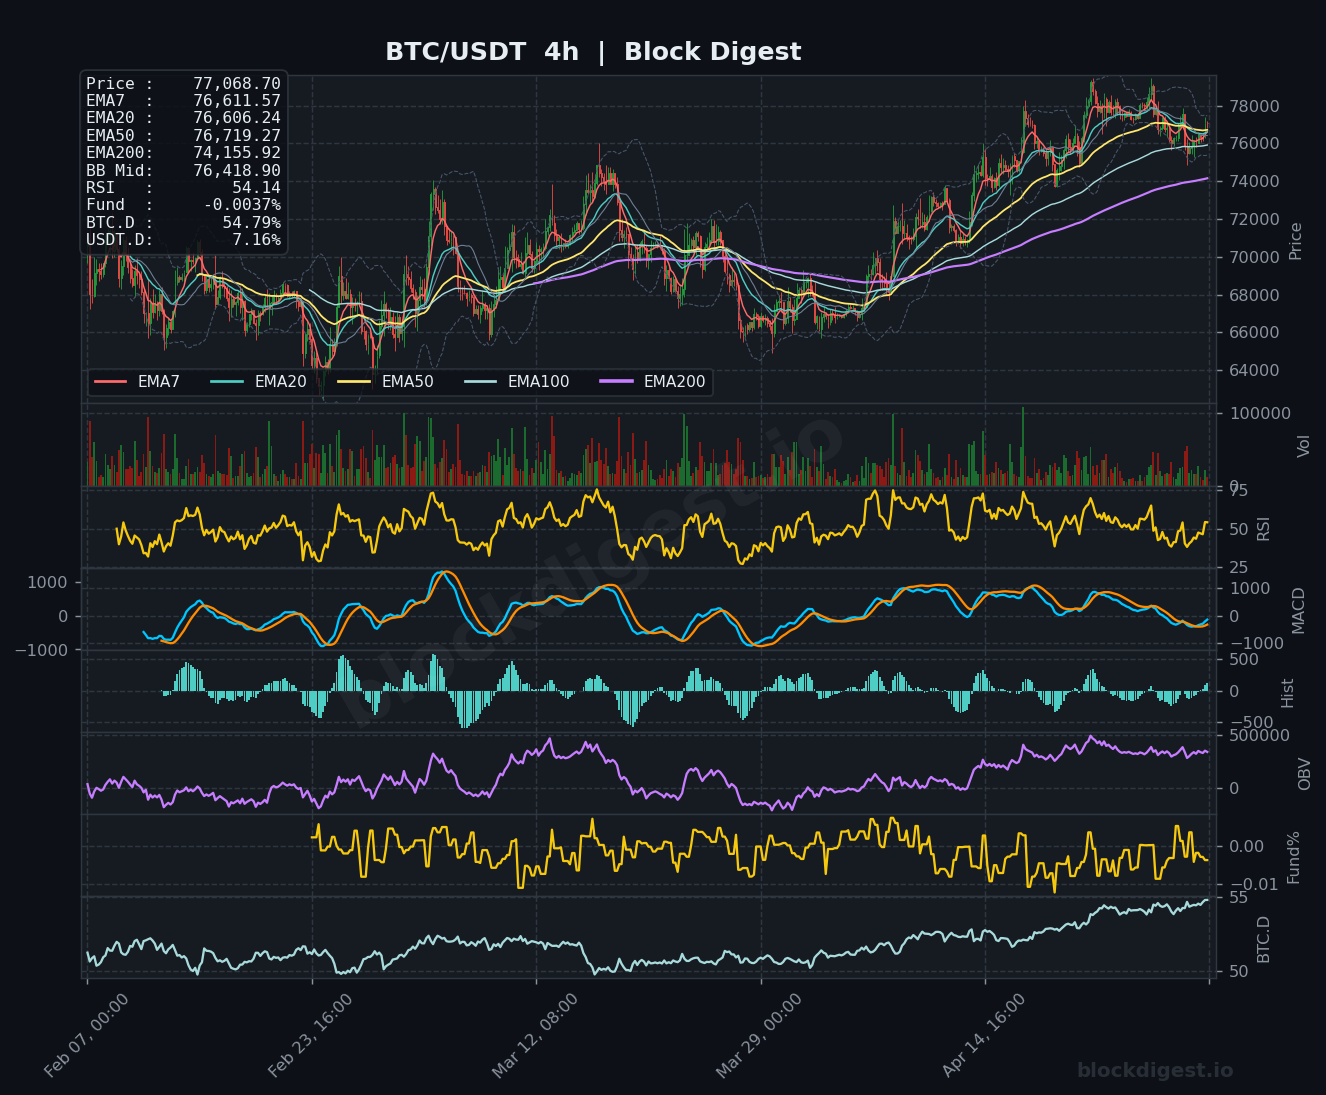
Bitcoin is trading at $77,068, positioned above all major EMAs across the 1-hour and 4-hour timeframes, signaling short-term bullish momentum. Price is currently testing the middle of the Bollinger Band range at $76,521 on the 1-hour chart, having recently bounced from the lower band zone around $76,000. However, the daily timeframe reveals a more complex picture: BTC remains below the critical EMA200 at $82,341 and continues to trade within a broader consolidation structure. The daily chart shows price attempting to reclaim the EMA50 at $73,765 with conviction, suggesting we’re in a recovery phase following a significant correction from the $120,000+ peaks visible earlier in the historical range.
**Multi-Timeframe Confluence**
There is notable divergence between lower and higher timeframes, creating a mixed technical backdrop. The 1-hour and 4-hour charts show bullish EMA stacking (7>20>50>100>200), with price trading above all moving averages, indicating short-term momentum favoring buyers. However, the daily timeframe tells a different story, with price still struggling below the EMA200 and showing a prolonged consolidation between the $65,000-$80,000 range. The $76,000-$76,500 zone emerges as critical confluence support where the 4-hour EMA cluster (EMA7: $76,611, EMA20: $76,606, EMA50: $76,719) aligns with the 1-hour Bollinger Band middle, making this a key pivot point for near-term directional moves.
**Key Levels to Watch**
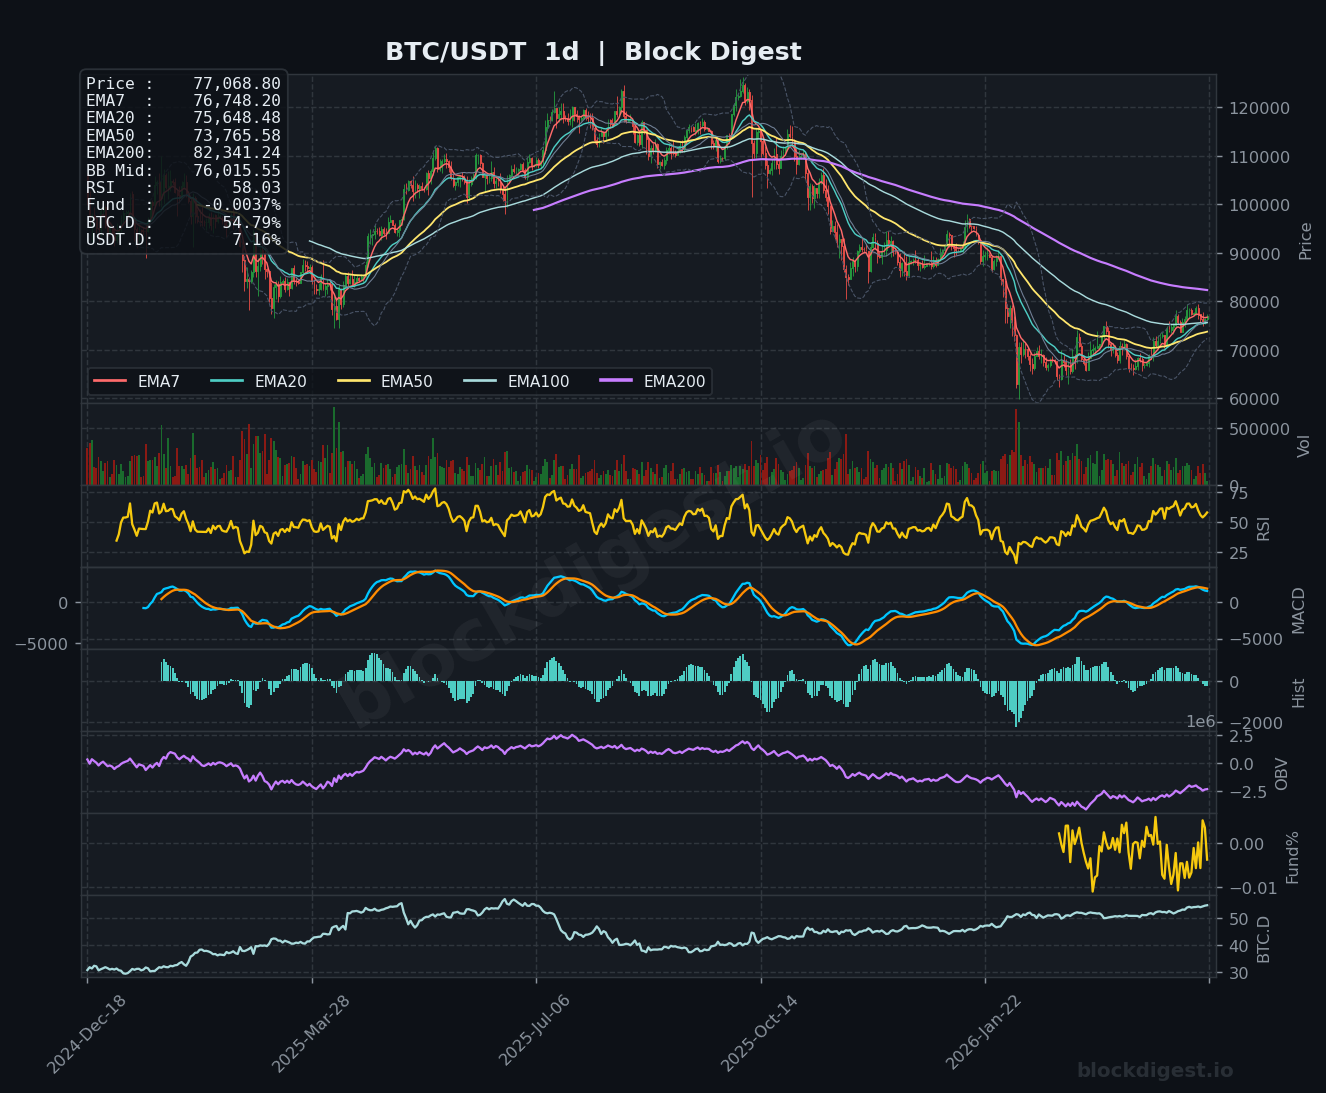
Resistance:
- $78,000-$78,500: Recent swing high visible on the 1-hour chart and psychological round number; initial upside target for continued short-term strength
- $80,000: Major psychological resistance and previous consolidation ceiling on the daily timeframe; reclaiming this level would mark a significant shift in market structure
- $82,341: Daily EMA200 – the most critical resistance for confirming a macro trend reversal; sustained acceptance above would signal a return to longer-term bullish conditions
Support:
- $76,000-$76,500: Immediate support cluster combining 4-hour EMA convergence, 1-hour Bollinger Band middle ($76,521), and recent consolidation lows
- $74,155: 4-hour EMA200 and daily EMA50 confluence zone; loss of this level would negate the recent recovery attempt and threaten deeper retracement
- $70,000-$71,000: Major support corresponding to previous consolidation lows on the daily chart and psychological round number; critical defense zone for maintaining broader range structure
**Momentum & On-Chain Signals**
RSI readings present a cautiously optimistic picture with the 1-hour at 63.06, 4-hour at 54.14, and daily at 58.03 – all positioned in neutral-to-bullish territory without reaching overbought extremes. The MACD shows a fresh bullish crossover on the 4-hour timeframe with the histogram turning positive, supporting near-term upside continuation, though the daily MACD remains relatively flat, indicating the larger trend lacks strong directional conviction. OBV trends show accumulation on lower timeframes with volume supporting the recent bounce, but daily OBV remains subdued compared to historical peaks, suggesting institutional accumulation is measured rather than aggressive. The Funding Rate at -0.0037% indicates a slight negative bias in perpetual markets, which paradoxically can be constructive as it suggests shorts are paying longs and excessive leverage has been flushed from the system.
**BTC Dominance & Market Sentiment**
BTC Dominance stands at 54.79%, showing a gradual uptrend from the 52-53% range visible in the historical data, indicating that capital is rotating into Bitcoin relative to altcoins. This typically signals a risk-off environment within crypto markets where traders seek relative safety in the largest digital asset. USDT Dominance at 7.16% remains relatively stable, suggesting neither aggressive risk-on nor panic-driven risk-off conditions in the broader market. The combination of rising BTC.D with stable USDT.D implies selective accumulation in Bitcoin rather than indiscriminate capital flight from crypto entirely, which provides a moderately constructive backdrop for BTC-specific price appreciation.
**Risk Scenarios**
Bullish case: A sustained hold above $76,500 with accompanying volume expansion would confirm short-term trend continuation, targeting the $78,000-$78,500 resistance zone initially. A decisive break and 4-hour close above $80,000 would open the path toward testing the critical daily EMA200 at $82,341, potentially triggering momentum-based buying and targeting $85,000-$88,000 in a bullish acceleration scenario.
Bearish case: Failure to hold the $76,000-$76,500 support confluence would invalidate the bullish structure on lower timeframes and likely trigger a retest of the $74,155 level (4h EMA200). A breakdown below $74,000 with increasing volume would suggest the recent recovery was merely a relief rally within a larger corrective phase, exposing the $70,000-$71,000 zone and potentially deeper support near $65,000.
**Outlook**
Bitcoin is at a critical juncture, exhibiting short-term bullish momentum while remaining structurally neutral on higher timeframes. The immediate bias favors consolidation-to-upside within the $76,000-$80,000 range, but conviction remains limited until BTC can reclaim and hold above the daily EMA200 at $82,341. In the next 24-48 hours, watch for price behavior around the $76,500 level – sustained acceptance above strengthens the bullish case for a retest of $78,000+, while failure here would shift focus back to defending $74,155. Volume expansion on any breakout attempt will be crucial for confirming directional moves. Until we see a clear resolution above $80,000 or below $74,000, traders should expect rangebound conditions with volatility concentrated around the EMA confluence zones. The setup favors patience and reactive positioning over aggressive directional bets.
Disclaimer: This analysis is for informational purposes only and does not constitute financial advice. Cryptocurrency markets are highly volatile and unpredictable. All trading decisions should be made based on your own research and risk tolerance. Block Digest is not responsible for any financial losses incurred as a result of acting on this content.