BTC Daily Analysis — April 27, 2026
Market Overview
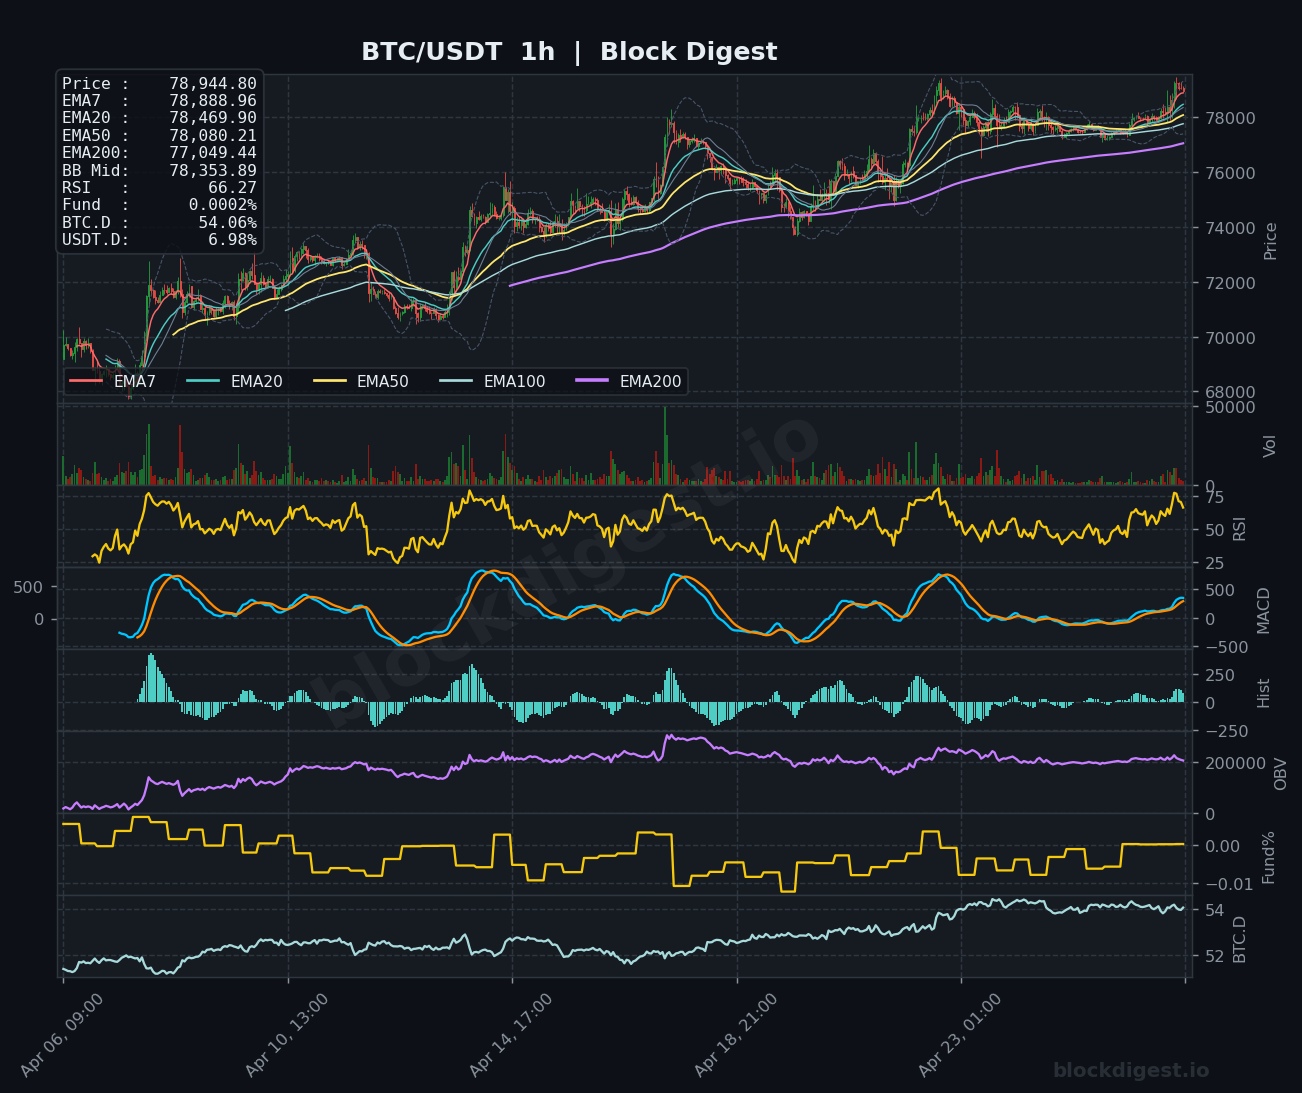
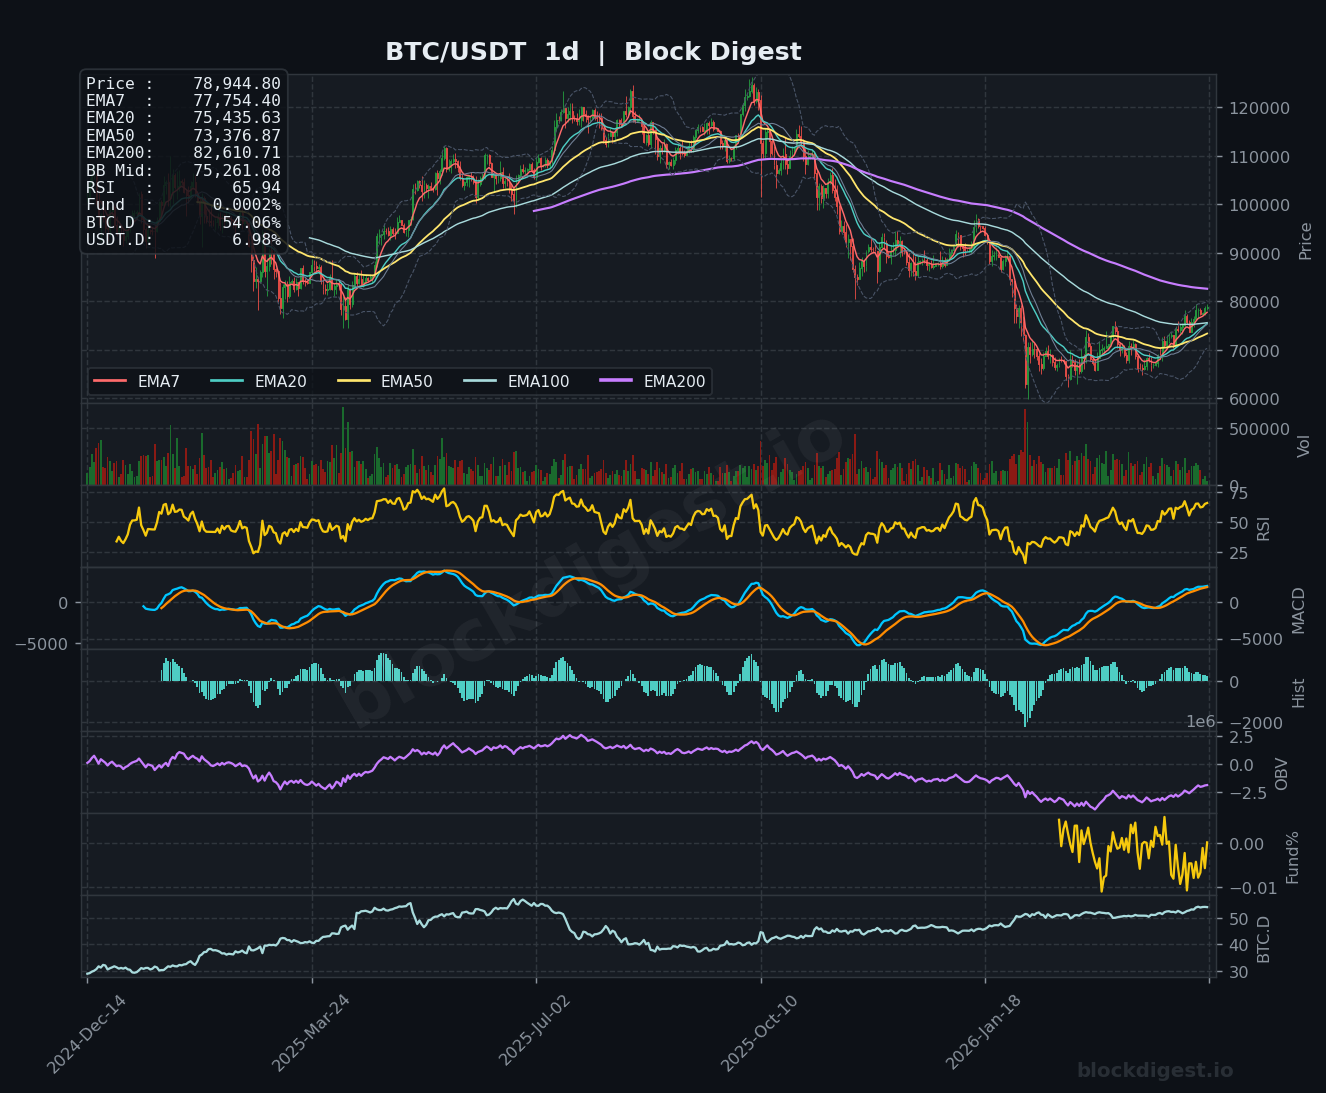
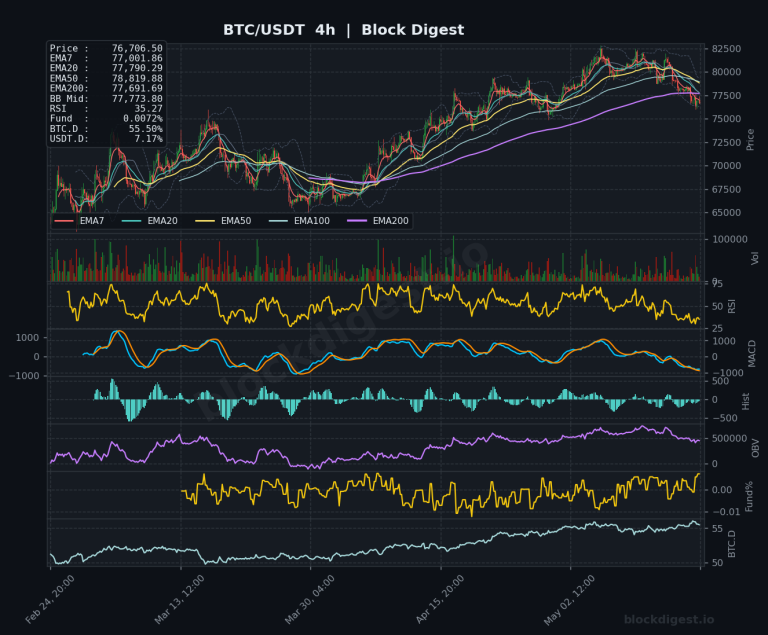
Bitcoin is trading at $78,944.80, demonstrating renewed bullish momentum after establishing a strong uptrend structure across multiple timeframes. The price is currently positioned above all major exponential moving averages on the 1-hour and 4-hour charts, with the EMA7 ($77,754.40) providing immediate support on the daily timeframe. On the 1-hour chart, BTC is trading near the upper Bollinger Band at $78,353.89, suggesting short-term extended conditions, while the daily timeframe shows price consolidating just above the middle Band at $75,261.08. The dominant trend remains constructive, with higher highs being established and the EMA structure sequentially aligned in bullish order across shorter timeframes.
Multi-Timeframe Confluence
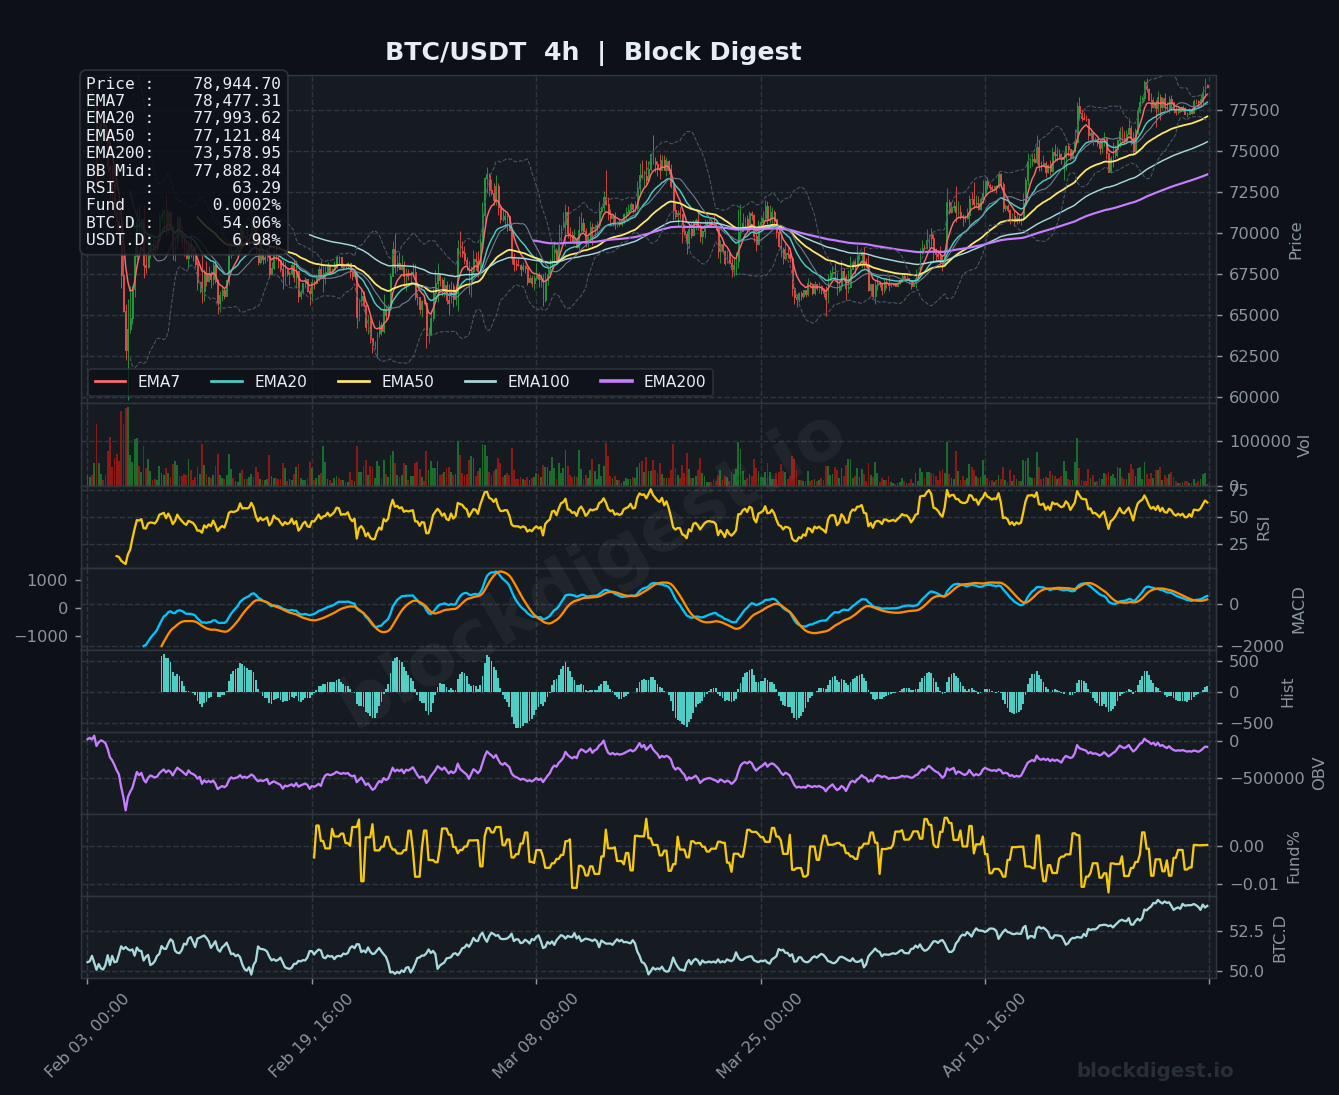
The alignment across timeframes reveals strong bullish confluence, with all three charts showing price trading above their respective EMA7, EMA20, and EMA50 levels. The 1-hour chart displays the most aggressive bullish structure with tight EMA clustering between $78,888.96 (EMA7) and $78,080.21 (EMA50), indicating strong short-term momentum. The 4-hour timeframe confirms this structure with price at $78,944.70, comfortably above the EMA50 at $77,121.84, providing a critical support zone around the $77,000-$77,500 range. The daily chart, while showing a more extended recovery from lower levels, has price attempting to reclaim the EMA20 at $75,435.63 as support, with the EMA50 at $73,376.87 representing a deeper structural support level. This multi-timeframe alignment suggests any pullbacks to the $77,000-$78,000 zone could present favorable risk-reward entry opportunities for continuation traders.
Key Levels to Watch
Resistance:
- $79,000-$79,500: Psychological round number resistance and recent local highs on the 1-hour chart, representing the immediate challenge for bulls to overcome for continuation
- $80,000: Major psychological level and previous consolidation zone visible on the 4-hour timeframe that served as resistance during earlier price action
- $82,000-$82,610: The EMA200 level on the daily chart at $82,610.71 represents significant longer-term resistance, aligned with previous distribution zones from the broader downtrend
Support:
- $78,000-$78,080: The EMA50 on the 1-hour chart and short-term consolidation base, serving as the first line of defense for the current rally structure
- $77,121-$77,993: Confluence zone combining the 4-hour EMA50 ($77,121.84) and EMA20 ($77,993.62), representing critical short-to-medium term support
- $75,261-$75,435: Daily Bollinger Band middle ($75,261.08) and daily EMA20 ($75,435.63), marking the structural support zone that would need to hold to maintain the bullish trend integrity
Momentum & On-Chain Signals
Momentum indicators present a mixed but generally constructive picture. The RSI on the 1-hour timeframe reads 66.27, approaching overbought territory but not yet extended, while the 4-hour RSI at 63.29 and daily RSI at 65.94 suggest sustained buying pressure without extreme conditions. The MACD on both the 1-hour and 4-hour charts shows bullish crossovers with expanding positive histograms, confirming momentum acceleration in the short to medium term, though the daily MACD appears to be transitioning from bearish to neutral territory, suggesting the longer-term trend shift is still developing. On-Balance Volume (OBV) displays steady accumulation across all timeframes, particularly notable on the daily chart where OBV is trending higher alongside price, confirming genuine buying interest rather than low-conviction rallies. Funding rates at 0.0002% indicate relatively neutral perpetual futures sentiment, suggesting the rally is not yet overleveraged and has room for expansion before contrarian concerns emerge.
BTC Dominance & Market Sentiment
Bitcoin Dominance stands at 54.06%, showing gradual improvement from lower levels visible on the daily chart, which typically indicates capital flowing back into BTC relative to altcoins during risk-off or early recovery phases. USDT Dominance reads 6.98%, remaining relatively stable, which suggests neither aggressive risk-on behavior (which would drive USDT.D lower) nor fear-driven flight to stablecoins (which would push it higher). This combination points to a measured, constructive environment where Bitcoin can continue building on its recovery without excessive speculative froth that often precedes corrections.
Risk Scenarios
Bullish case: A sustained break and 4-hour close above $79,500 with supportive volume would confirm continuation toward the $80,000-$82,000 resistance zone, potentially targeting the daily EMA200 at $82,610. This scenario would be reinforced if the 4-hour EMA structure continues compressing upward and the daily chart establishes the EMA20 as firm support, with price targets extending toward $84,000-$85,000 in a multi-day scenario.
Bearish case: Rejection from current levels followed by a breakdown below the $77,000 support confluence (4-hour EMA50) would signal short-term momentum exhaustion and could trigger a retest of the $75,000-$75,400 daily support zone. Further weakness below $75,000 would compromise the bullish structure and potentially lead to a deeper correction toward $73,000-$73,400 (daily EMA50), with more severe downside risk emerging only below $70,000.
Outlook
Bitcoin maintains a constructive short-to-medium term outlook with well-defined support structures and clear resistance targets ahead. The immediate focus is whether bulls can secure a foothold above $79,000 in the next 24-48 hours, as this would open the path toward testing the psychologically significant $80,000 level. Key triggers to monitor include any sustained move below $77,500 on the 4-hour timeframe, which would warrant defensive positioning, and conversely, a breakout above $79,500 with strong volume would provide confirmation for continuation strategies targeting $82,000+. The current setup favors a cautiously bullish stance with tight risk management, as the multi-timeframe EMA alignment and momentum indicators support further upside, provided the $77,000-$78,000 support zone remains intact on any near-term pullbacks.
Charts