BTC Daily Analysis — April 30, 2026
BTC Daily Analysis – April 30, 2026
Market Overview
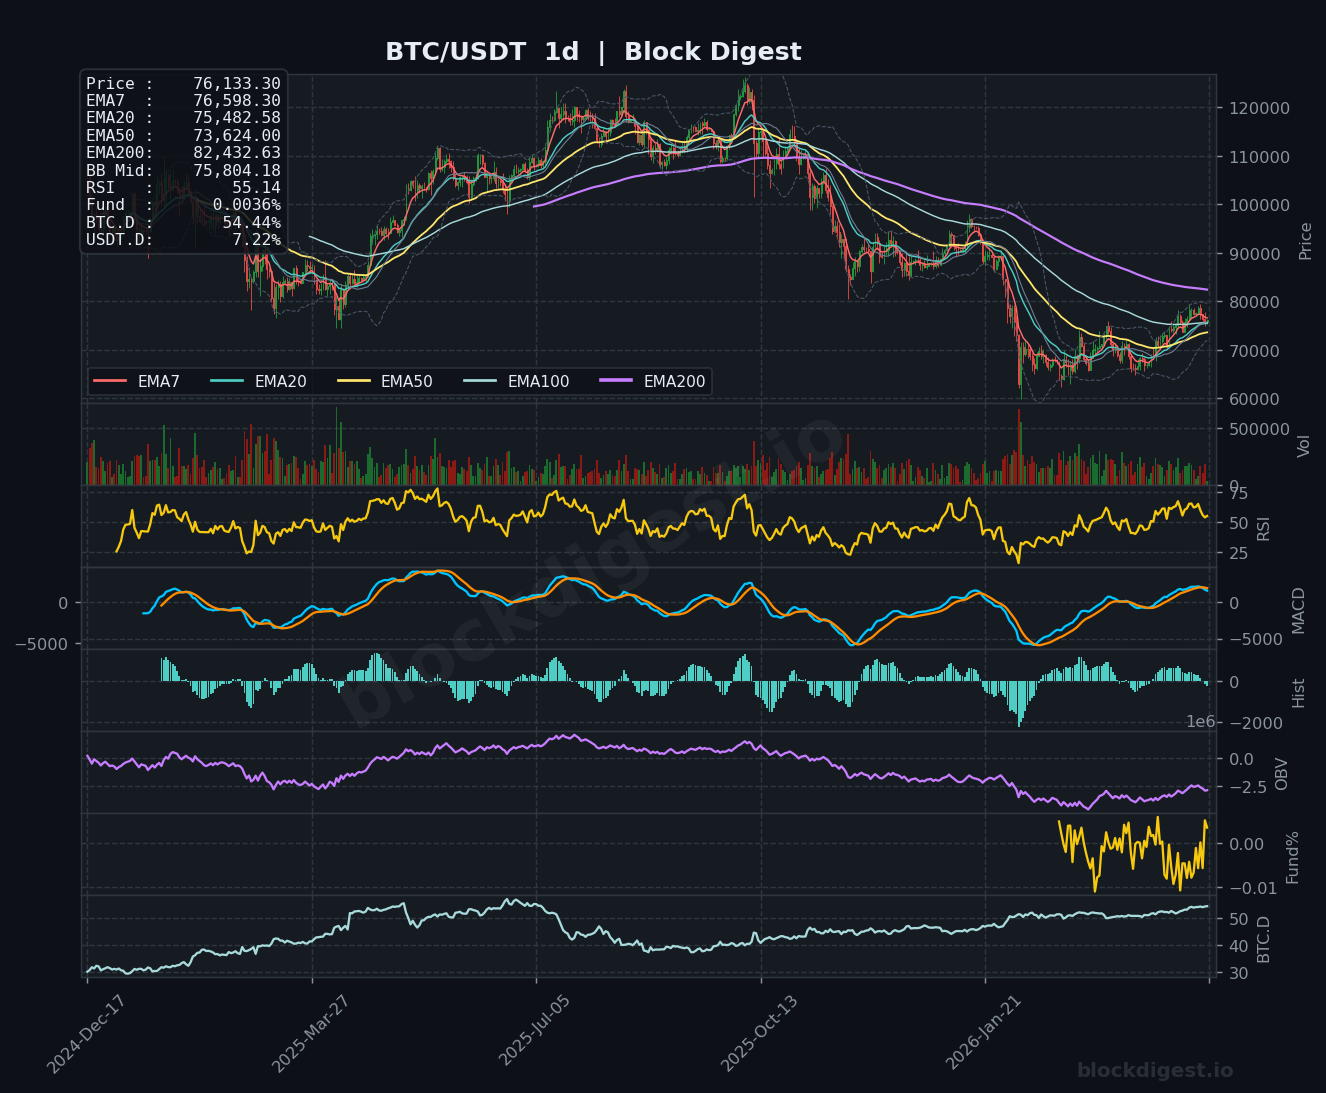
Bitcoin is trading at $76,133.30, positioned precariously below its short-term moving averages while attempting to stabilize after recent weakness. The daily timeframe reveals price trading beneath the EMA50 ($73,624) but above the critical EMA200 ($82,432.63), indicating a corrective phase within a broader trend that has lost upward momentum. Price is currently compressed within the middle Bollinger Band zone at $75,804, suggesting consolidation after the decline from higher levels. The daily trend structure shows BTC testing support clusters while shorter timeframes exhibit indecision, creating a pivotal moment for directional resolution.
Multi-Timeframe Confluence
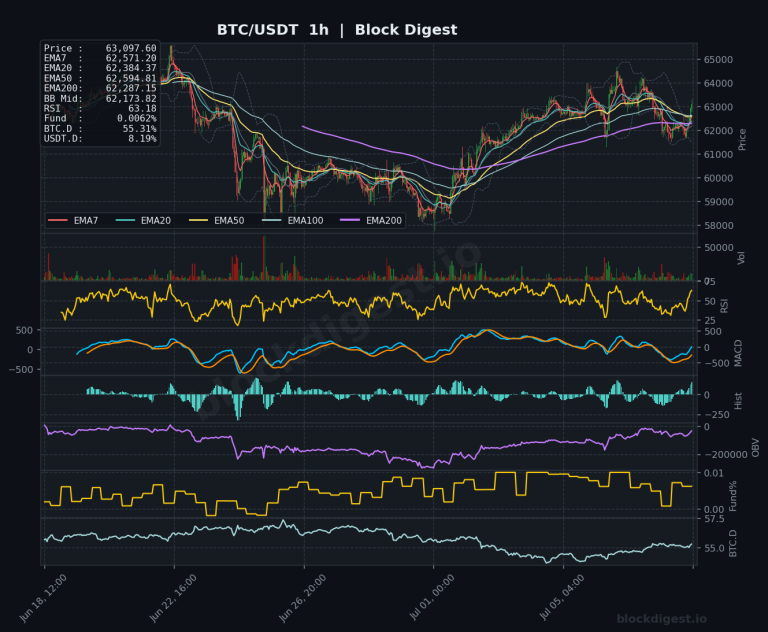
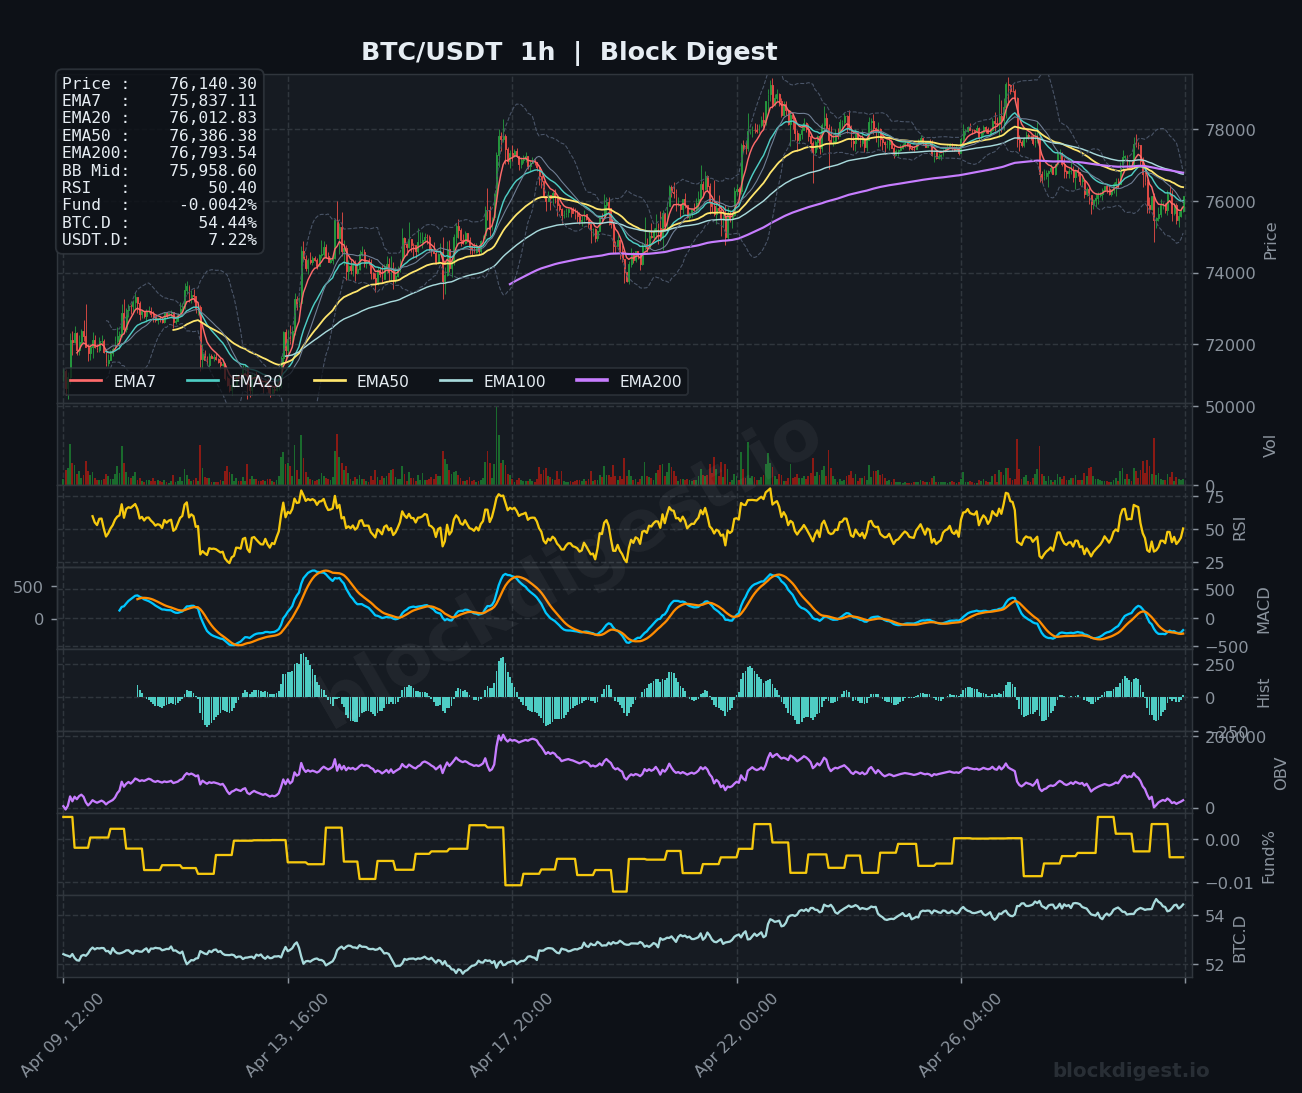
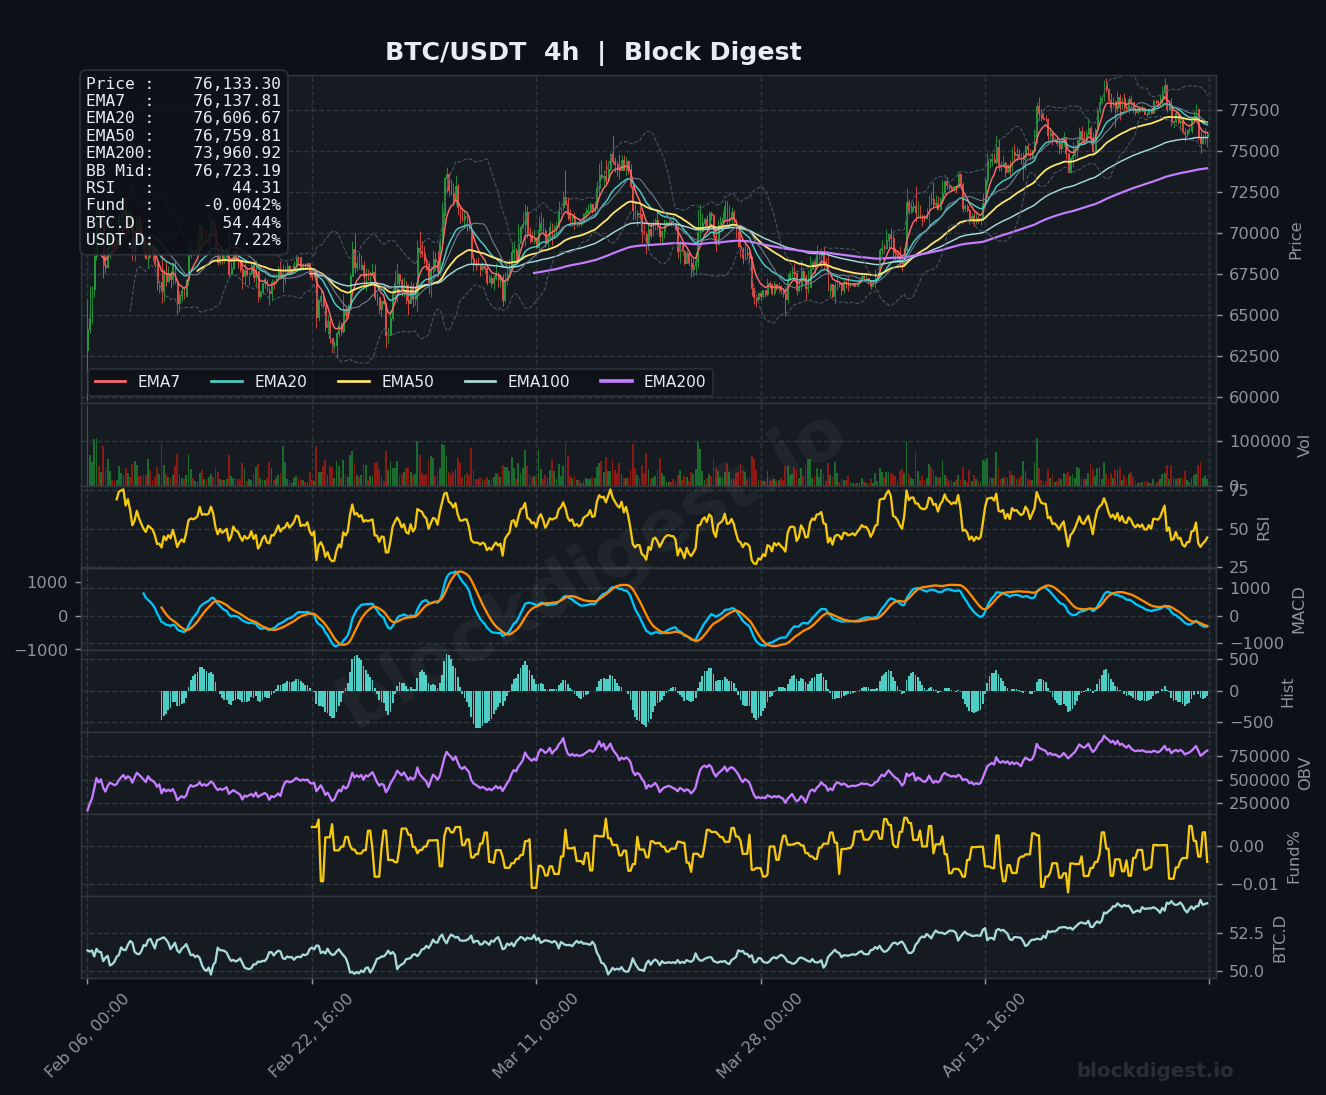
Multi-timeframe analysis reveals growing tension between short-term bearish pressure and potential stabilization. The 1-hour chart shows price hovering just above the EMA7 ($75,837.11) with tightly compressed EMAs, signaling indecision and reduced volatility ahead of a potential breakout. The 4-hour timeframe displays price trading below the EMA50 ($76,759.81) but finding support near the EMA20 ($76,606.67), indicating short-term resistance overhead. Meanwhile, the daily chart confirms the corrective structure with price below the EMA20 ($75,482.38) yet holding above the EMA50, establishing the $73,600-$76,800 range as the critical battleground zone where multiple timeframe supports and resistances converge.
Key Levels to Watch
Resistance:
- $76,793 – EMA200 on 1h and BB Mid on 4h; immediate resistance cluster where short-term moving averages converge, rejection here would confirm continued weakness
- $77,500-$78,000 – Previous consolidation zone visible on 4h chart; reclaiming this area would signal bullish recovery and potential trend reversal
- $82,432 – EMA200 on daily timeframe; major resistance that defines the longer-term trend, breakthrough would confirm structural shift to bullish
Support:
- $75,800-$76,012 – EMA20 cluster on 1h combined with BB Mid; immediate support zone that must hold to prevent accelerated downside
- $73,960 – EMA200 on 4h timeframe; critical support that aligns with the daily EMA50 area, forming a major demand zone
- $73,600-$73,624 – Daily EMA50 and psychological level; breakdown below this would open path to $70,000 and signal deeper correction
Momentum & On-Chain Signals
Momentum indicators paint a cautious picture with mixed signals across timeframes. The RSI on the 1-hour stands at 50.40, indicating neutral momentum with slight bullish lean, while the 4-hour RSI at 44.31 shows waning momentum below midpoint, and the daily RSI at 55.14 suggests room for movement in either direction without extreme conditions. The MACD across all timeframes shows bearish histograms with both lines trading in negative territory on 1h and 4h charts, though the daily MACD shows signs of potential bullish convergence near the zero line. OBV trends remain relatively stable without dramatic distribution, suggesting holders are not panic selling despite the pullback. The funding rate at -0.0042% (1h) and -0.0047% (4h) indicates slight negative bias with shorts paying longs, which often precedes short squeezes if support holds, while the elevated rate of 0.0036% on daily suggests recent position adjustment.
BTC Dominance & Market Sentiment
BTC dominance stands at 54.44%, reflecting continued Bitcoin strength relative to the broader altcoin market, suggesting risk-off positioning within crypto markets where capital concentrates in the flagship asset during uncertainty. USDT dominance at 7.22% remains relatively elevated, indicating substantial stablecoin positioning on the sidelines awaiting clearer directional signals. This combination suggests market participants are defensively positioned, with capital parked in both Bitcoin and stablecoins rather than flowing into higher-risk altcoins, a typically cautious stance that often precedes either capitulation or aggressive re-entry once a clear trend emerges.
Risk Scenarios
Bullish case: A decisive reclaim of $76,800 with volume confirmation and 4-hour close above the EMA50 would trigger short covering and activate buying pressure toward $78,000, with momentum potentially extending to test $80,000. Sustained hold above the short-term EMA cluster combined with RSI breaking above 60 on the 4-hour timeframe would validate bullish continuation with targets at previous resistance zones.
Bearish case: Failure to hold the $75,800 support zone with a 4-hour close below EMA20 would likely accelerate selling toward the $73,960-$73,624 critical support cluster. A breakdown below the daily EMA50 at $73,624 with increasing volume would signal deeper correction with targets at $70,000 and potentially $67,500, invalidating near-term bullish structure.
Outlook
Bitcoin remains range-bound in a critical decision zone, with the next 24-48 hours likely to determine near-term direction. The confluence of support around $75,800-$76,000 is holding for now, but momentum indicators suggest weakening buying pressure that requires confirmation through either a decisive breakout above $76,800 or breakdown below $75,800. Traders should watch for volume expansion and RSI divergences as key triggers; a 4-hour close above $77,000 would shift bias bullish, while failure at $75,800 would confirm continued correction. The overall setup favors patience, waiting for clearer directional confirmation before committing to aggressive positions, as the current compression suggests an imminent volatility expansion that will define the next significant move.
Disclaimer: This analysis is for informational purposes only and does not constitute financial advice. Cryptocurrency markets are highly volatile and unpredictable. All trading decisions should be made based on your own research and risk tolerance. Block Digest is not responsible for any financial losses incurred as a result of acting on this content.