
daily analysis
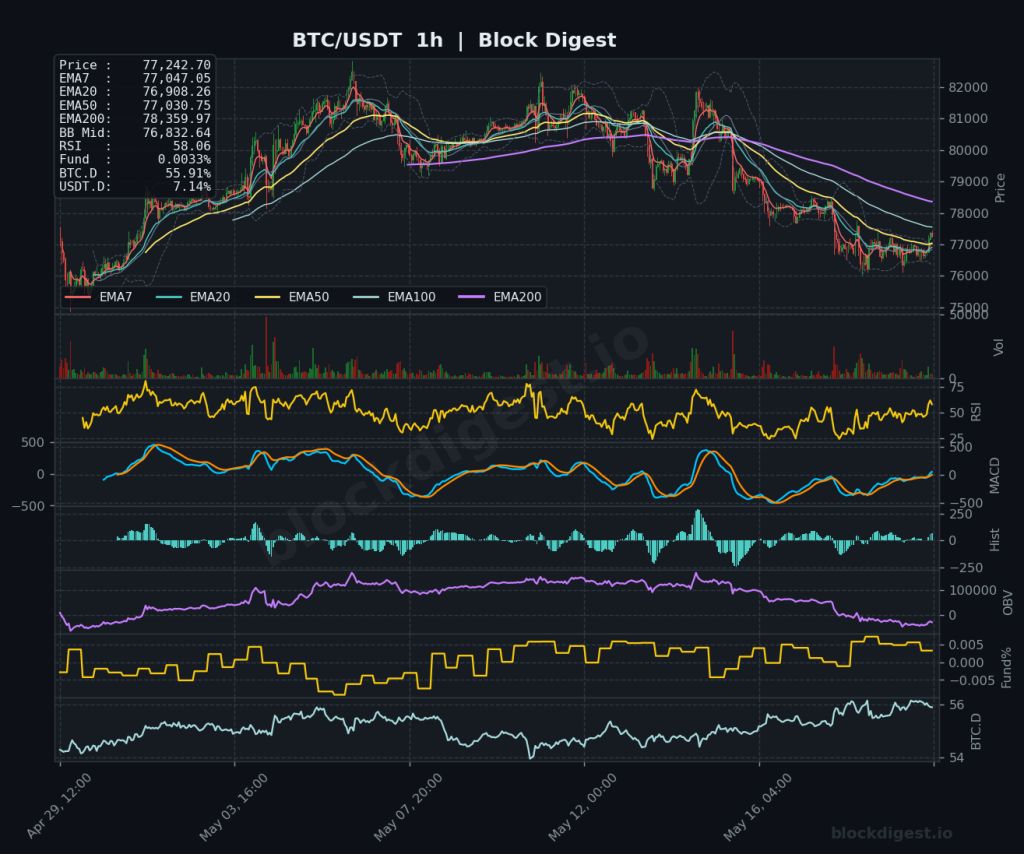
BTC Daily Analysis — May 20, 2026
Market Overview Bitcoin is trading at $77,240, exhibiting signs of consolidation after a significant retracement from recent highs above $120,000. Price is currently trading below all major EMAs on the 1-hour timeframe, with the EMA7 at $77,047 and EMA200 at $78,360 providing immediate overhead resistance. The Bollinger Band middle line sits at $76,833, with price...

ETH Daily Analysis — May 19, 2026
Market Overview Ethereum is currently trading at $2,141.29, positioned below all major exponential moving averages across timeframes, signaling persistent bearish pressure. On the 1-hour chart, price sits beneath the EMA7 ($2,133.78), EMA20 ($2,129.50), EMA50 ($2,143.55), and EMA200 ($2,215.13), while the Bollinger Band midline at $2,123.91 provides immediate support. The daily timeframe confirms a broader downtrend...
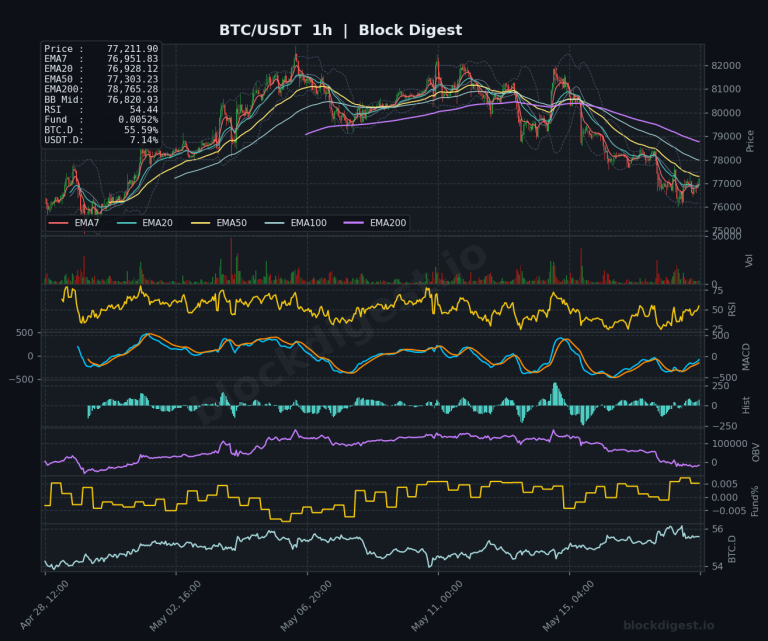
BTC Daily Analysis — May 19, 2026
Market Overview Bitcoin is trading at $77,211.90, consolidating within a narrow range after a significant decline from its recent all-time high above $123,000. The daily timeframe reveals price trading below all key EMAs (EMA7: $78,224, EMA20: $78,607, EMA50: $76,717, EMA200: $81,890), indicating a bearish market structure. Price is currently testing the lower Bollinger Band on...

ETH Daily Analysis — May 18, 2026
ETH Daily Analysis – May 18, 2026 Market Overview Ethereum is trading at $2,118.97, currently positioned below all major EMAs across timeframes, signaling sustained bearish pressure. On the daily chart, price remains beneath the descending EMA200 at $2,562.27, with the entire EMA structure bearishly stacked (shorter EMAs below longer ones). The Bollinger Band middle line...

BTC Daily Analysis — May 18, 2026
BTC Daily Analysis – May 18, 2026 Market Overview Bitcoin is currently trading at $76,991.10, experiencing continued pressure beneath all major exponential moving averages across the daily timeframe, signaling persistent bearish structure. Price remains trapped below the critical EMA50 at $76,698.35 and well beneath the EMA200 at $81,937.21, with the Bollinger Band middle line at...

ETH Daily Analysis — May 17, 2026
ETH Daily Analysis – May 17, 2026 Market Overview Ethereum is trading at $2,184.85, positioned below all major exponential moving averages across timeframes, signaling persistent bearish pressure. On the daily chart, price remains beneath the EMA50 ($2,264.72), EMA100 ($2,264.72), and EMA200 ($2,566.95), with all shorter-term EMAs trending downward and converging toward the current price level....
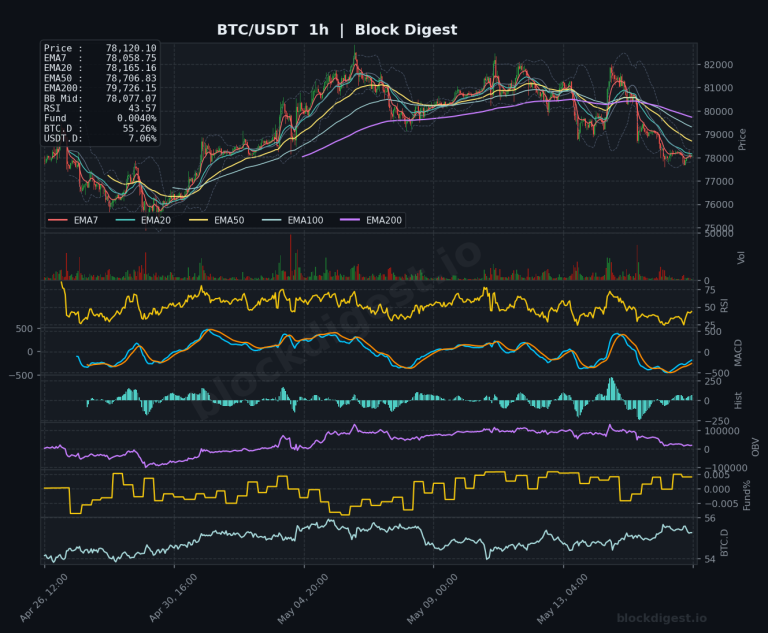
BTC Daily Analysis — May 17, 2026
BTC Daily Analysis – May 17, 2026 Market Overview Bitcoin is currently trading at $78,115.50, caught in a critical consolidation phase after its steep decline from the $123,000 all-time high. Price action shows BTC trading below the daily EMA7 ($79,271.14) and EMA20 ($79,009.21) but finding support near the EMA50 at $76,713.26, indicating short-term bearish pressure...

ETH Daily Analysis — May 16, 2026
ETH Daily Analysis – May 16, 2026 Market Overview Ethereum is trading at $2,193.80, experiencing significant bearish pressure as price has broken below all major exponential moving averages across multiple timeframes. On the daily chart, ETH is trading well below the EMA7 ($2,258.04), EMA20 ($2,286.91), EMA50 ($2,268.54), and critically beneath the EMA200 ($2,569.89), confirming a...
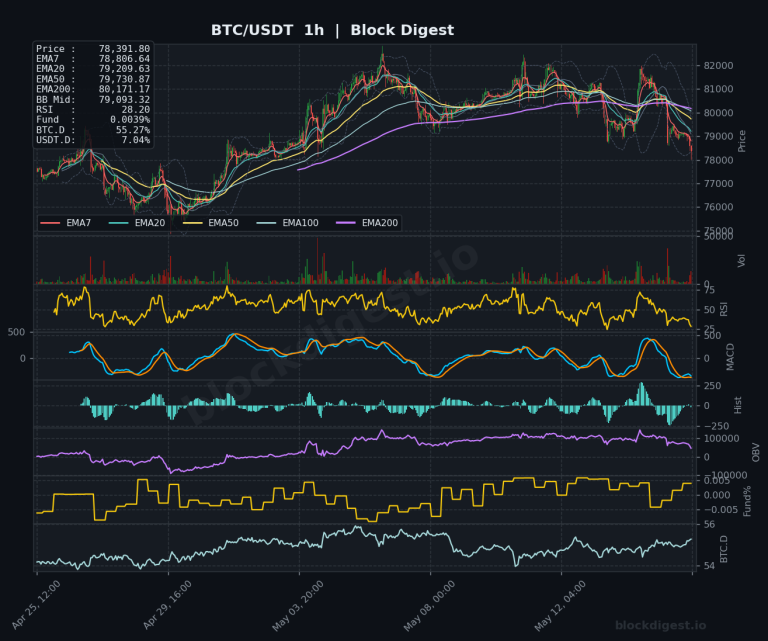
BTC Daily Analysis — May 16, 2026
BTC Daily Analysis – May 16, 2026 Market Overview Bitcoin is trading at $78,369.20, positioned precariously below key short-term moving averages while attempting to stabilize after recent downside pressure. The current price sits beneath the EMA7 ($79,722.60), EMA20 ($79,128.52), and critically below the EMA50 ($76,666.42) on the daily timeframe, though it remains supported by the...

ETH Daily Analysis — May 15, 2026
ETH Daily Analysis – May 15, 2026 Market Overview Ethereum is trading at $2,266.21, positioned precariously below all major EMAs across multiple timeframes, signaling sustained bearish pressure. On the daily chart, price remains trapped beneath the EMA50 ($2,273.26) and considerably below the EMA200 ($2,573.44), confirming a broader downtrend that has persisted since the rejection from...
BTC Daily Analysis — May 15, 2026
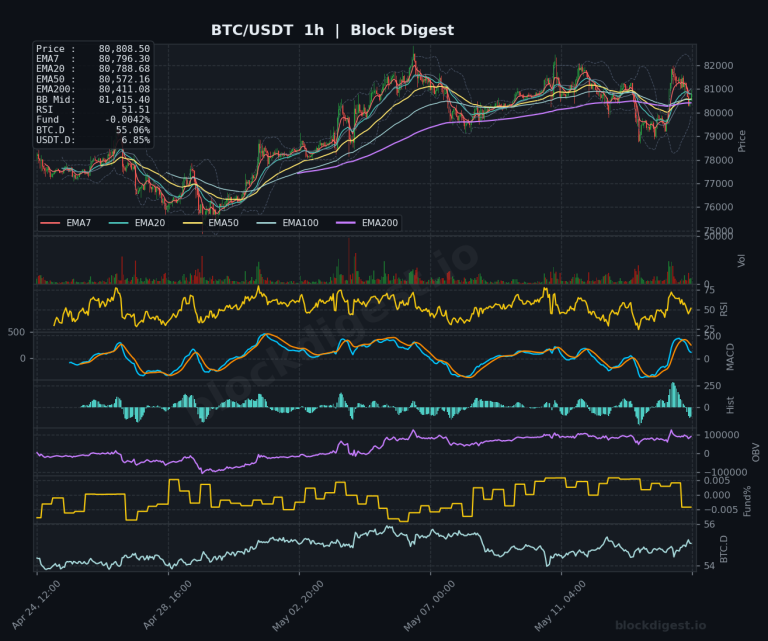
BTC Daily Analysis – May 15, 2026 Market Overview Bitcoin is currently trading at $80,808, positioned above its short-term exponential moving averages but notably below the key EMA200 at $82,065 on the daily timeframe. The price structure shows BTC consolidating within a tight range between $79,400 and $81,015 (Bollinger Band midpoint), suggesting indecision following the...
ETH Daily Analysis — May 14, 2026
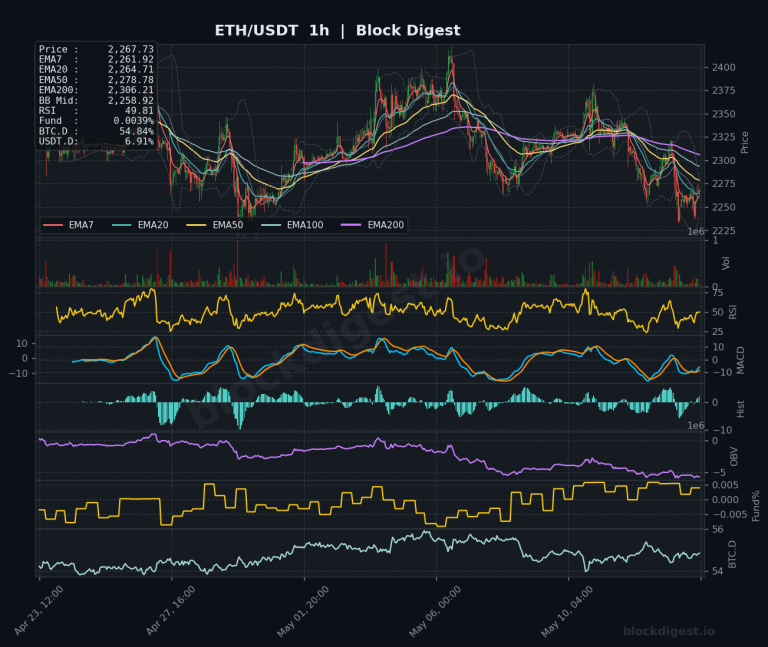
ETH Daily Analysis – May 14, 2026 Market Overview Ethereum is currently trading at $2,267.73, positioned below all major exponential moving averages on the daily timeframe, signaling persistent bearish pressure. Price action remains compressed below the EMA200 at $2,576.23, with the daily chart showing a clear downtrend structure as shorter-term EMAs (7, 20, 50) have...