
BTC Daily Analysis – May 16, 2026
Market Overview
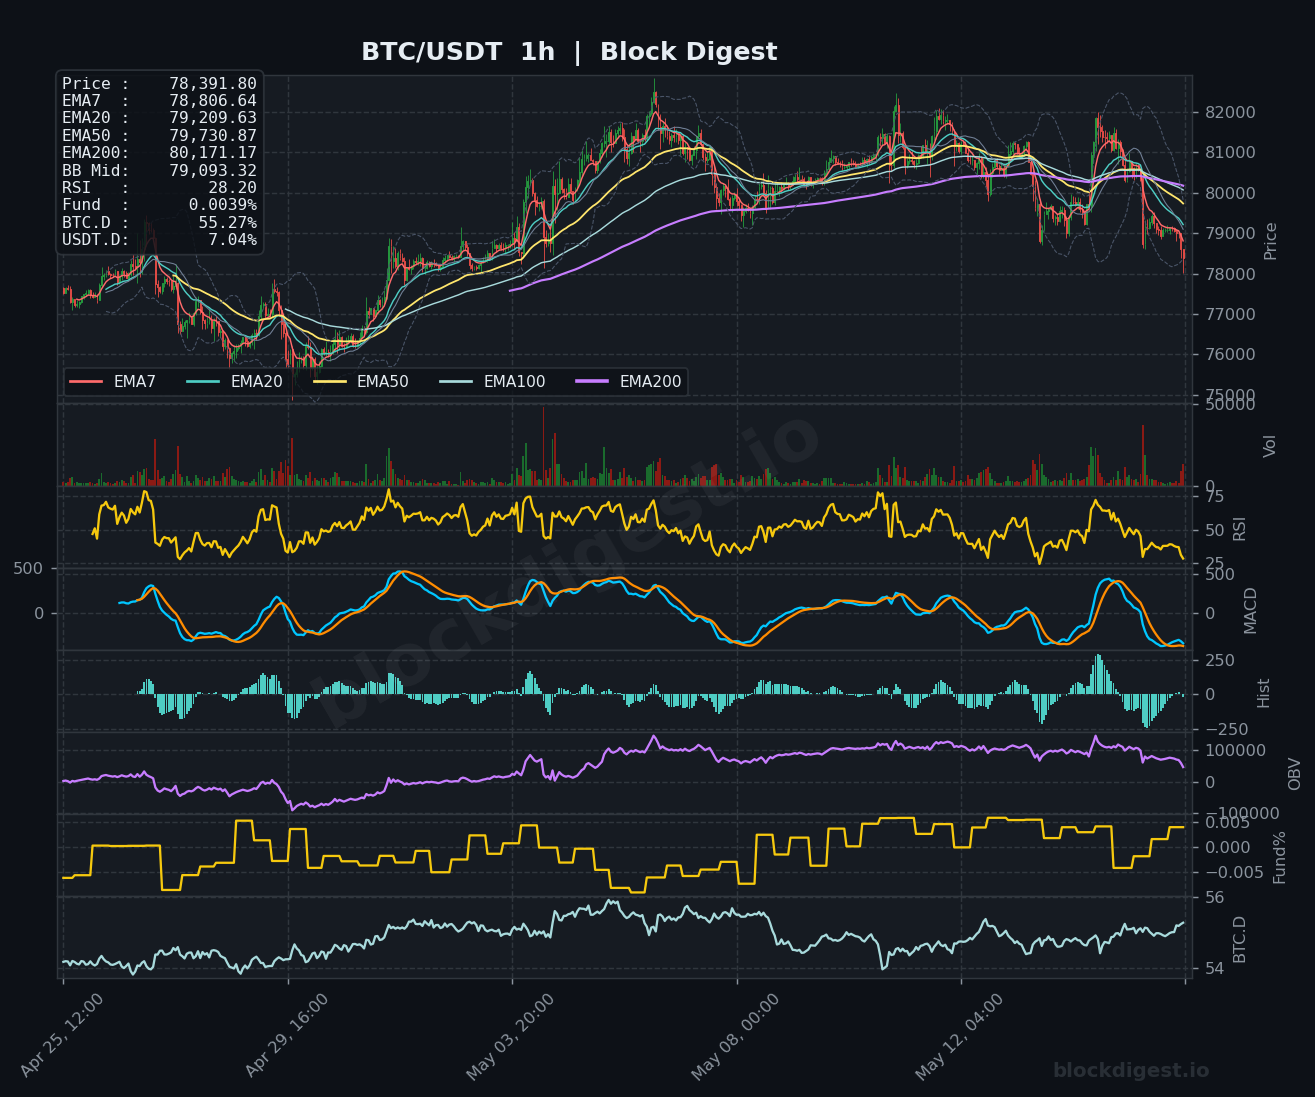
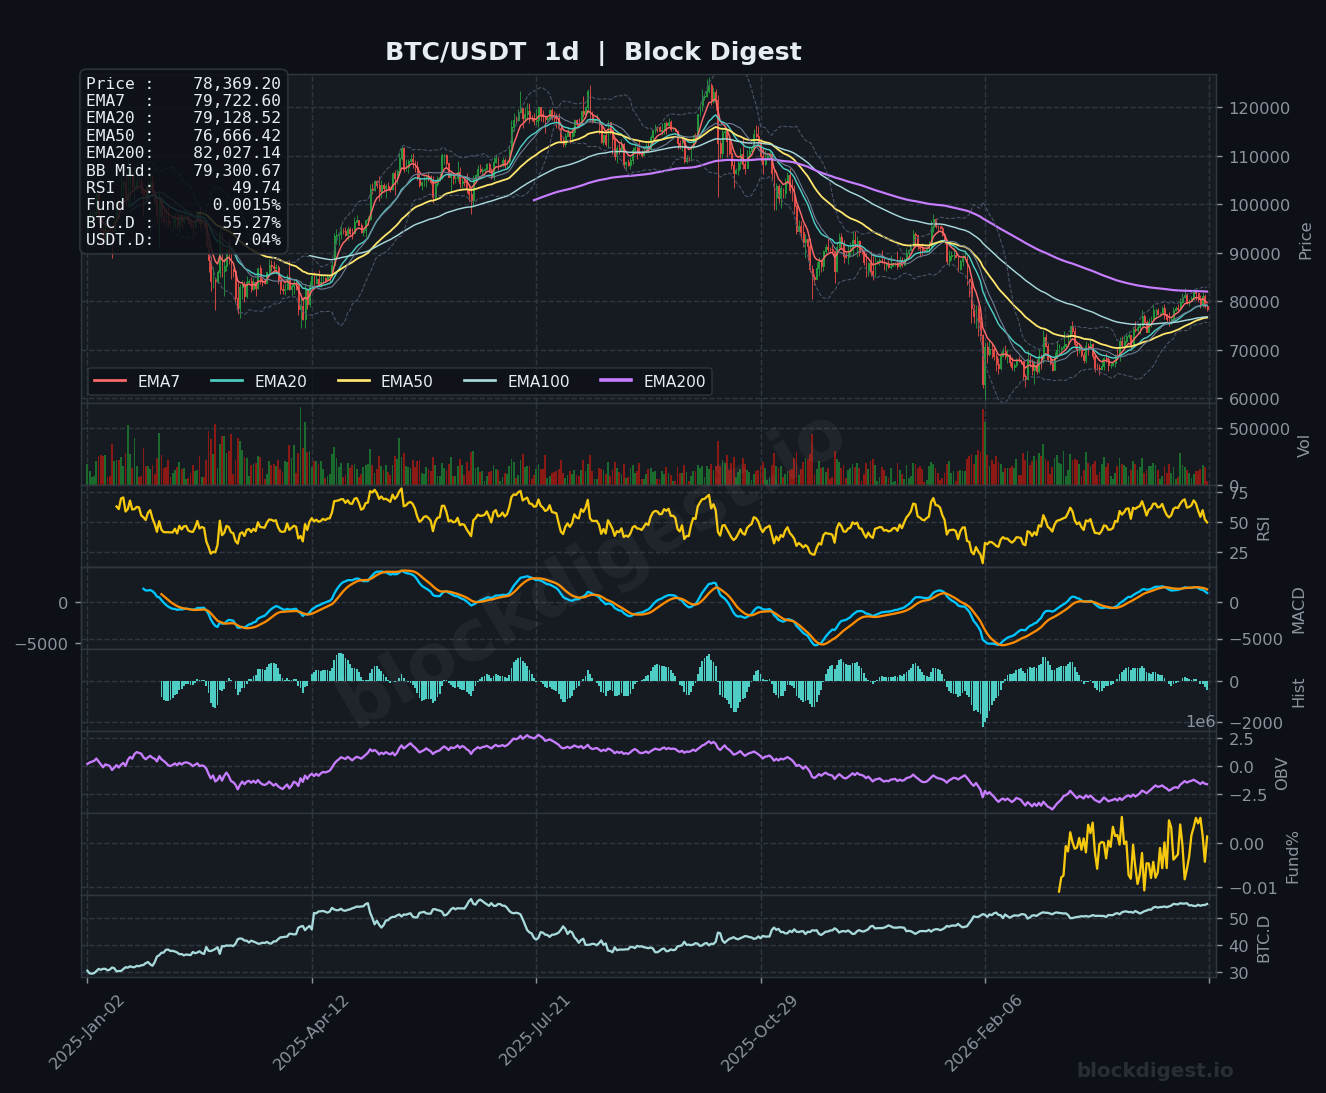
Bitcoin is trading at $78,369.20, positioned precariously below key short-term moving averages while attempting to stabilize after recent downside pressure. The current price sits beneath the EMA7 ($79,722.60), EMA20 ($79,128.52), and critically below the EMA50 ($76,666.42) on the daily timeframe, though it remains supported by the rising EMA200 at $82,027.14. The Bollinger Band midpoint at $79,300.67 represents immediate resistance, while price action continues to compress near the lower band, suggesting either continuation weakness or potential mean reversion setup. The daily structure remains bearish-leaning with descending EMAs, though the proximity to oversold conditions and key support zones warrants careful attention to potential reversal signals.
Multi-Timeframe Confluence
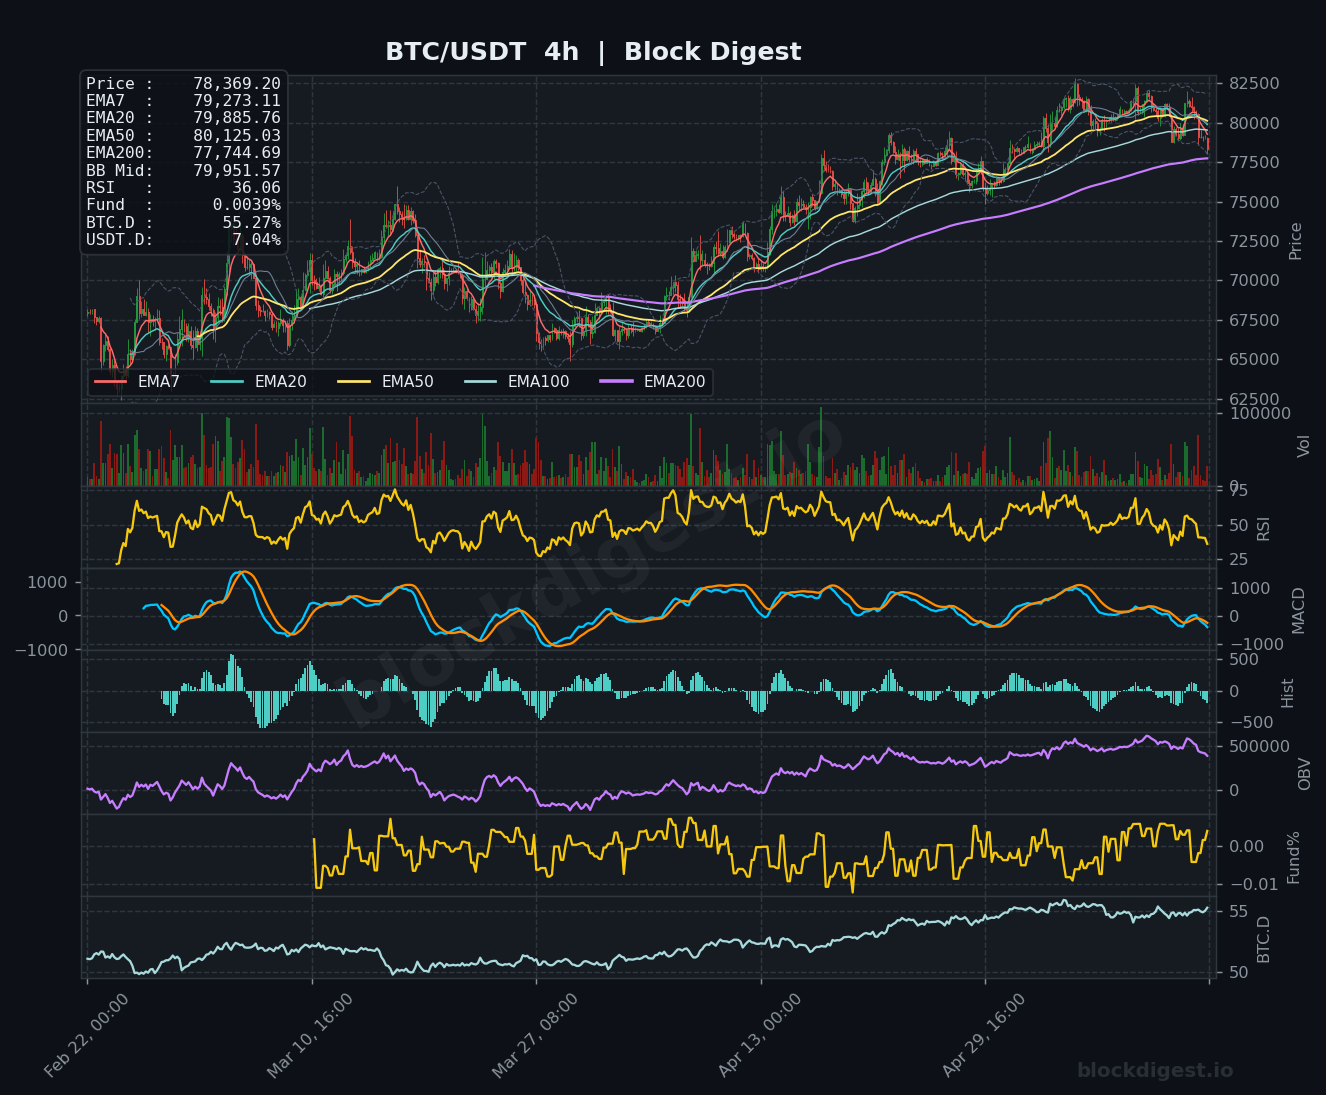
Significant divergence exists across timeframes, creating uncertainty about near-term direction. The 1-hour chart shows price trading below all major EMAs with the EMA7 at $78,806.64 providing immediate overhead resistance, indicating persistent short-term weakness. The 4-hour timeframe mirrors this bearish configuration with price beneath the EMA50 ($80,125.03) and EMA200 ($77,744.69) providing conflicting signals—the former as resistance, the latter as potential support. However, the daily chart reveals a more nuanced picture where the EMA200 at $82,027.14 has maintained its upward trajectory, suggesting the higher timeframe bullish trend remains intact despite recent corrective pressure. The $77,700-$77,750 zone emerges as critical confluent support across the 4h and 1d charts.
Key Levels to Watch
Resistance:
- $79,200-$79,300: Bollinger Band midpoint and EMA20 cluster on the daily chart; reclaiming this zone would signal short-term bullish momentum returning
- $80,100-$80,200: EMA50 on the 4-hour timeframe and psychological round number; breaking above here would confirm strength and potentially trigger short covering
- $82,000-$82,500: EMA200 on the daily chart and previous consolidation zone; sustained move above this level would restore the higher timeframe uptrend structure
Support:
- $77,700-$78,000: 4-hour EMA200 and recent swing lows; this zone has provided multiple bounces and represents the near-term defensive line
- $76,600-$76,900: Daily EMA50 and prior consolidation support; loss of this level would signal deeper corrective phase toward lower targets
- $75,000-$75,500: Psychological support and volume profile gap from previous markup phase; this represents a major demand zone where significant buyers previously emerged
Momentum & On-Chain Signals
RSI readings paint a picture of weakening momentum across all timeframes but approaching oversold territory. The 1-hour RSI at 28.20 indicates extreme short-term oversold conditions, while the 4-hour RSI at 36.86 and daily RSI at 49.74 suggest room for further downside before reaching traditionally oversold levels. MACD on the 4-hour and daily charts shows bearish crosses with expanding negative histograms, confirming downward momentum persistence. However, the 1-hour MACD histogram is flattening, potentially signaling short-term exhaustion. OBV across timeframes shows distribution patterns, though the decline has been orderly rather than panicked, suggesting controlled selling rather than capitulation. The Funding Rate at 0.0039% remains slightly positive, indicating marginal long bias among perpetual traders, though this has decreased from previous elevated levels, reflecting reduced conviction.
BTC Dominance & Market Sentiment
BTC dominance stands at 55.27%, having stabilized near recent highs, which typically indicates defensive positioning within the crypto market as capital flows toward the relative safety of Bitcoin during uncertainty. USDT dominance at 7.04% remains elevated compared to risk-on periods, suggesting continued caution among market participants with stablecoin holdings maintained rather than deployed into speculative positions. This combination—rising BTC.D alongside elevated USDT.D—points to a broader risk-off environment where neither Bitcoin nor altcoins are attracting aggressive capital inflows. For BTC specifically, this implies that any rally would need to overcome not just technical resistance but also a cautious market sentiment backdrop.
Risk Scenarios
Bullish case: A decisive reclaim of the $79,200-$79,300 resistance zone with strong volume would trigger short-covering and attract momentum traders, potentially targeting the $80,200 level and subsequently the daily EMA200 at $82,027. Confirmation would require RSI breaking above 50 on the 4-hour chart and MACD positive crossover, with the 1-hour severely oversold condition providing fuel for a relief rally toward $80,500-$81,000 in an optimistic scenario.
Bearish case: Failure to hold the $77,700-$78,000 support confluence would likely accelerate selling toward the daily EMA50 at $76,666, with potential cascade effects targeting $75,000-$75,500 if that breaks. Deterioration would be confirmed by daily RSI falling below 45, increasing OBV distribution, and 4-hour price establishing below the EMA200, suggesting a deeper corrective phase potentially reaching $73,000-$74,000.
Outlook
Bitcoin faces a critical juncture where short-term oversold conditions conflict with deteriorating momentum on higher timeframes. The immediate 24-48 hours will likely determine whether the current consolidation forms a base for recovery or breakdown continuation. Key triggers include the ability to reclaim and hold above $79,000, which would shift the short-term structure bullish, versus a breakdown below $77,700 that would confirm weakness. The $77,700-$78,000 zone represents the line in the sand—holding it could spark a relief rally toward $80,000-$82,000, while losing it opens the door to testing $75,000-$76,600. Given the oversold 1-hour conditions and confluent support nearby, a tactical bounce appears probable, though conviction for sustained upside remains limited absent broader market catalyst or momentum shift. Traders should monitor volume patterns closely, as any recovery on declining volume would lack conviction and remain vulnerable to reversal.
Disclaimer: This analysis is for informational purposes only and does not constitute financial advice. Cryptocurrency markets are highly volatile and unpredictable. All trading decisions should be made based on your own research and risk tolerance. Block Digest is not responsible for any financial losses incurred as a result of acting on this content.
Stay Ahead of the Market
Follow BlockDigest for crypto market intelligence, research and real-time updates.


