ETH Daily Analysis — May 15, 2026
ETH Daily Analysis – May 15, 2026
Market Overview
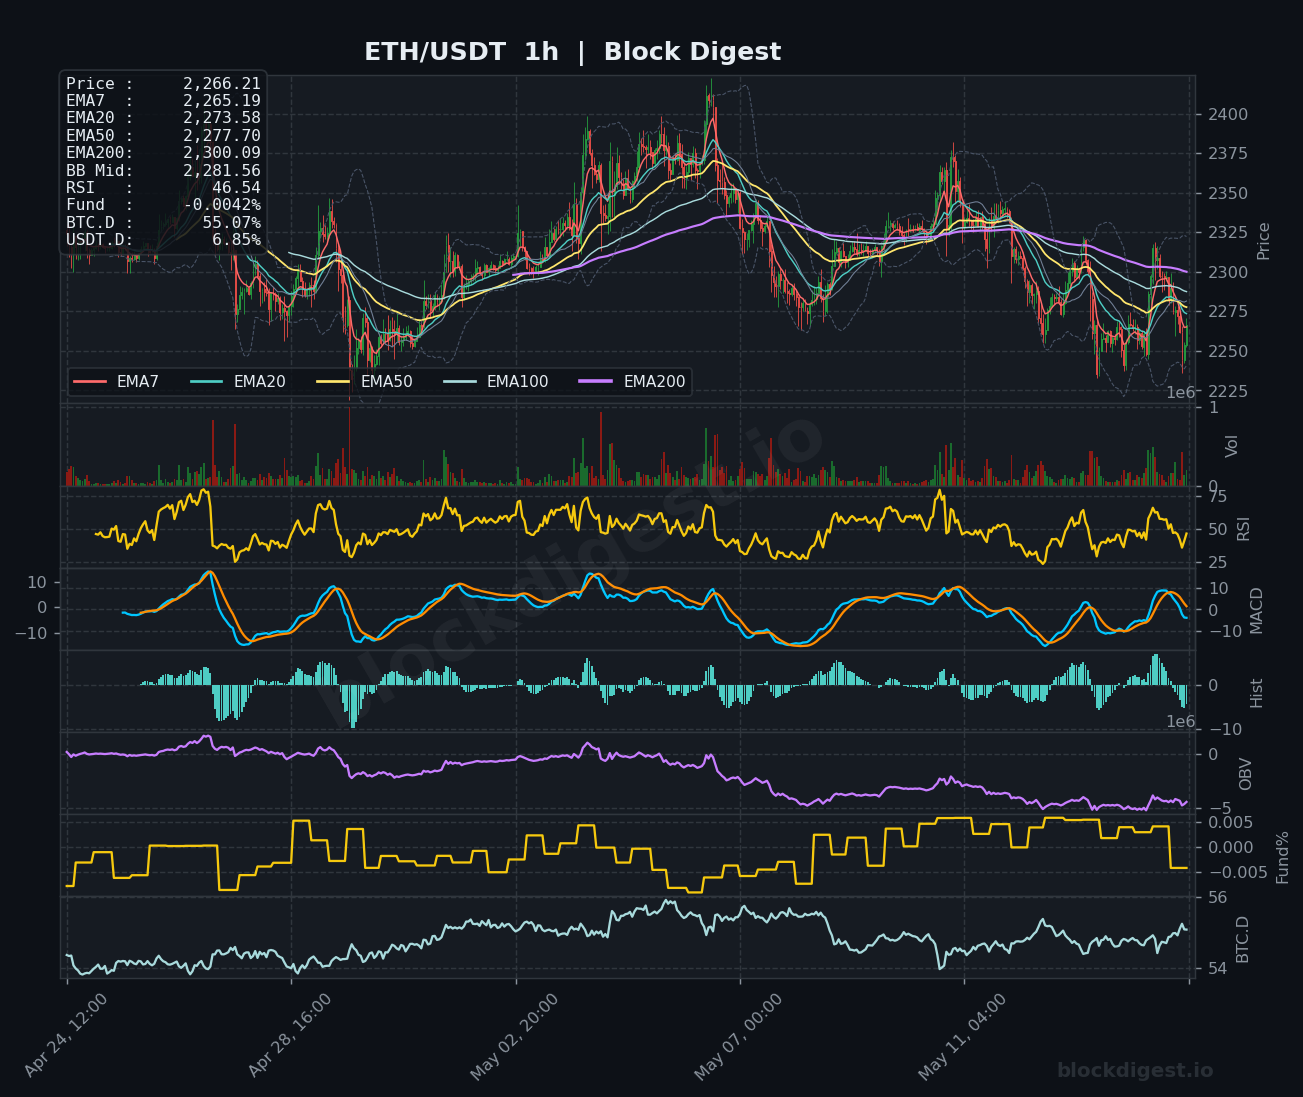
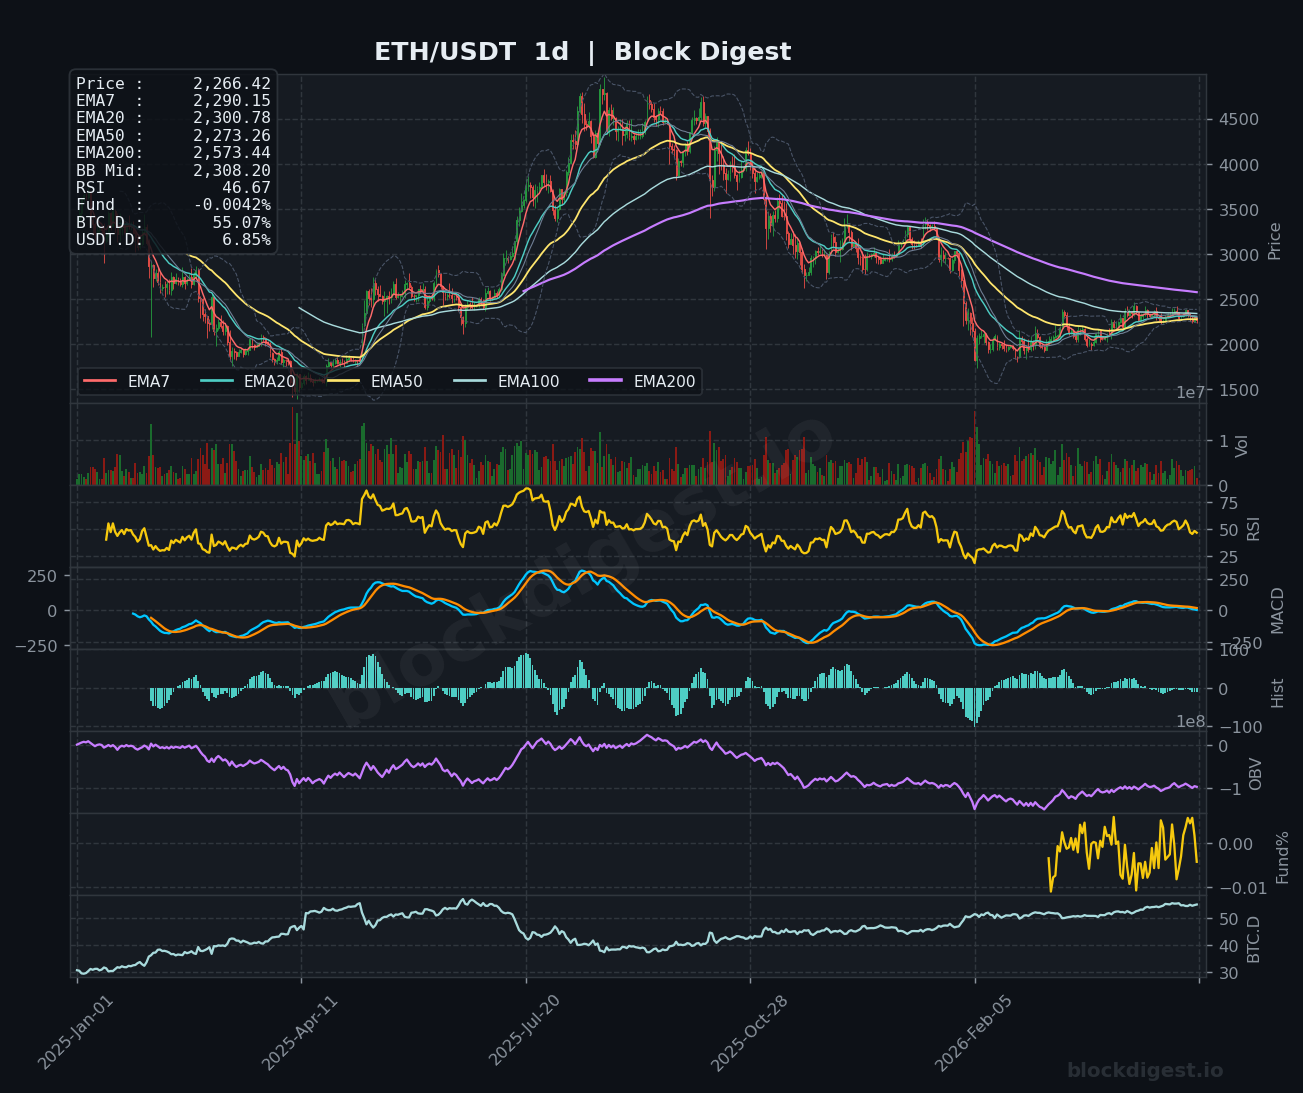
Ethereum is trading at $2,266.21, positioned precariously below all major EMAs across multiple timeframes, signaling sustained bearish pressure. On the daily chart, price remains trapped beneath the EMA50 ($2,273.26) and considerably below the EMA200 ($2,573.44), confirming a broader downtrend that has persisted since the rejection from the $2,400+ zone. The current price action shows ETH consolidating near critical support after a recent breakdown, with the Bollinger Band midline at $2,281.56 on the 1-hour chart acting as immediate overhead resistance. The daily structure reveals a classic lower-high, lower-low pattern, with price trading 54% below its all-time high of $4,946, reflecting the ongoing consolidation phase in crypto markets.
Multi-Timeframe Confluence
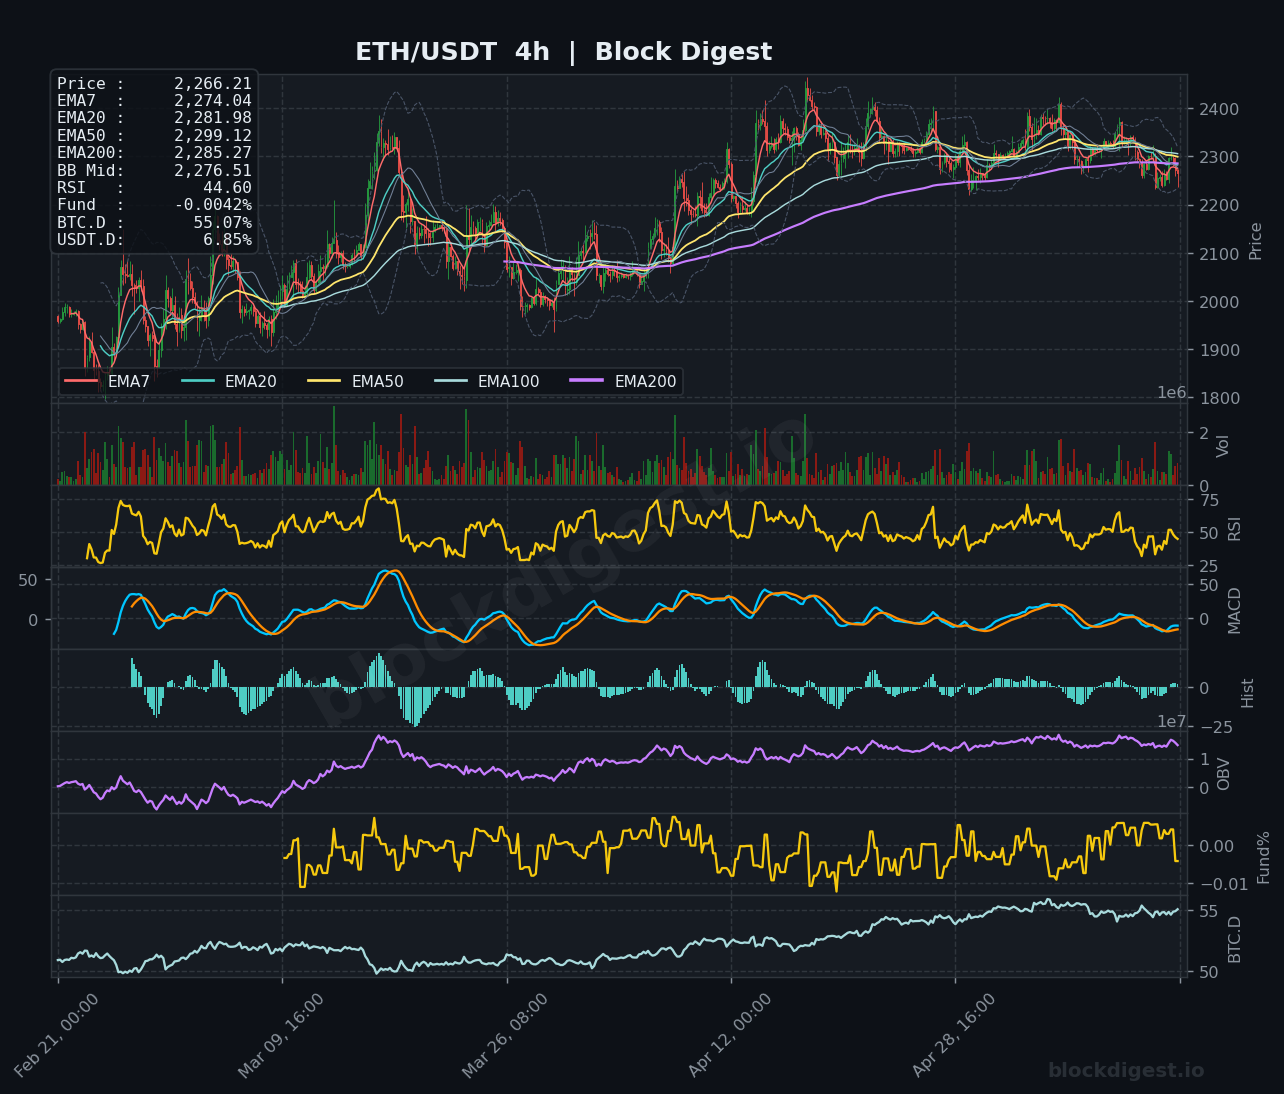
The alignment across timeframes presents a coherent bearish narrative with limited bullish divergence. The 1-hour chart shows price testing below all major EMAs with the EMA7 at $2,265.19 providing minimal support, while the 4-hour timeframe confirms this weakness with price sitting below the EMA50 ($2,299.12) and EMA200 ($2,285.27). Most concerning is the daily chart’s positioning, where ETH trades well beneath the EMA50 and has failed multiple attempts to reclaim the $2,300-2,350 resistance cluster. All three timeframes converge on the $2,250-2,266 zone as critical immediate support, with the $2,300 level representing confluent resistance across the 1h, 4h, and daily EMAs. This multi-timeframe rejection zone suggests any rally attempts will face significant selling pressure unless momentum indicators begin showing genuine strength.
Key Levels to Watch
Resistance:
- $2,300-2,310: Confluence of 4h EMA50 ($2,299.12), 1h EMA200 ($2,300.09), and psychological round number; immediate overhead barrier that must be reclaimed for bullish structure
- $2,350-2,370: Daily EMA20 zone and prior support-turned-resistance; breach here would signal potential trend reversal and attract momentum buyers
- $2,400-2,420: Major historical resistance corresponding to recent highs and the daily EMA7 ($2,290.15) extension; breaking this level would invalidate the bearish thesis entirely
Support:
- $2,250-2,266: Current price cluster and recent swing low; immediate support that has held multiple tests on the 1h chart
- $2,200-2,220: Psychological support and previous consolidation zone visible on the daily chart; loss of this level would accelerate downside momentum
- $2,100-2,150: Critical demand zone from early February visible on the daily timeframe; represents last defense before deeper correction toward $2,000
Momentum & On-Chain Signals
Momentum indicators paint a mixed but slightly oversold picture across timeframes. The 1-hour RSI at 46.54 sits in neutral territory but shows flattening after recent decline, suggesting near-term exhaustion of selling pressure without confirmation of reversal. The 4-hour RSI at 44.60 and daily RSI at 46.67 both hover below the 50 midpoint, confirming bearish control but approaching levels where technical bounces often materialize. MACD across all timeframes shows bearish histograms with lines trading below the zero line, though the 1h and 4h charts display slight histogram compression suggesting potential momentum deceleration. OBV tells a concerning story with declining volume across the recent price drops, indicating distribution rather than accumulation—the daily OBV trend has been steadily declining since mid-March, showing sustained selling pressure. The Funding Rate at -0.0042% (negative) reveals short bias in perpetual markets, though the magnitude suggests shorts may be vulnerable to squeeze on any positive catalyst.
BTC Dominance & Market Sentiment
Bitcoin dominance stands at 55.07% with USDT dominance at 6.85%, painting a nuanced picture of market dynamics. The elevated BTC.D above 55% indicates flight to safety within crypto markets, with capital flowing from altcoins like ETH into Bitcoin—particularly notable given Bitcoin’s recent rally to new all-time highs above $123,000 before the current $81,212 level. This divergence between BTC strength and ETH weakness reflects risk-off behavior among crypto investors. Meanwhile, USDT.D at 6.85% remains relatively elevated, suggesting sustained caution with significant stablecoin reserves on the sidelines. The combination of high BTC.D and elevated USDT.D typically pressures mid-cap altcoins, and ETH’s inability to capitalize on Bitcoin’s recent strength signals underlying fundamental concerns or profit-taking rotation. For ETH to regain momentum, we’d need to see BTC.D decline below 54% while USDT.D compresses below 6.5%, indicating broader risk appetite returning to the altcoin sector.
Risk Scenarios
Bullish case: A reclaim of the $2,300 level with accompanying volume expansion and RSI break above 50 on the 4h chart would signal the first step toward trend reversal, potentially targeting the $2,350-2,370 resistance zone. Confirmation would require sustained trading above the EMA50 on the daily chart ($2,273.26) and a positive MACD crossover on higher timeframes, with extended targets reaching $2,420-2,450 if momentum sustains.
Bearish case: Failure to hold the $2,250 support level, particularly on increased volume and daily close below this zone, would trigger accelerated selling toward $2,200 and potentially $2,150. A breakdown below $2,200 with RSI dropping beneath 40 on the daily chart would confirm continuation of the broader downtrend, exposing the critical $2,100 support and potentially the $2,000 psychological level.
Outlook
The technical setup for Ethereum remains cautiously bearish with price structure, EMA positioning, and momentum all tilted toward the downside, though approaching oversold levels that historically precede relief bounces. The immediate 24-48 hours will be critical: watch for how ETH reacts to the $2,250-2,266 support zone—a decisive break below on volume would accelerate declines, while a strong bounce with RSI divergence could trigger short-term relief toward $2,300. The key catalyst that would alter the current thesis is a definitive daily close above $2,300 with volume confirmation and MACD turning positive on the 4h timeframe. Until ETH can reclaim and hold above the EMA50 cluster ($2,273-2,299 depending on timeframe), traders should approach with caution, as the path of least resistance remains downward despite approaching technically oversold conditions that may produce short-covering rallies.
Disclaimer: This analysis is for informational purposes only and does not constitute financial advice. Cryptocurrency markets are highly volatile and unpredictable. All trading decisions should be made based on your own research and risk tolerance. Block Digest is not responsible for any financial losses incurred as a result of acting on this content.