ETH Daily Analysis — May 14, 2026
ETH Daily Analysis – May 14, 2026
Market Overview
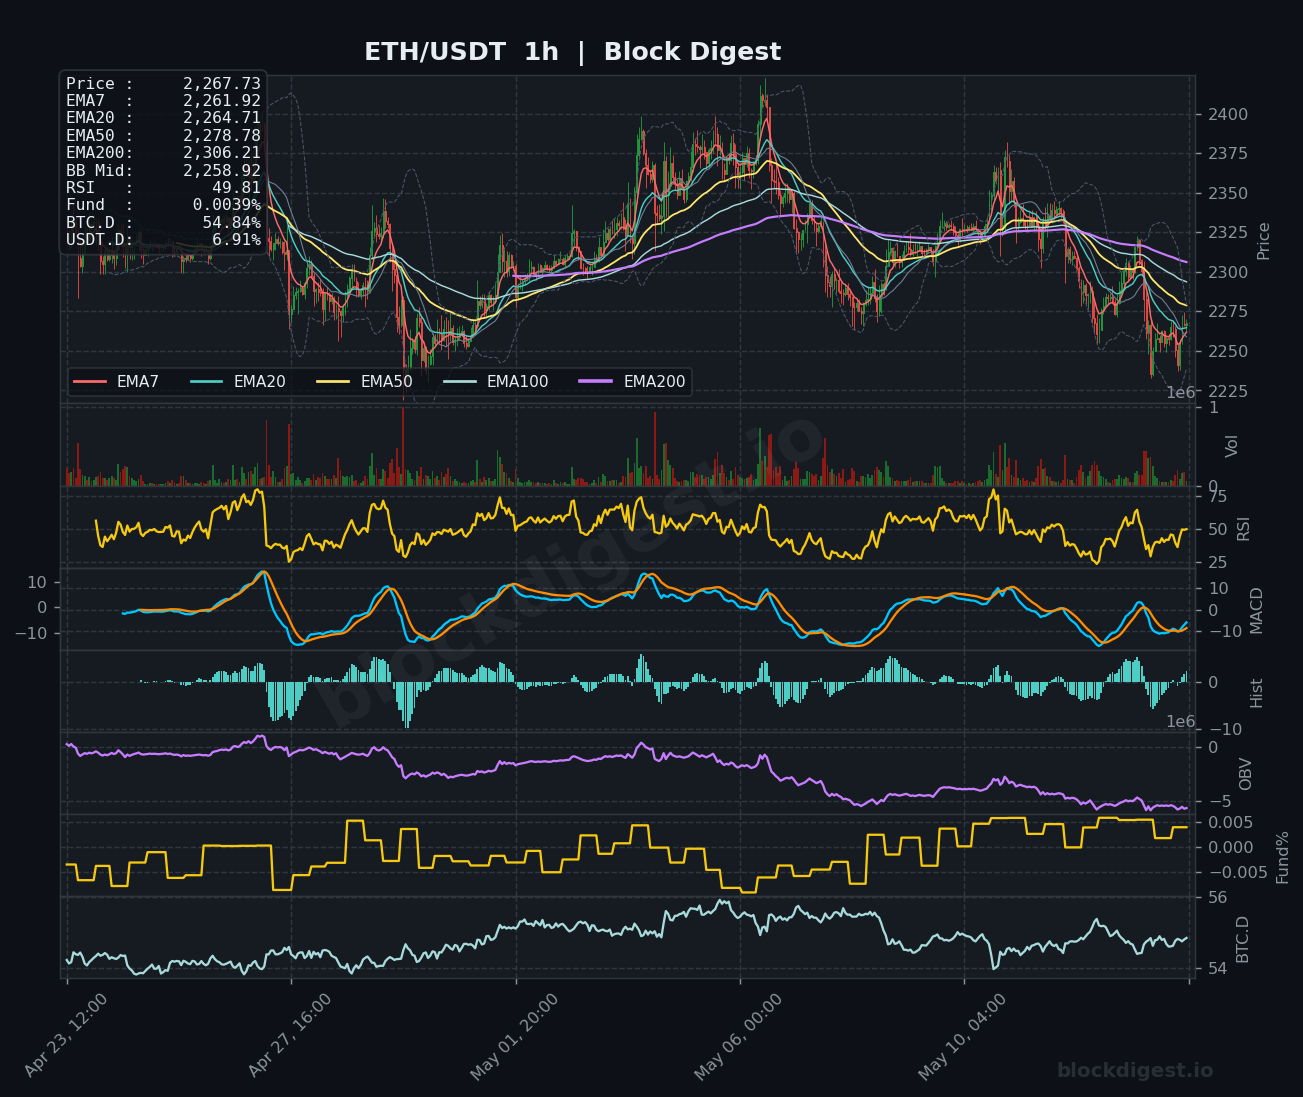
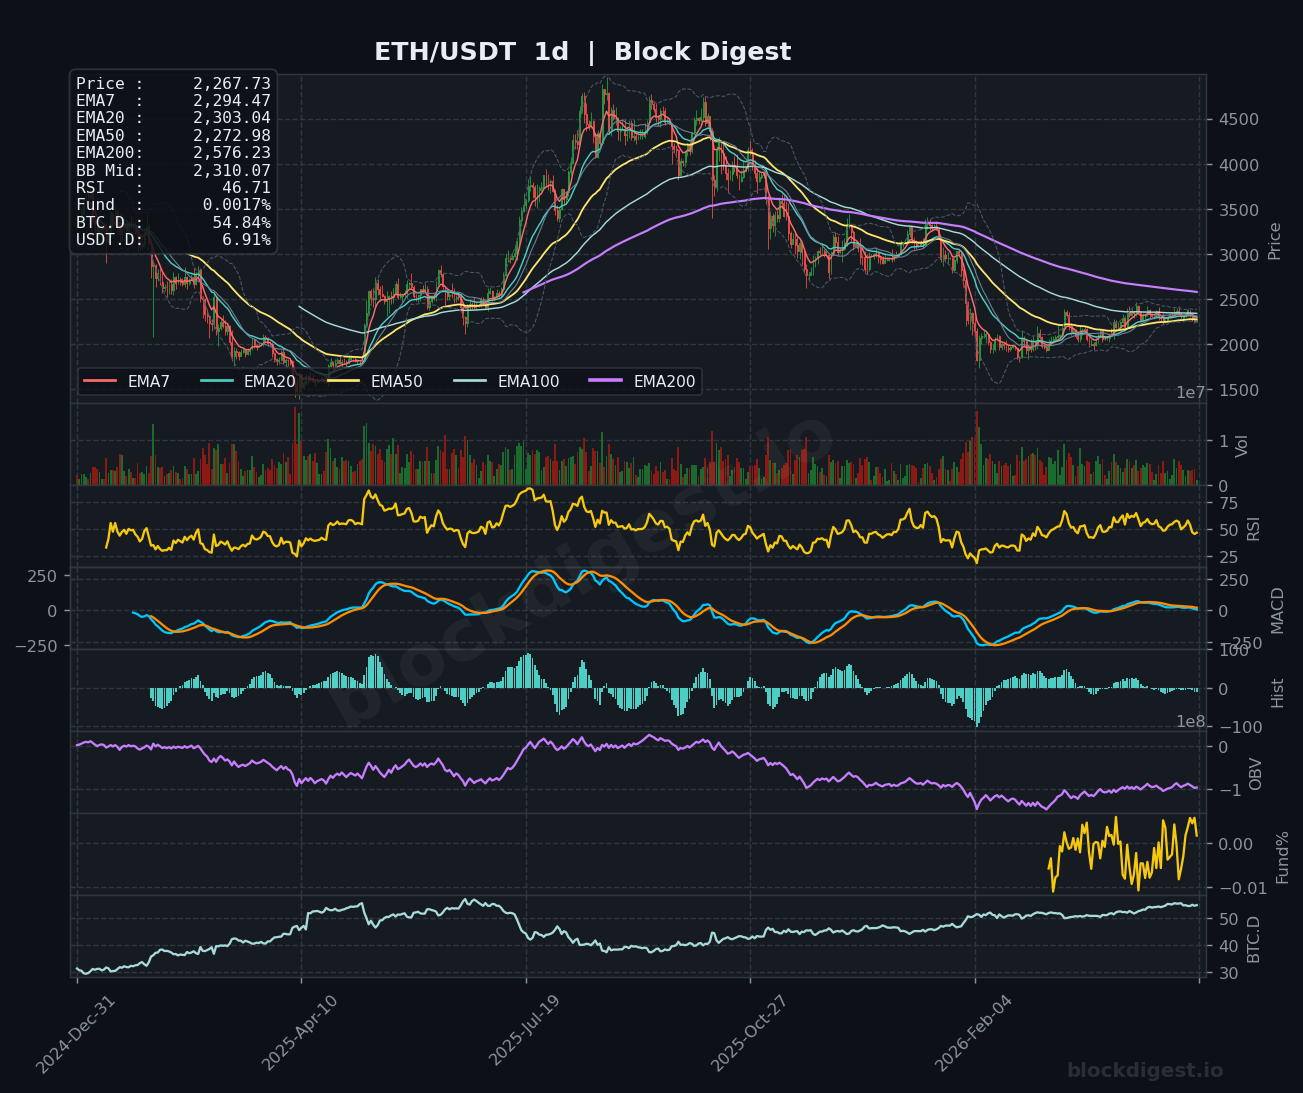
Ethereum is currently trading at $2,267.73, positioned below all major exponential moving averages on the daily timeframe, signaling persistent bearish pressure. Price action remains compressed below the EMA200 at $2,576.23, with the daily chart showing a clear downtrend structure as shorter-term EMAs (7, 20, 50) have crossed below longer-term averages. The Bollinger Band middle line at $2,310.07 is acting as immediate overhead resistance, while price is trading near the lower band, indicating oversold conditions but also confirming the strength of the current downward momentum. The daily timeframe structure remains decisively bearish, with ETH trading approximately 12% below the critical EMA200 level.
Multi-Timeframe Confluence
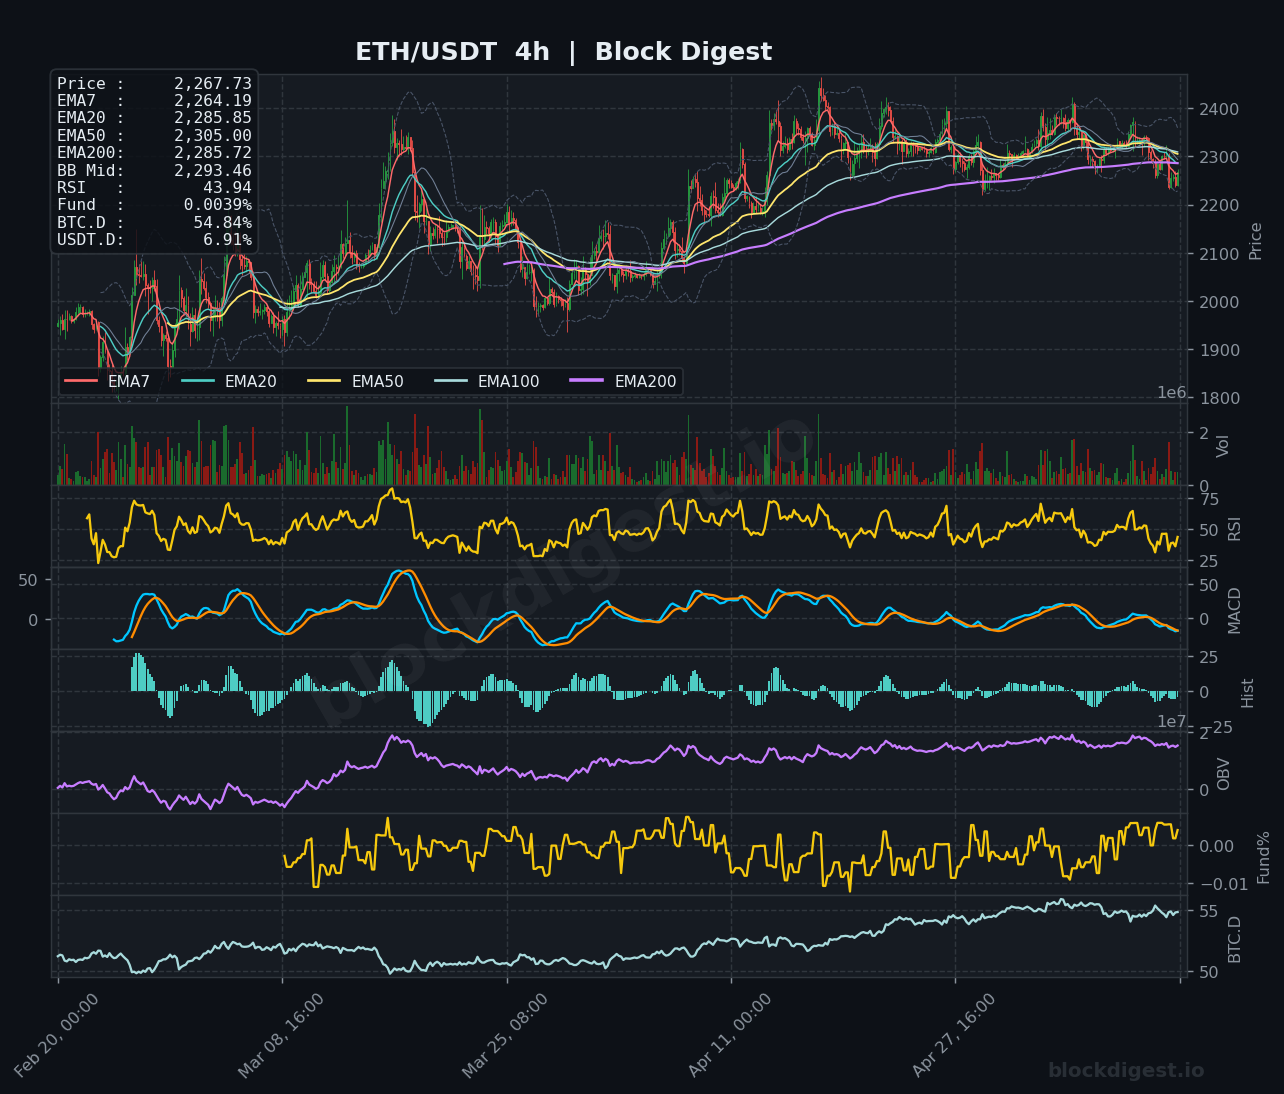
The multi-timeframe analysis reveals deteriorating momentum across all periods, with the 1-hour chart showing price breaking below the EMA50 at $2,278.78 and the 4-hour timeframe displaying a bearish EMA structure where all shorter averages have crossed below the EMA200 at $2,285.72. Both lower timeframes confirm the daily bearish bias, with price consistently failing to reclaim key moving averages during recent relief rallies. A critical confluence zone exists between $2,285-$2,306, where the 4-hour EMA200, 1-hour EMA200, and daily EMA50 converge, creating a formidable resistance cluster. The alignment of bearish momentum across all three timeframes suggests limited near-term upside potential without a significant catalyst, though short-term oversold readings on the 1-hour RSI at 49.81 may enable brief counter-trend bounces.
Key Levels to Watch
Resistance:
- $2,293-$2,306: Dense resistance cluster formed by the daily EMA50 ($2,272.98), 4-hour EMA200 ($2,285.72), and 1-hour EMA200 ($2,306.21), representing the first major hurdle for any recovery attempt
- $2,375-$2,400: Previous support-turned-resistance zone aligning with the 4-hour Bollinger Band upper range and multiple failed breakout attempts visible on recent price action
- $2,576: Daily EMA200, the most significant resistance level that would need to be reclaimed to invalidate the broader bearish structure and signal potential trend reversal
Support:
- $2,225-$2,240: Immediate support zone representing recent swing lows on the 1-hour chart and the current consolidation floor
- $2,180-$2,200: Secondary support corresponding to the lower Bollinger Band on the 1-hour timeframe and a volume gap from previous decline
- $2,100: Major psychological support level and the approximate low from the prior significant selloff visible on the daily chart, representing a critical demand zone
Momentum & On-Chain Signals
Momentum indicators across timeframes paint a bearish picture, with the 1-hour RSI at 49.81 showing neutral-to-weak conditions, the 4-hour RSI at 43.94 confirming selling pressure without yet reaching oversold territory, and the daily RSI at 46.71 indicating sustained bearish momentum. The MACD on the 4-hour chart shows both lines trending below zero with the histogram displaying negative values, though recent bars suggest potential stabilization rather than acceleration. Most concerning is the daily MACD, which remains decisively bearish with widening negative histogram bars, indicating strengthening downward momentum on the higher timeframe. The OBV across all timeframes shows a concerning downtrend, confirming distribution patterns with declining volume during rallies and elevated volume during selloffs. Funding rates at 0.0039% remain slightly positive but modest, suggesting perpetual traders aren’t heavily positioned for immediate downside, which could allow for short-term relief but doesn’t signal conviction in either direction.
BTC Dominance & Market Sentiment
Bitcoin Dominance at 54.84% has been steadily climbing, reflecting a clear risk-off rotation within crypto markets as capital flows away from altcoins like Ethereum and into Bitcoin as a relative safe haven. This elevated BTC.D reading typically pressures ETH/USD price action, as evidenced by the current underperformance relative to Bitcoin’s more stable structure. USDT Dominance at 6.91% remains elevated, indicating continued stablecoin accumulation and suggesting market participants are preserving capital rather than deploying fresh liquidity into risk assets. The combination of rising BTC.D and elevated USDT.D creates a challenging environment for Ethereum specifically, as it faces dual headwinds from both Bitcoin outperformance and broader market risk aversion.
Risk Scenarios
Bullish case: A sustained reclaim above the $2,285-$2,306 resistance cluster with accompanying volume expansion would suggest short-term exhaustion of selling pressure and could trigger a relief rally toward $2,375-$2,400. Confirmation would require the 4-hour RSI breaking above 50 and the daily candle closing above the EMA50 at $2,272.98, with initial targets at the daily EMA20 ($2,393.04) and potential extension toward $2,450 if momentum accelerates and funding rates turn decisively positive.
Bearish case: Failure to hold the $2,225-$2,240 support zone, particularly on increasing volume and with RSI breaking below 40 on the 4-hour timeframe, would likely trigger accelerated selling toward $2,180-$2,200. A breakdown below $2,180 would open the door to $2,100 and potentially $2,000 psychological support, especially if accompanied by BTC.D continuing its upward trajectory above 55% and daily MACD histogram bars expanding further into negative territory.
Outlook
Ethereum remains in a confirmed downtrend across all meaningful timeframes, with current price action suggesting consolidation ahead of the next directional move. The critical level to monitor over the next 24-48 hours is the $2,225-$2,240 support zone; a breakdown here would likely accelerate selling toward $2,180 and lower targets, while a hold could enable a relief bounce toward the $2,285-$2,306 resistance cluster. For any bullish thesis to develop, ETH must reclaim the confluence resistance zone with conviction and begin building higher lows on the 4-hour chart. Until price action demonstrates the ability to sustainably trade above the EMA200 on both the 1-hour and 4-hour timeframes, the path of least resistance remains lower, with rallies presenting potential short opportunities rather than long entries. The broader macro environment, evidenced by elevated BTC.D and USDT.D readings, suggests patience is warranted before aggressive positioning on the long side.
Disclaimer: This analysis is for informational purposes only and does not constitute financial advice. Cryptocurrency markets are highly volatile and unpredictable. All trading decisions should be made based on your own research and risk tolerance. Block Digest is not responsible for any financial losses incurred as a result of acting on this content.