
ETH Daily Analysis – May 16, 2026
Market Overview
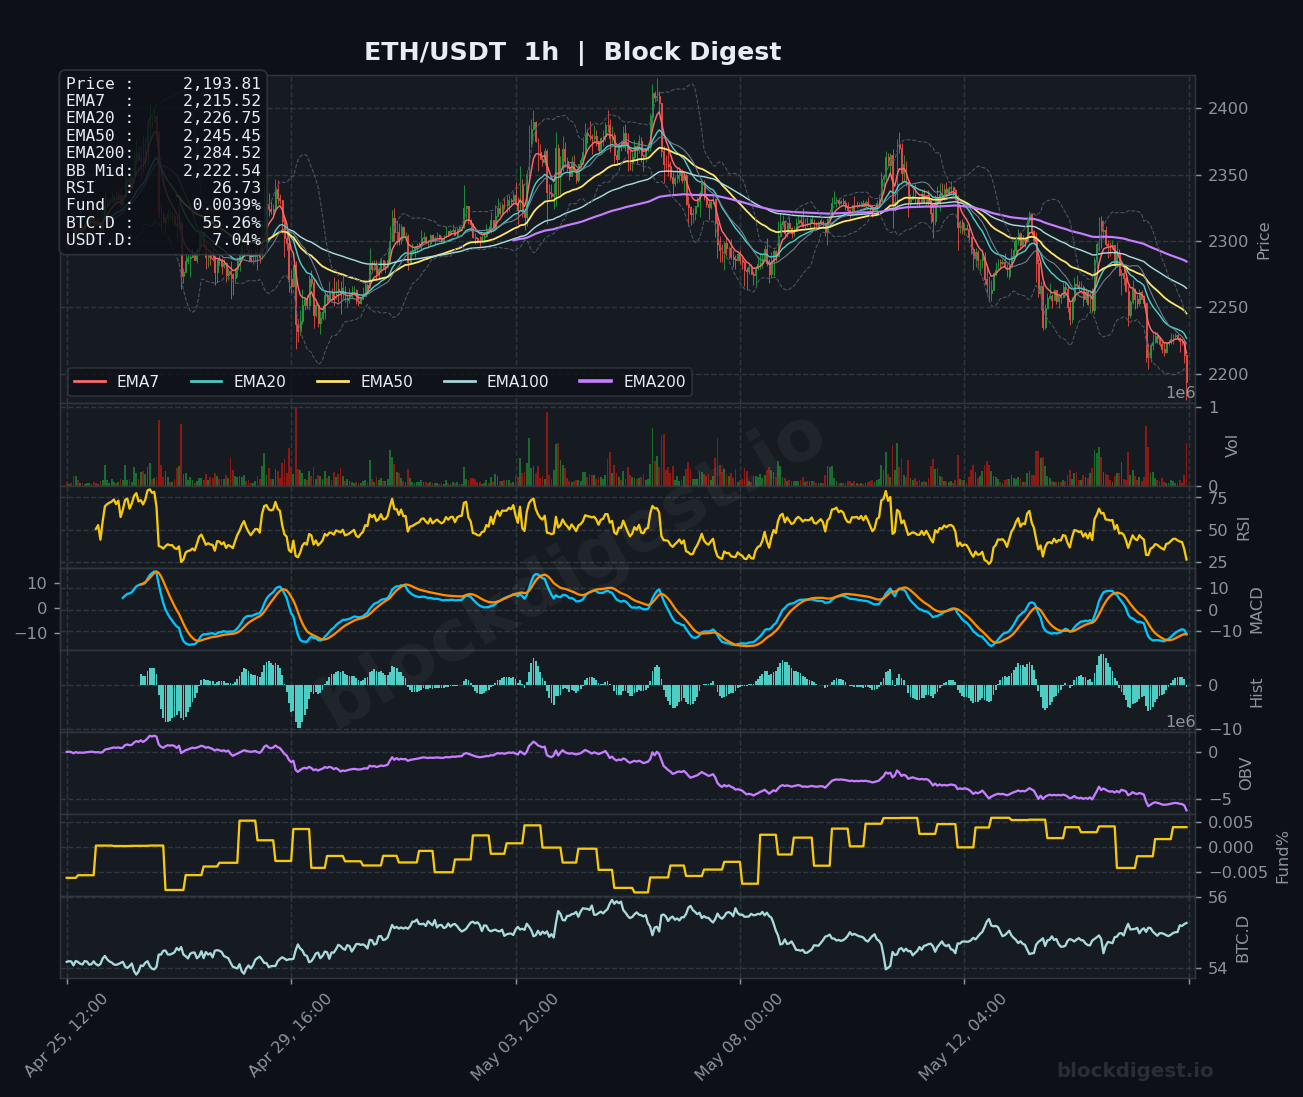
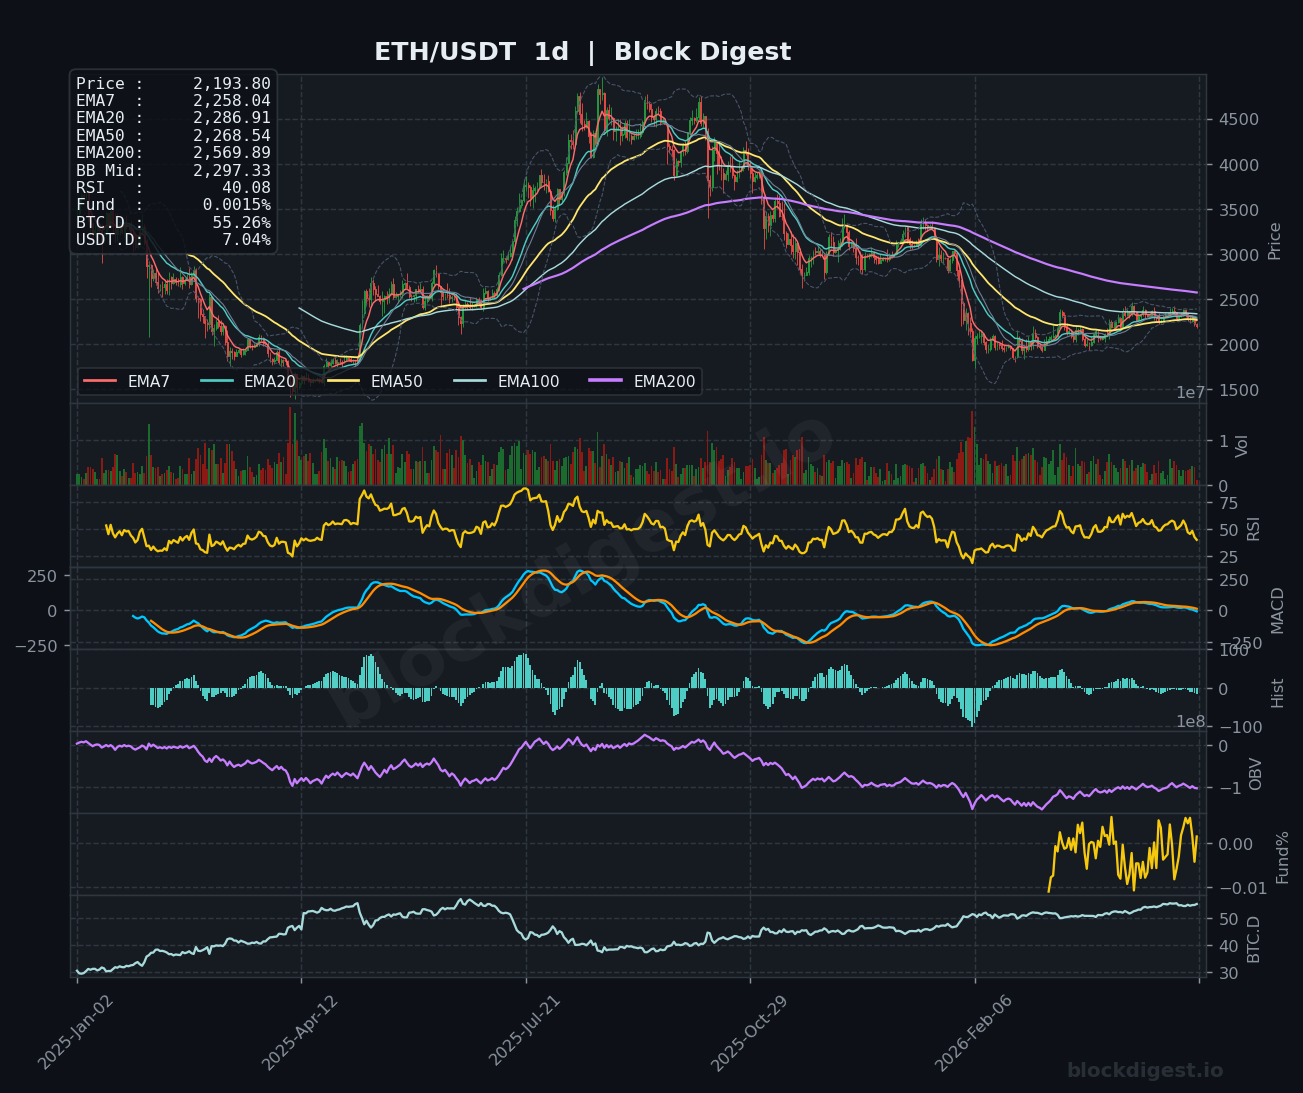
Ethereum is trading at $2,193.80, experiencing significant bearish pressure as price has broken below all major exponential moving averages across multiple timeframes. On the daily chart, ETH is trading well below the EMA7 ($2,258.04), EMA20 ($2,286.91), EMA50 ($2,268.54), and critically beneath the EMA200 ($2,569.89), confirming a firmly established downtrend. Price is currently testing the lower Bollinger Band at $2,222 on the 1-hour timeframe, indicating oversold conditions in the short term, though the daily structure remains decisively bearish with all EMAs pointing downward and price consolidating near multi-week lows.
Multi-Timeframe Confluence
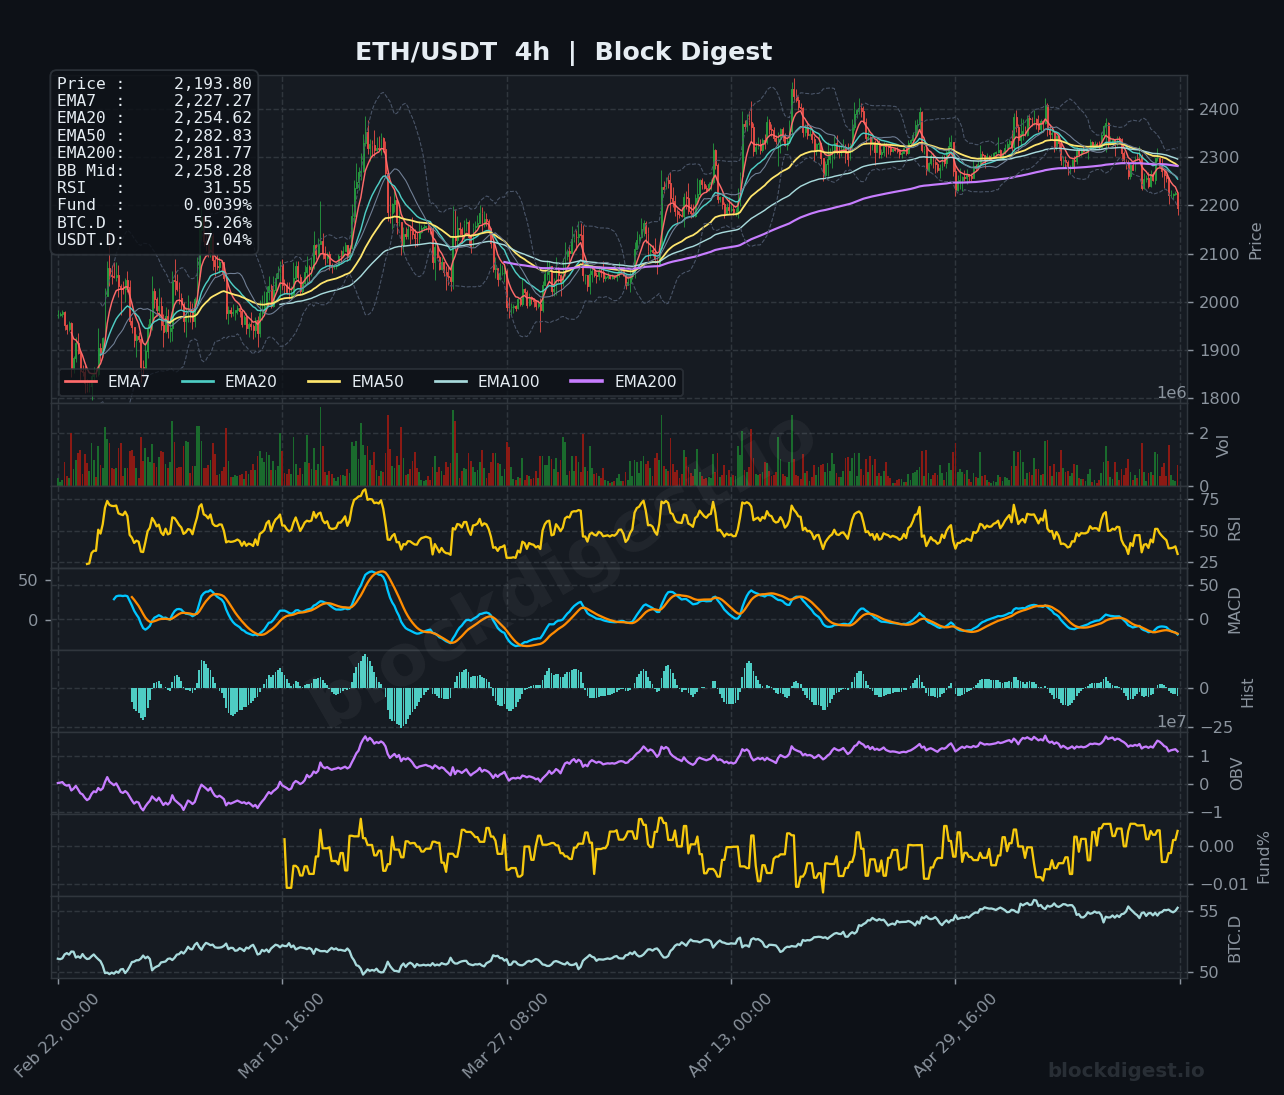
A clear bearish alignment exists across all analyzed timeframes, with the 1-hour, 4-hour, and daily charts showing price trading below key moving averages and forming lower highs and lower lows. The 1-hour chart displays price at $2,193.81 beneath all EMAs, while the 4-hour timeframe mirrors this structure at $2,193.80, with resistance forming at the EMA7 ($2,227.27) and EMA20 ($2,254.62). The daily timeframe confirms the broader downtrend with price consolidating in a tight range between $2,150-$2,250, suggesting potential for either a continuation breakdown or a relief bounce. Notably, the EMA200 on the daily chart at $2,569.89 represents the critical dividing line between bullish and bearish market structure, and remains far above current price action.
Key Levels to Watch
Resistance:
- $2,227.27 – 4-hour EMA7 and immediate overhead resistance; reclaiming this level would signal short-term momentum shift
- $2,254.62 – 4-hour EMA20 confluence zone; a break above would target the psychological $2,280-$2,285 area where the daily EMA20 resides
- $2,350-$2,400 – Major resistance cluster representing the late April/early May consolidation zone and the 4-hour EMA50 ($2,282.83) extension area
Support:
- $2,180-$2,190 – Current demand zone and lower Bollinger Band on 1-hour; a breakdown here opens the door to deeper losses
- $2,150 – Critical support representing recent multi-week lows visible on the daily chart; loss of this level would accelerate selling pressure
- $2,080-$2,100 – Extended support target aligning with the late February lows and representing a -5% decline from current levels
Momentum & On-Chain Signals
RSI readings paint a uniformly oversold picture in the short term but suggest potential for further downside on higher timeframes. The 1-hour RSI sits at 26.73, indicating extreme short-term oversold conditions that typically precede relief bounces, while the 4-hour RSI at 31.55 also suggests bearish exhaustion. However, the daily RSI at 40.08 remains above oversold territory, indicating room for additional downside before reaching capitulation levels. The MACD on all timeframes shows bearish momentum with histograms declining, though the 1-hour and 4-hour charts are approaching potential bullish divergence zones if price stabilizes. OBV across all timeframes shows persistent distribution with declining volume trends, confirming the lack of institutional accumulation. The Funding Rate at 0.0039% remains slightly positive but has decreased substantially from earlier elevated levels, suggesting reduced bullish speculation and a more neutral derivatives positioning.
BTC Dominance & Market Sentiment
Bitcoin dominance stands at 55.26%, reflecting a risk-off environment where capital flows favor BTC over altcoins including ETH, typically occurring during periods of market uncertainty or correction phases. USDT dominance at 7.04% has increased notably, signaling growing stablecoin preference as traders move to the sidelines and reduce exposure to volatile assets. This combination of rising BTC.D and USDT.D creates a challenging environment for ETH price appreciation, as it suggests broader market participants are de-risking rather than rotating into alternative cryptocurrencies.
Risk Scenarios
Bullish case: A sustained reclaim of the $2,227 level (4h EMA7) with accompanying volume expansion could trigger a short-covering rally toward $2,280-$2,300, particularly if RSI divergences materialize on lower timeframes. A decisive break above $2,300 with daily candle close would invalidate the immediate bearish thesis and target the $2,400-$2,450 resistance zone.
Bearish case: Failure to hold the $2,180-$2,190 support zone with increased selling volume would likely accelerate toward the $2,150 critical support level. A breakdown below $2,150 on the daily timeframe would open a path toward $2,080-$2,100, representing an additional 5-7% downside and potentially triggering cascading liquidations as evidenced by recent market-wide long position flush-outs.
Outlook
Ethereum remains in a defined downtrend with bearish structure intact across all timeframes, though short-term oversold conditions suggest potential for a tactical relief bounce toward the $2,220-$2,250 resistance cluster. The key trigger to monitor over the next 24-48 hours is whether ETH can reclaim and hold above $2,227 with conviction, which would provide the first signal of momentum shift; conversely, a breakdown below $2,180 would confirm continuation of the downtrend. The critical inflection point remains at $2,150—a loss of this level would likely accelerate selling pressure toward $2,080-$2,100, while a successful defense could provide the foundation for a longer-term base formation. Until price reclaims the EMA20 on the daily timeframe ($2,286.91) and establishes higher lows, the path of least resistance remains to the downside despite short-term oversold readings.
Disclaimer: This analysis is for informational purposes only and does not constitute financial advice. Cryptocurrency markets are highly volatile and unpredictable. All trading decisions should be made based on your own research and risk tolerance. Block Digest is not responsible for any financial losses incurred as a result of acting on this content.
Stay Ahead of the Market
Follow BlockDigest for crypto market intelligence, research and real-time updates.


