
BTC Daily Analysis — 2026-07-28 (Full Archive)
Market Overview
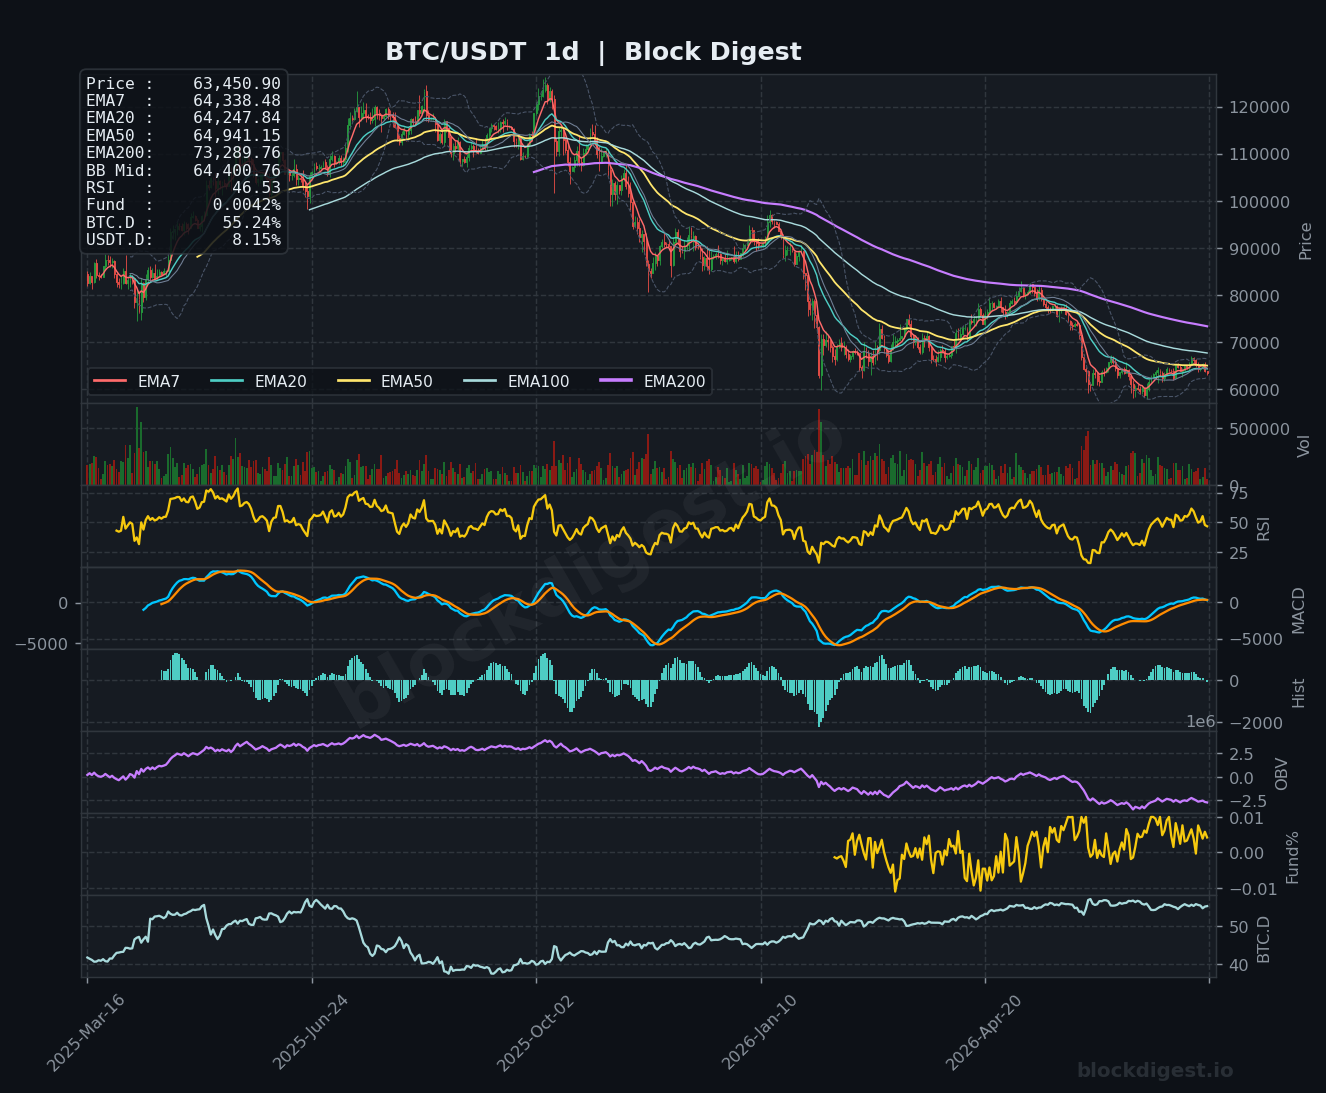
Bitcoin is currently trading at $63,450, sitting beneath a dense cluster of short-term EMAs that are signaling overhead resistance. On the daily timeframe, price has staged a recovery from the deep lows seen earlier in 2026 but remains well below the EMA200 ($73,289), which continues to slope downward — a structural reminder that the macro trend has not yet reversed. Price is trading below the daily Bollinger Band midline ($64,400), a level that has historically acted as a pivot between bullish and bearish regimes. The dominant daily structure remains a downtrend from the highs, and the current price action looks more like a range consolidation within that broader bearish trend than a confirmed reversal.
Multi-Timeframe Confluence
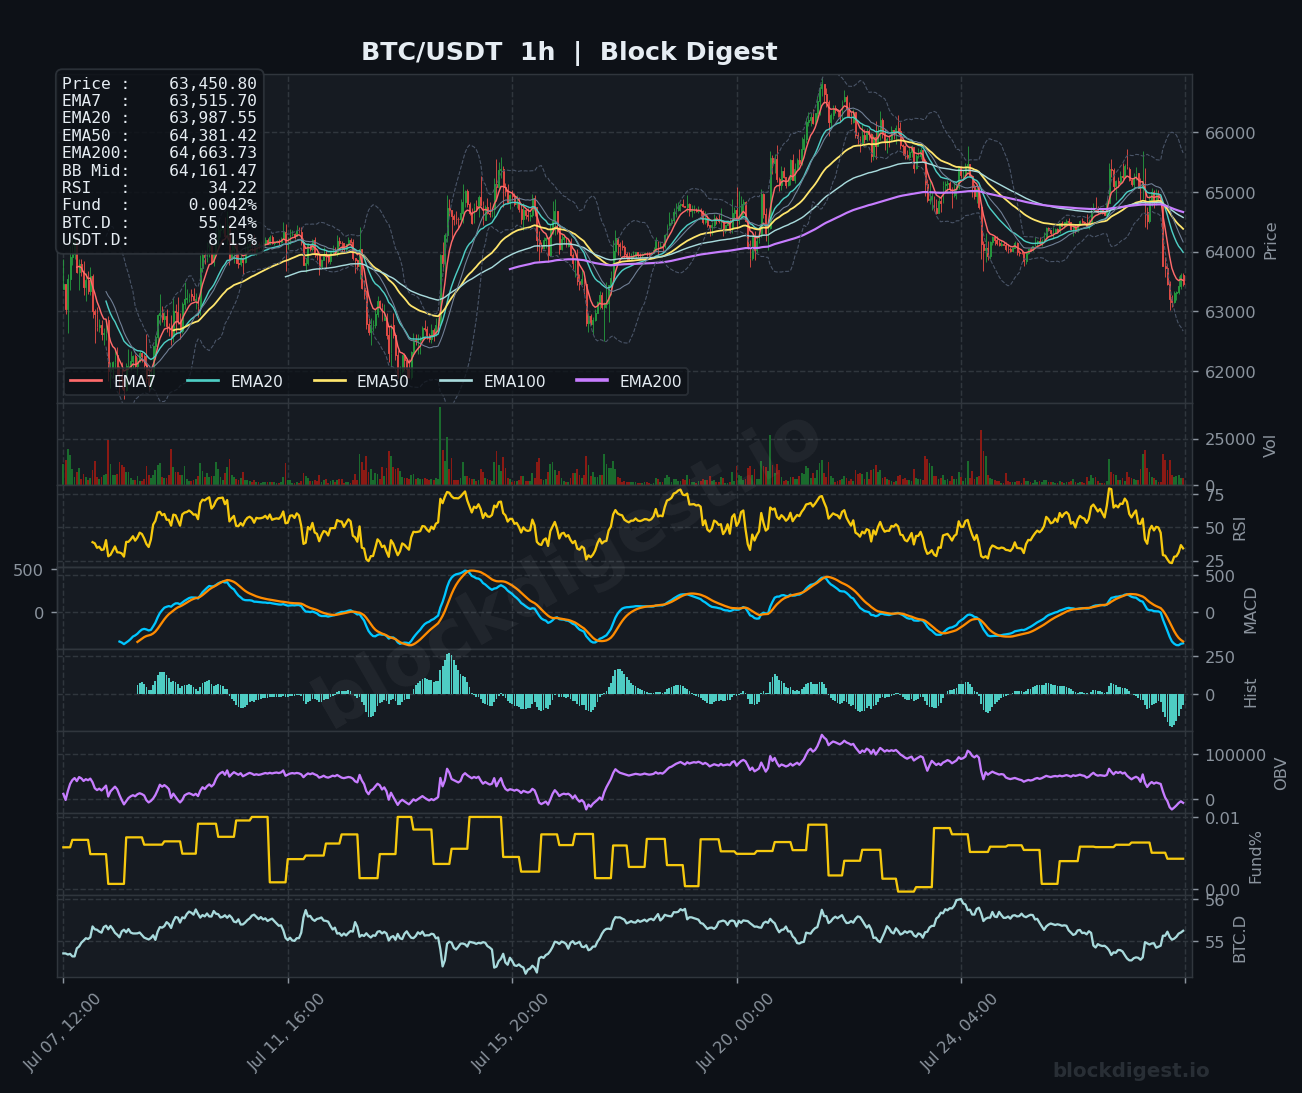
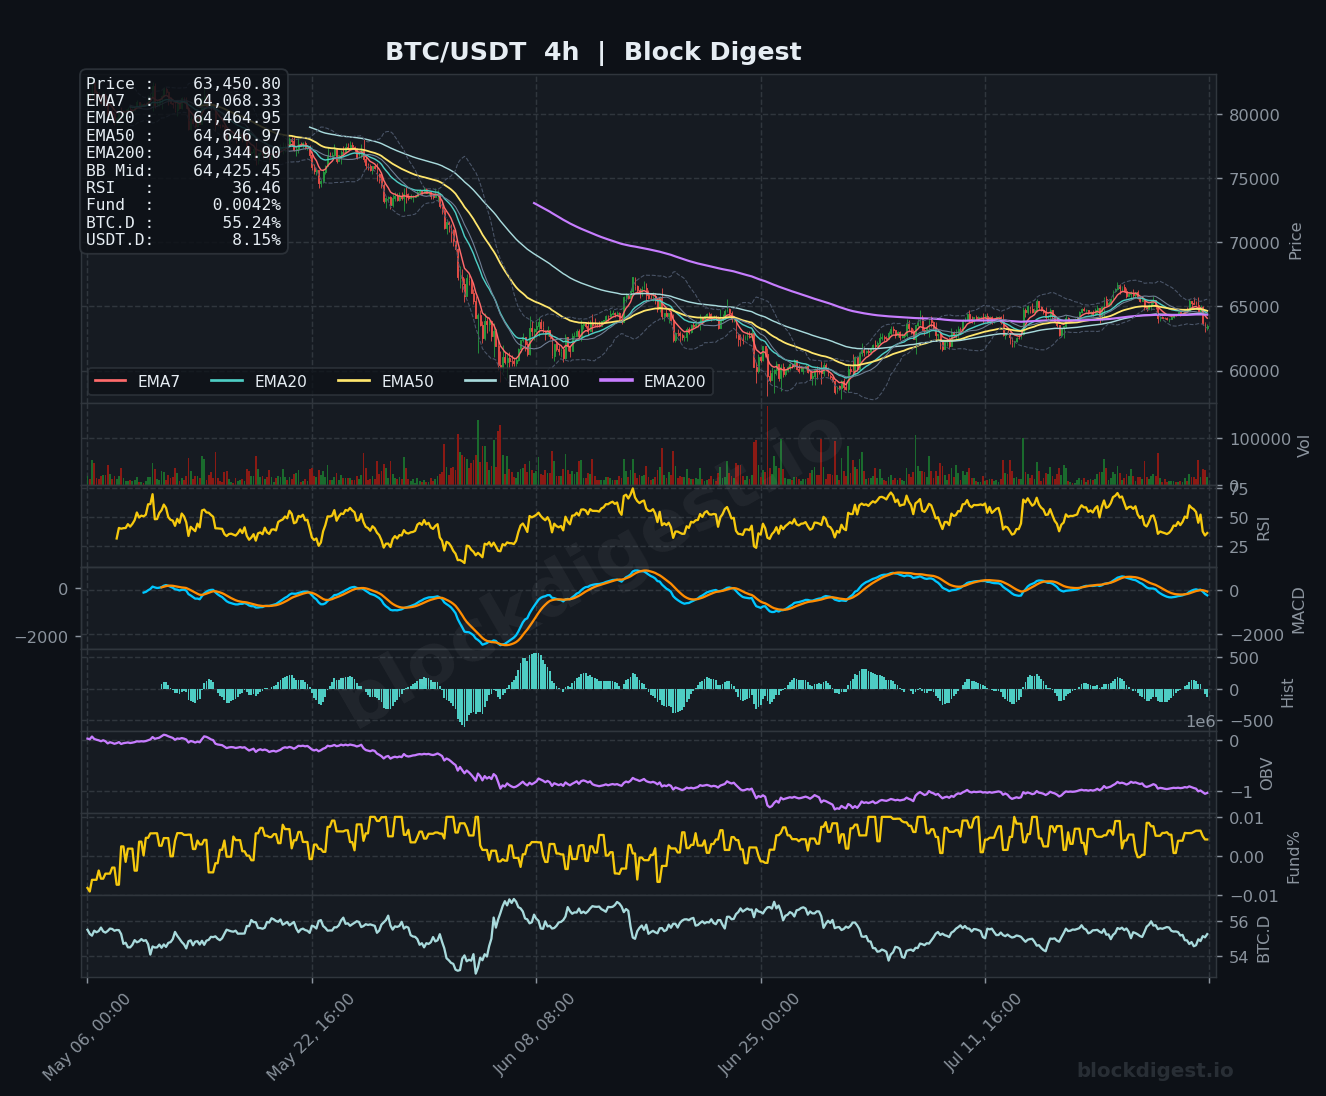
Across all three timeframes, price is trading below the key short-term EMAs, with the 1h chart showing EMA7 ($63,515), EMA20 ($63,987), EMA50 ($64,381), and EMA200 ($64,663) all stacked above current price — a classic bearish alignment. On the 4h chart, the EMA cluster between $64,068 and $64,646 forms a compressed resistance zone that price recently failed to sustain above, with the subsequent rejection driving the current leg lower. The daily chart reinforces this bearish EMA stack, and the convergence of the Bollinger Band midline and the EMA cluster around $64,400–$64,940 creates a formidable confluence resistance zone. Short-term momentum is therefore actively diverging from any recovery thesis, with lower timeframes confirming downside pressure rather than supporting a bounce.
Key Levels to Watch
- Resistance: $64,400–$64,465 — 4h BB midline and EMA20/EMA50 confluence; first meaningful ceiling on any bounce attempt
- Resistance: $64,941 — daily EMA50, a level price has repeatedly failed to reclaim on a closing basis in recent weeks
- Resistance: $65,500–$66,000 — prior swing highs visible on the 1h chart, aligning with the upper range of recent consolidation
- Support: $63,000–$63,200 — immediate demand zone; psychological round number and near-term structural low
- Support: $62,000 — mid-range support that capped the prior recovery phase; a breach here would signal accelerating weakness
- Support: $60,000–$60,500 — major structural support zone from the deep lows of early 2026; loss of this area would materially shift the macro picture
Momentum & On-Chain Signals
The 1h RSI is deeply depressed at 34.22, flirting with oversold territory but not yet triggering a clear mean-reversion signal, while the daily RSI at 46.57 — as captured in Block Digest’s BD Pulse data — sits in a neutral-to-bearish range, confirming that no meaningful buying pressure has yet materialized at the macro level. The 4h MACD shows both lines crossing below zero with a bearish histogram expanding, suggesting the intermediate trend has decisively rolled over. OBV on the 4h and daily timeframes remains in a downtrend, with Block Digest’s BD Pulse OBV Trend reading of -1 reinforcing that volume is flowing out rather than accumulating on dips. The funding rate, sitting at a modest +0.0052%, indicates the futures market is not meaningfully leveraged to the long side, which removes the threat of a large forced liquidation cascade but equally offers little short-squeeze fuel.
BTC Dominance & Market Sentiment
BTC dominance is holding at 55.21%, reflecting Bitcoin’s relative resilience versus altcoins during this period of uncertainty — capital is not rotating aggressively into risk-on assets. USDT.D at 8.15% suggests a non-trivial portion of market participants remain in stablecoins on the sidelines, which could represent latent buying power but also indicates conviction for deploying capital into BTC is currently low. The high-stakes Fed meeting referenced in today’s macro backdrop adds an additional layer of caution, with traders likely unwilling to take aggressive directional positions ahead of a potentially market-moving policy signal.
Risk Scenarios
- Bullish case: A decisive hourly close back above $64,400 with expanding volume would suggest the EMA cluster is being absorbed, opening a path toward a retest of the daily EMA50 at $64,941 and potentially the $65,500 resistance zone. A dovish Fed outcome could act as the catalyst needed to trigger this move.
- Bearish case: Failure to hold the $63,000 support zone on a closing basis would confirm the current leg lower has further to run, targeting the $62,000 level next and raising the risk of a deeper move toward the $60,000–$60,500 structural support.
Outlook
The near-term bias leans cautiously bearish, with price trading beneath a stacked EMA structure across all three timeframes and Block Digest’s BD Pulse Score of 39/100 reflecting the prevailing weak momentum. The $64,400–$64,941 zone is the critical range to reclaim for any thesis shift — without it, each bounce is likely to be sold. The Fed meeting represents the single largest macro wildcard over the next 24–48 hours, with a hawkish surprise potentially accelerating the downside and a dovish pivot providing the exogenous catalyst bulls need. Until price can close daily candles above the BB midline and EMA cluster, the path of least resistance remains lower.
—
Disclaimer: This analysis is for informational purposes only and does not constitute financial advice. Cryptocurrency markets are highly volatile and unpredictable. All trading decisions should be made based on your own research and risk tolerance. Block Digest is not responsible for any financial losses incurred as a result of acting on this content.
