BTC Daily Analysis — 2026-07-24 (Full Archive)
Market Overview
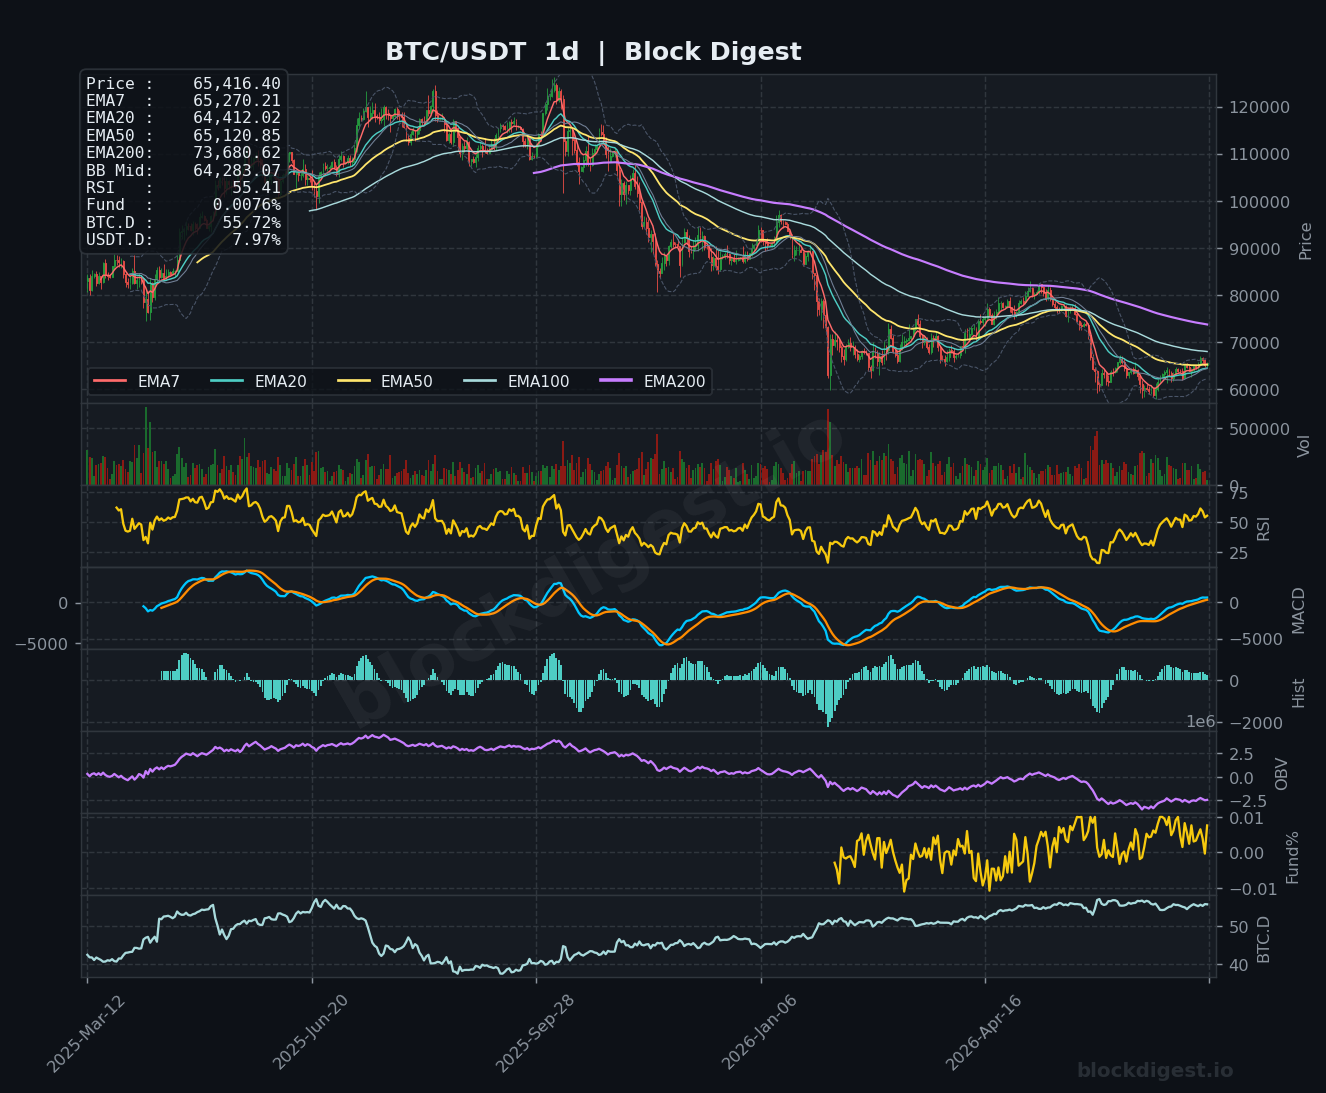
Bitcoin is trading at $65,415 as of July 24, 2026, consolidating in a tight range after a notable recovery from the cycle lows seen earlier this year. On the daily timeframe, price has clawed back above the EMA7 ($65,270) and EMA50 ($65,120), signaling recovering short-term momentum, though the EMA200 sits far overhead at $73,680 — a reminder of the structural damage inflicted during the multi-month downtrend. Price is currently trading just above the Bollinger Band midline at $64,283, suggesting the market is attempting to reclaim neutral territory rather than definitively breaking higher. The dominant daily trend remains corrective within a broader recovery attempt, and until BTC convincingly clears the descending EMA200, the macro structure stays cautious.
Multi-Timeframe Confluence
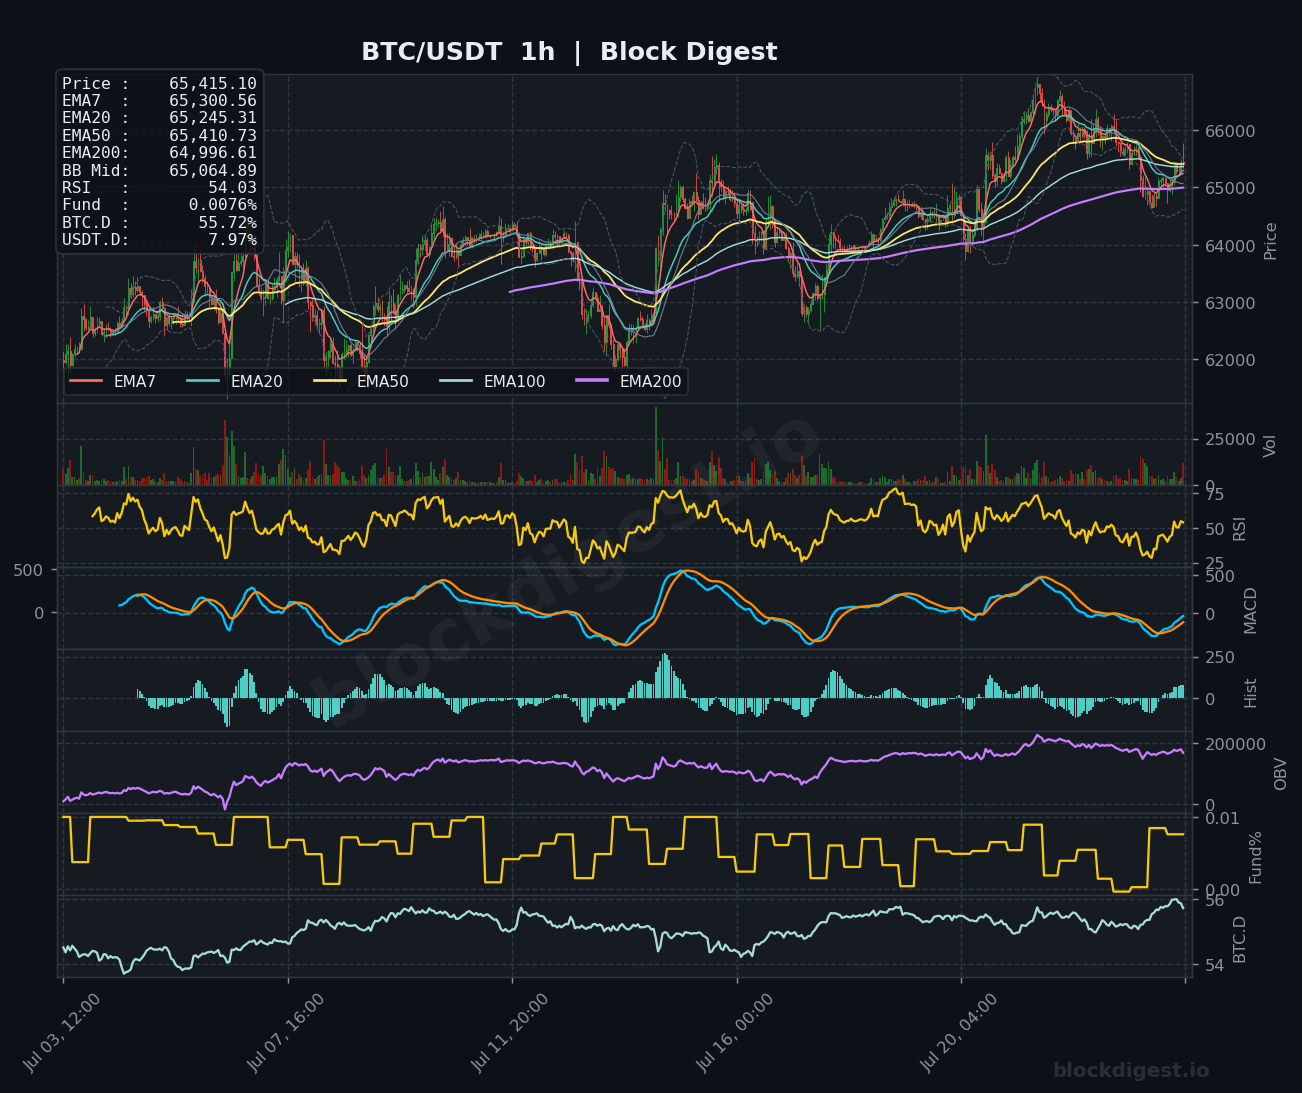
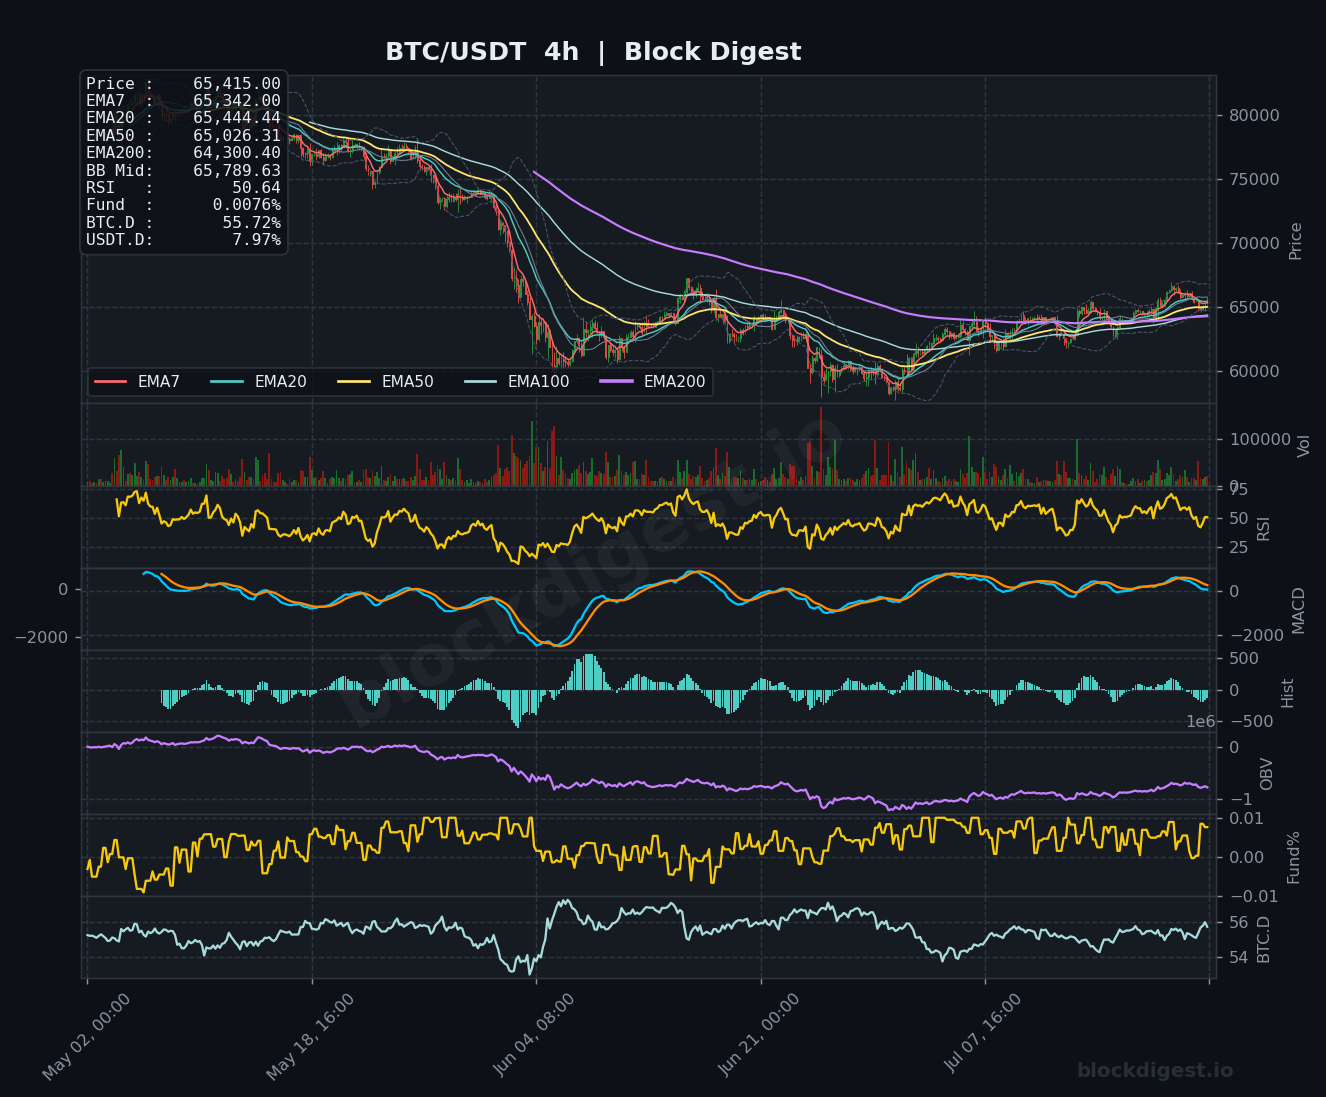
On the 1-hour chart, price is holding above all short-term EMAs (EMA7 at $65,300, EMA20 at $65,245, EMA50 at $65,410), which are beginning to fan out in bullish order — a constructive near-term signal. However, the 4-hour chart tells a more nuanced story: price is trading just below the EMA20 at $65,444, and the Bollinger Band midline at $65,789 remains overhead resistance, indicating the intermediate-term recovery still faces friction. Across all three timeframes, the $65,000–$65,120 zone (coinciding with the daily EMA50 and hourly EMA200 at $64,996) emerges as a critical confluence support area. The alignment of short-term bullish structure with a still-recovering intermediate trend suggests any upside will likely be methodical rather than impulsive.
Key Levels to Watch
- Resistance: $65,789 — 4h Bollinger Band midline, acting as immediate overhead target and the level bulls need to reclaim for momentum continuation
- Resistance: $66,000 — psychological round number and recent swing high visible on the 1h chart, where sellers stepped in aggressively
- Resistance: $73,680 — daily EMA200, the defining macro resistance that caps the broader recovery thesis
- Support: $65,000–$65,120 — daily EMA50 and 1h EMA200 confluence zone; a loss of this area on a closing basis would be a significant short-term warning
- Support: $64,283 — daily Bollinger Band midline; reclaimed recently but must hold to preserve bullish structure
- Support: $63,000–$63,500 — prior consolidation base and a major structural floor from the recent recovery phase
Momentum & On-Chain Signals
The daily RSI sits at 55.41, consistent with Block Digest’s BD Pulse RSI reading of 55.06 — both figures hovering in mildly bullish neutral territory, well short of overbought conditions that would raise red flags. The 4-hour MACD lines have converged near zero with a marginally positive histogram, suggesting momentum is attempting a low-energy crossover rather than a strong impulse. Notably, Block Digest’s BD Extreme Index registers at +1.03σ, nudging into overbought territory — a signal that caution is warranted on aggressive long entries at current levels even if the trend is improving. The OBV trend indicator (BD Pulse score: +1) confirms a positive accumulation bias on the 1-hour timeframe, though the 4-hour OBV remains in a longer-term declining channel, pointing to an unresolved distribution overhang from the earlier downtrend.
BTC Dominance & Market Sentiment
BTC dominance sits at 55.72–55.76%, a multi-year high range that reflects continued capital concentration in Bitcoin at the expense of altcoins — consistent with a defensive, risk-off posture among crypto participants. USDT.D at 7.97% remains elevated, suggesting a meaningful portion of market participants are still sitting in stablecoins rather than rotating into risk assets. This combination of high BTC dominance and elevated stablecoin dominance aligns with the reported collapse in social interest to 2018-era apathy levels — conditions that historically precede either a slow grind higher in BTC or a prolonged sideways accumulation phase rather than an explosive altcoin season.
Risk Scenarios
- Bullish case: A clean daily close above $65,789 (4h BB midline), accompanied by sustained positive funding rates and improving OBV, would open the path toward the $66,000 psychological resistance and potentially $67,500–$68,000 in the near term.
- Bearish case: A failure to hold the $65,000–$65,120 confluence support on a 4-hour closing basis would signal renewed distribution pressure, with downside targets toward $63,500 and potentially the $62,000 structural floor.
Outlook
Bitcoin’s setup on July 24, 2026 is one of cautious, low-conviction consolidation — the technical structure is improving incrementally, but the weight of evidence doesn’t yet support a high-confidence directional bet. The BD Pulse score of 50/100 captures this neutrality well: bulls have reclaimed key short-term EMAs, but the 4-hour BB midline and the distant daily EMA200 at $73,680 represent significant overhead. The 24–48 hour trigger to watch is whether BTC can sustain price action above $65,415 and push through $65,789, or whether sellers defending the $66,000 zone force another leg of consolidation back toward the $64,283–$65,000 band. With market sentiment reportedly at 2018-level apathy and exchange inflows declining, the path of least resistance appears sideways-to-slightly-higher, but conviction remains low until a decisive structural catalyst emerges.
—
Disclaimer: This analysis is for informational purposes only and does not constitute financial advice. Cryptocurrency markets are highly volatile and unpredictable. All trading decisions should be made based on your own research and risk tolerance. Block Digest is not responsible for any financial losses incurred as a result of acting on this content.