ETH Daily Analysis — 2026-07-24 (Full Archive)
Market Overview
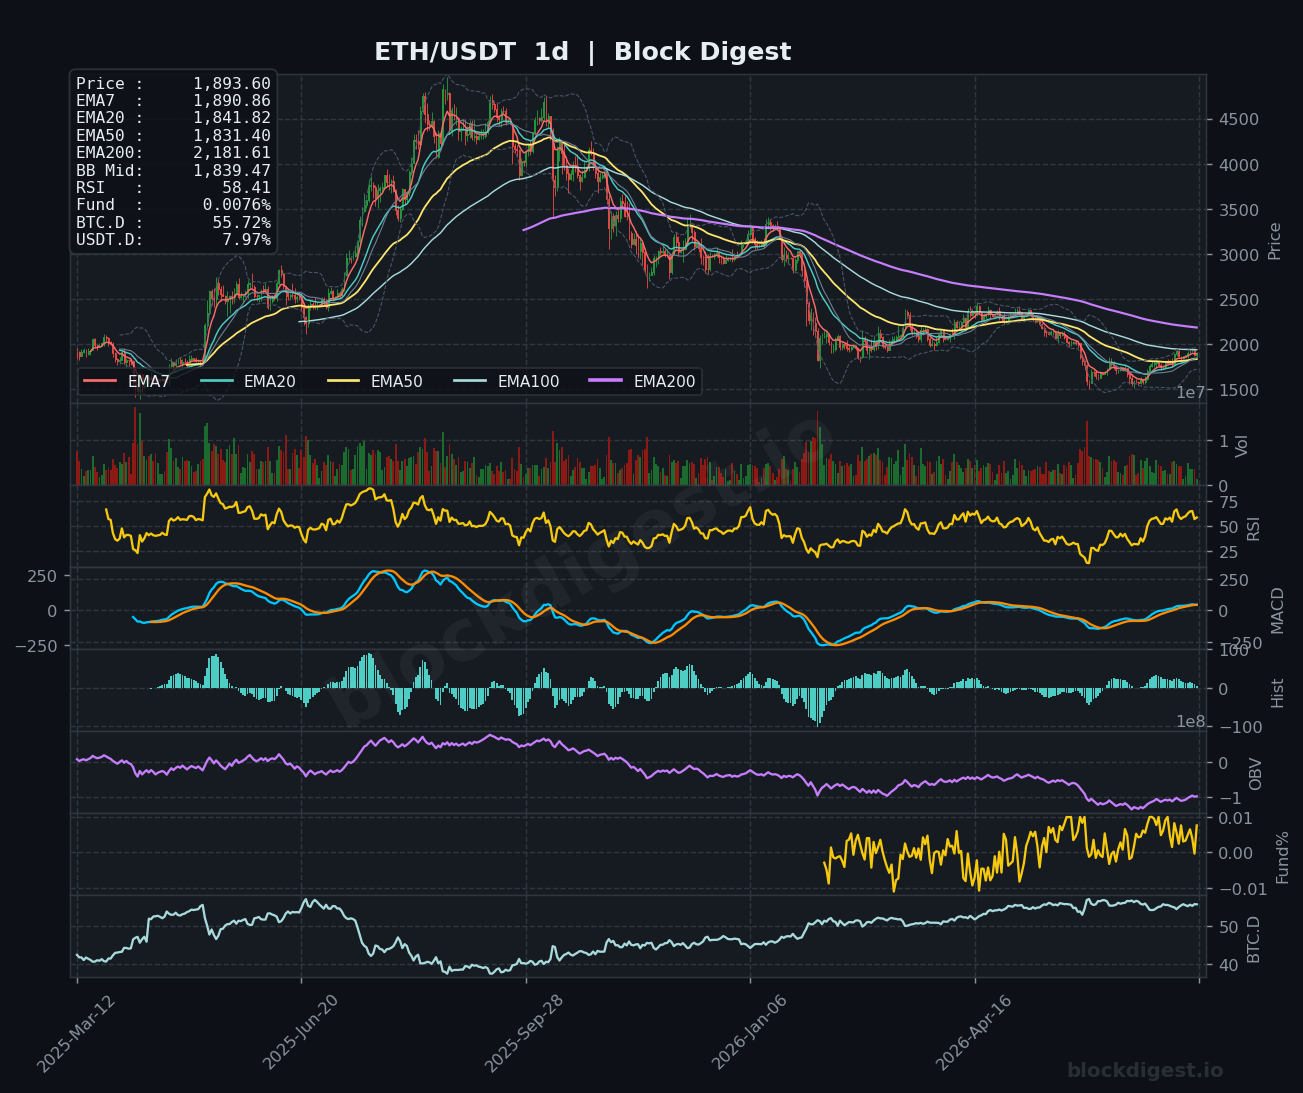
Ethereum is trading at $1,943.40 as of July 24, 2026, navigating a technically delicate zone after a notable recovery off multi-month lows. On the daily timeframe, price has reclaimed the EMA7 ($1,890.86), EMA20 ($1,841.82), and EMA50 ($1,831.40), a constructive development following the prolonged downtrend that dominated much of late 2025 into early 2026. However, the macro picture remains challenged — the daily EMA200 sits significantly higher at $2,181.61, acting as a major structural ceiling that still looms well above current price. The daily Bollinger Band midline at $1,839.47 has been reclaimed, suggesting the intermediate-term bias has shifted cautiously bullish, though momentum lacks the conviction needed to call a definitive trend reversal.
Multi-Timeframe Confluence
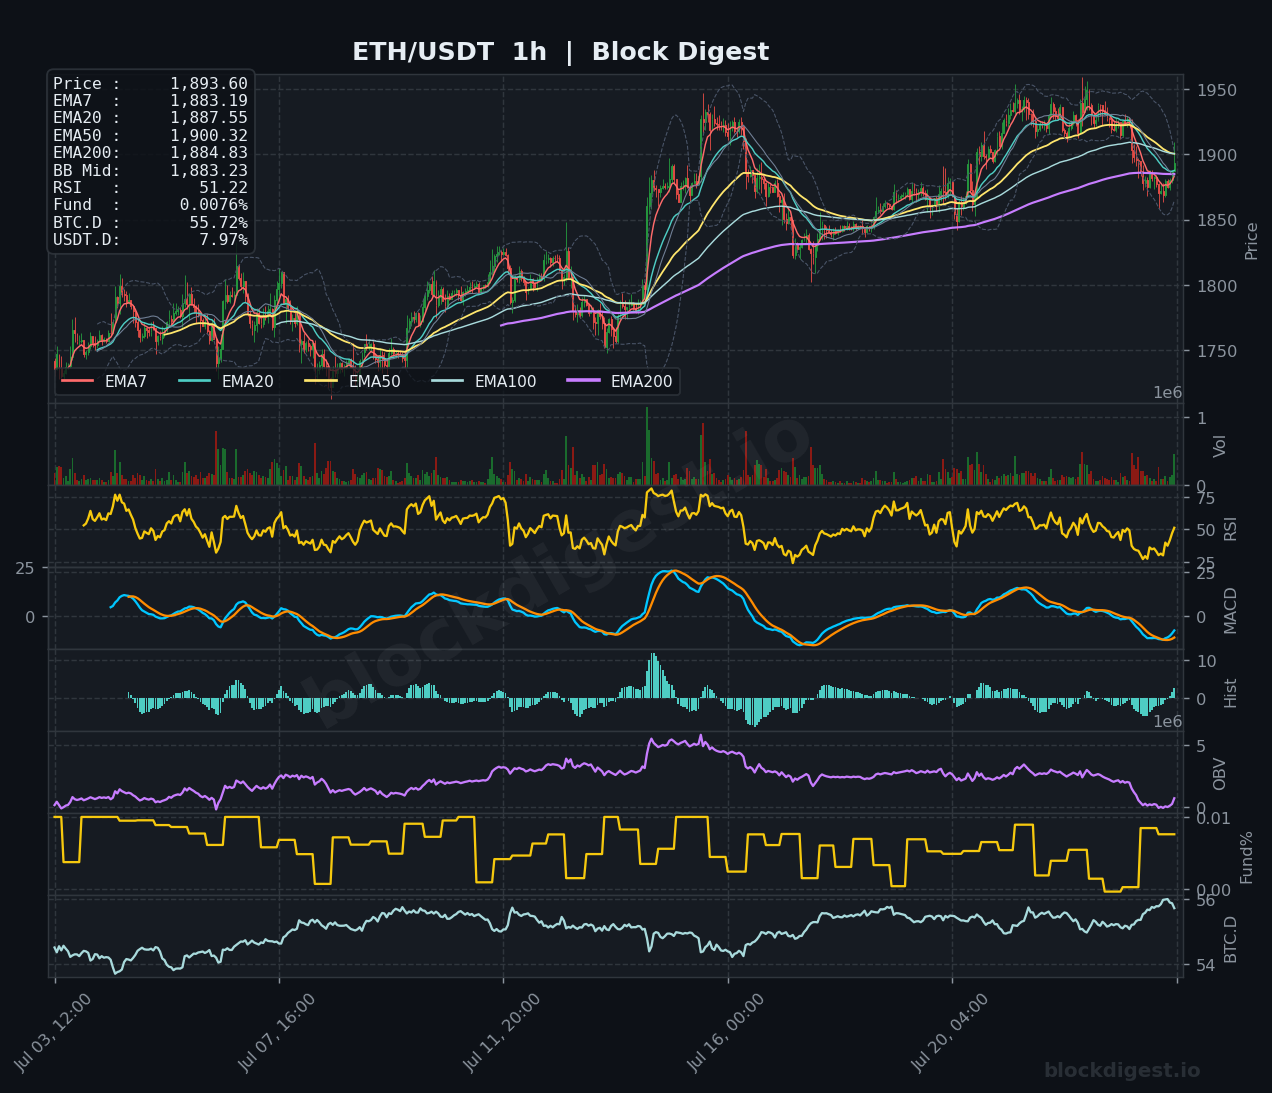
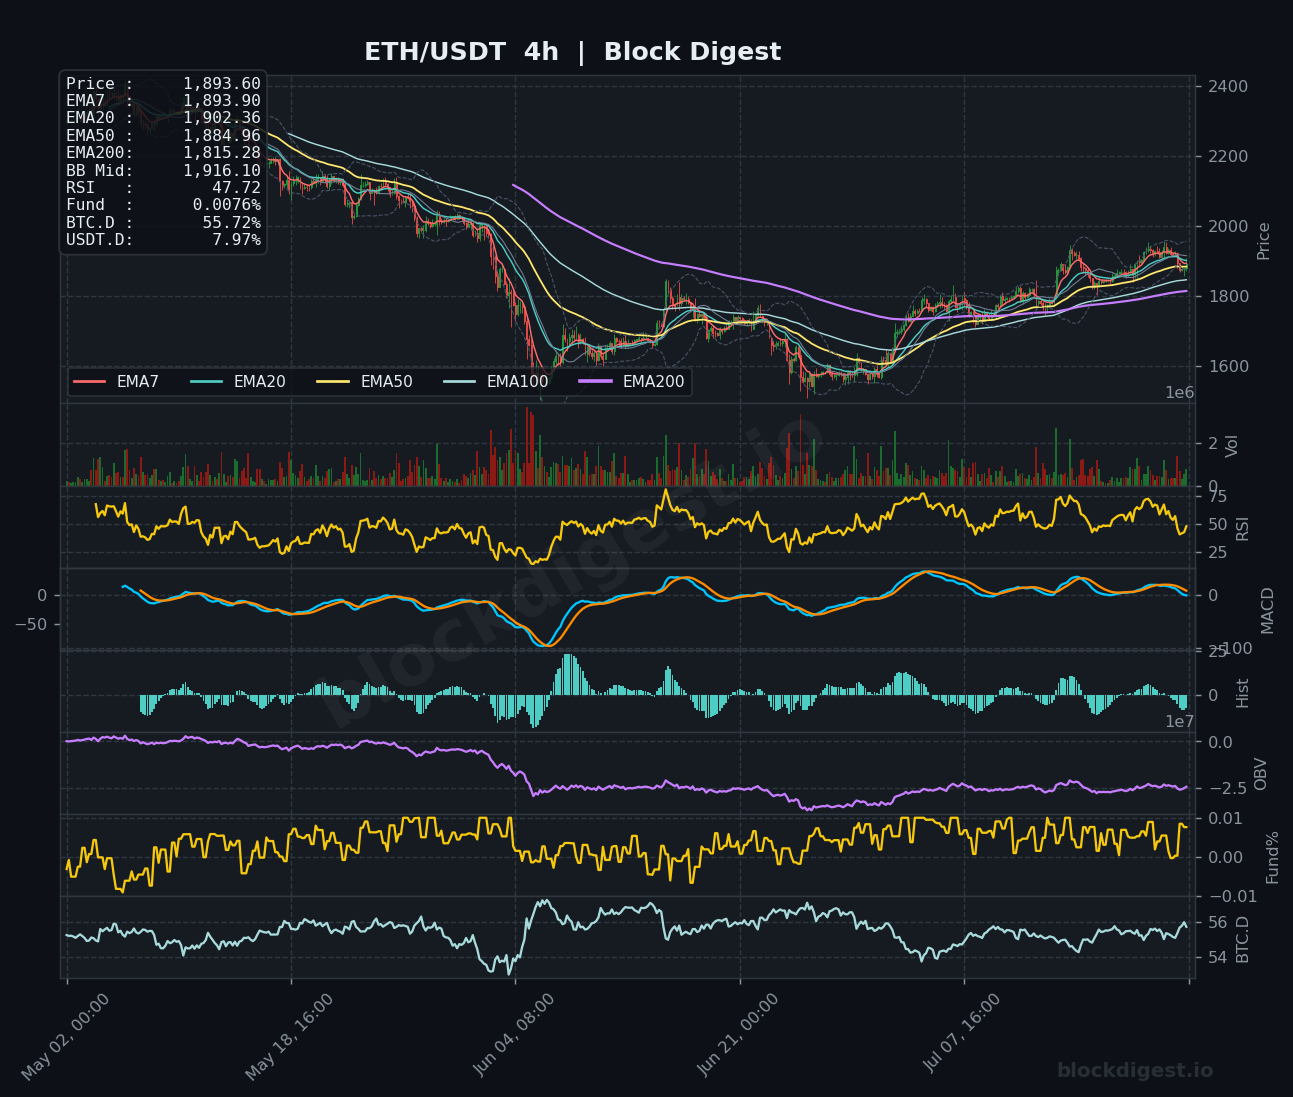
The 1-hour chart shows price hovering around $1,893.60 with the short-term EMAs (EMA7 at $1,883.19, EMA20 at $1,887.55) compressed tightly beneath price, reflecting a brief consolidation after a sharp pullback from the recent $1,950 highs. On the 4-hour timeframe, price has pulled back below the EMA20 ($1,902.36) and BB midline ($1,916.10), which now act as immediate overhead resistance — the 4H EMA50 at $1,884.96 is providing near-term support and aligning closely with the 1H EMA cluster. The daily chart confirms the broader recovery trend is intact, with the short-term EMAs fanning upward beneath price, though the 4H RSI cooling to 47.72 and the 1H RSI at 51.22 both suggest momentum is neutral-to-cautious, creating a mild divergence against the still-rising daily RSI at 58.41.
Key Levels to Watch
- Resistance: $1,916 — the 4H Bollinger Band midline and a recently lost intraday pivot that must be reclaimed to restore short-term bullish structure
- Resistance: $1,950–$1,960 — the recent swing high where price encountered significant selling pressure; a clean break here opens the path toward $2,000
- Resistance: $2,181 — the daily EMA200, the dominant macro resistance level that has capped price throughout the recovery and defines the true bearish-to-bullish regime shift
- Support: $1,884–$1,890 — confluence of the 4H EMA50, 1H EMA7, and 1H EMA200 ($1,884.83); a cluster that has absorbed recent selling
- Support: $1,841–$1,840 — daily EMA20 and BB midline, the line in the sand for the broader recovery; a daily close below here would meaningfully deteriorate the structure
- Support: $1,750–$1,760 — the prior consolidation base and a structural demand zone from the bottoming process; last resort support before retesting cycle lows
Momentum & On-Chain Signals
Block Digest’s proprietary BD Pulse score sits at a neutral 50/100, which aligns well with the mixed RSI readings seen across timeframes — the daily RSI at 58.41 is constructive but not stretched, while the shorter timeframes have cooled noticeably. The BD Extreme Index reading of +1.03σ does flag a mild overbought condition on a relative basis, which is consistent with the 4H MACD showing tightening lines near zero with a slightly negative histogram, hinting that the bullish impulse from the recent lows may be temporarily exhausted. On-chain OBV on the 1H chart has turned sharply lower in the most recent sessions, corroborating the distribution pressure seen at the $1,950 highs and warning that short-term sellers are becoming more active. The funding rate of +0.0076% is slightly positive but not alarmingly elevated, suggesting the derivatives market isn’t yet overleveraged to the long side.
BTC Dominance & Market Sentiment
Bitcoin dominance sits at 55.76% — elevated and still trending upward on the daily chart — which historically compresses altcoin performance and limits ETH’s ability to outperform on a relative basis. USDT dominance at 7.97% remains in a range that reflects cautious risk appetite without outright panic, but the lack of a decisive decline in USDT.D suggests capital is not aggressively rotating into altcoins. For ETH specifically, sustained BTC dominance above 55% creates a headwind; a meaningful ETH rally likely requires either a BTC-led market advance or a rotation out of Bitcoin — neither of which appears imminent based on current structure.
Risk Scenarios
- Bullish case: A reclaim and hold of the $1,916 4H BB midline, followed by a high-volume push above $1,950, would signal resumption of the recovery trend and open a measured target toward $2,050–$2,100. Institutional accumulation narratives — such as Bitmine’s continued ETH treasury expansion toward 5% of total supply — could serve as a fundamental catalyst if broader market sentiment stabilizes.
- Bearish case: Failure to hold the $1,884–$1,890 EMA cluster on the 4H would expose the $1,841 daily EMA20, and a daily close below that level would invalidate the short-term recovery thesis, with downside targets reopening toward $1,750 and potentially lower. A deterioration in BTC sentiment or additional DeFi security incidents — echoing the recent $1.65M Allbridge flash loan attack — could accelerate risk-off flows.
Outlook
ETH’s setup as of July 24 is best described as a consolidation at a decision point — the recovery structure from the cycle lows remains technically intact, but price is wrestling with overhead resistance after a strong run that has left the shorter timeframes mildly overbought. The next 24–48 hours are likely to be pivotal: bulls need to recapture $1,916 on the 4H with volume to reassert control, while a break below $1,840 on a daily close would shift the near-term bias firmly back to bearish. The BD Pulse neutral reading of 50/100 reflects this equilibrium accurately — this is not a moment for aggressive directional bets in either direction. The long/short account ratio of 1.48 (59.6% longs) suggests the market is leaning bullish, which, combined with the mild overbought signal, creates asymmetric risk to the downside if key support levels fail.
—
Disclaimer: This analysis is for informational purposes only and does not constitute financial advice. Cryptocurrency markets are highly volatile and unpredictable. All trading decisions should be made based on your own research and risk tolerance. Block Digest is not responsible for any financial losses incurred as a result of acting on this content.