BTC Daily Analysis — 2026-07-26 (Full Archive)
Market Overview
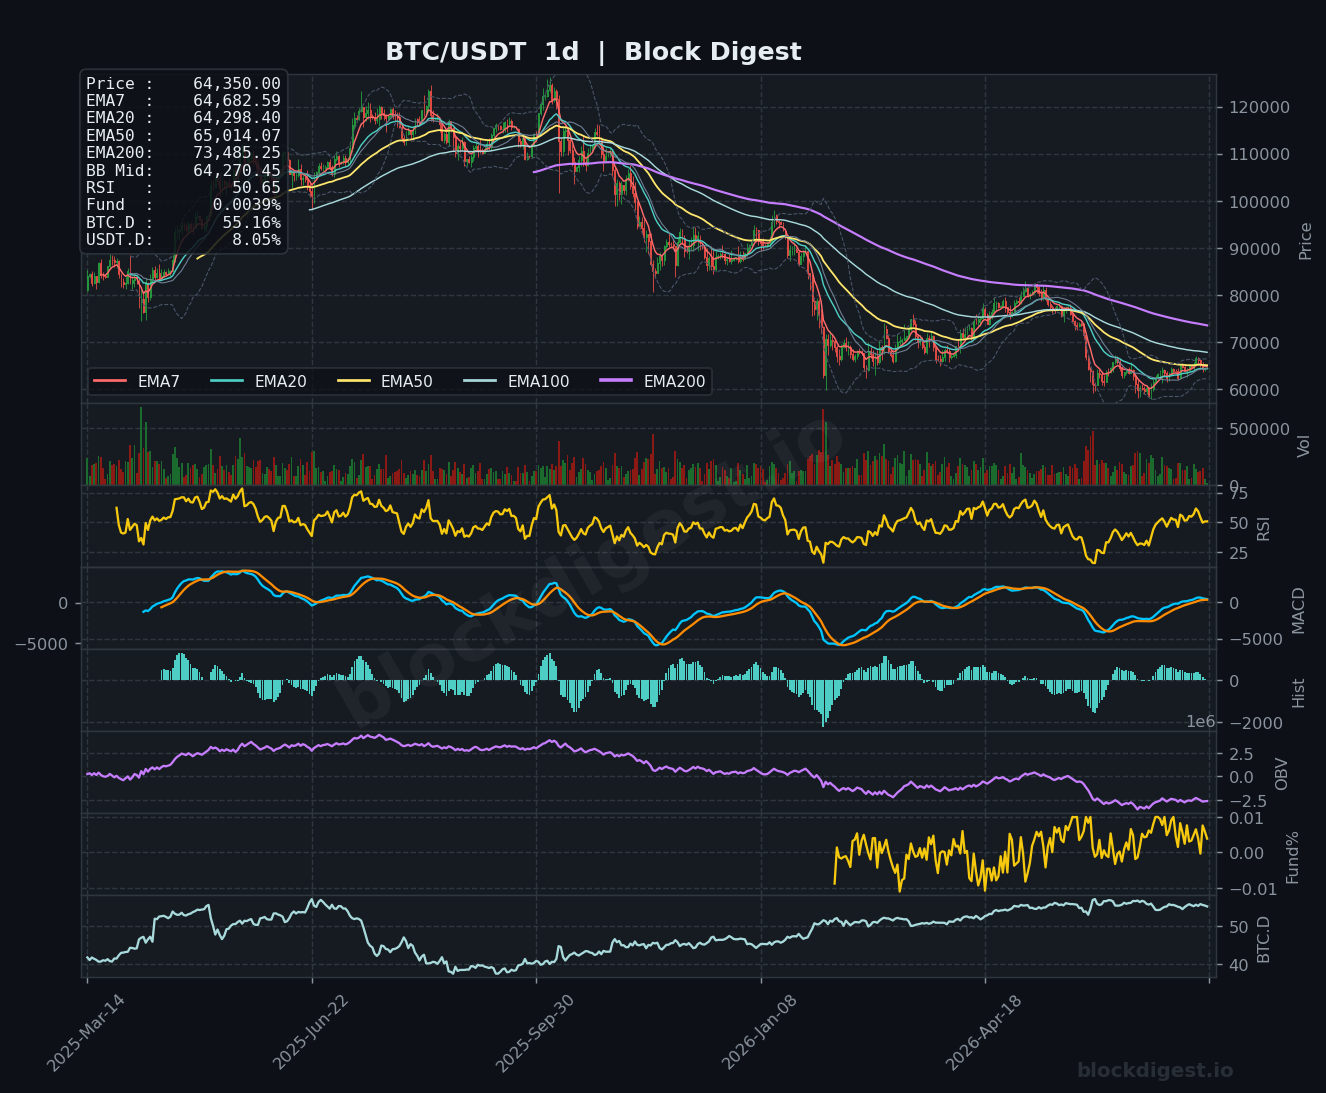
Bitcoin is trading at approximately $64,350 following a 2.49% pullback over the past 24 hours, with price hovering just below several converging short-term EMAs on the daily chart. On the 1D timeframe, BTC remains significantly below the EMA200 at $73,485, confirming the macro downtrend that has been in place since late 2025. However, price has reclaimed the daily EMA20 ($64,298) and is testing the EMA50 ($65,014) from below — a critical battleground that will likely define near-term direction. The daily Bollinger Band midline sits at $64,270, and price is currently straddling it, reflecting the indecision baked into this consolidation range.
Multi-Timeframe Confluence
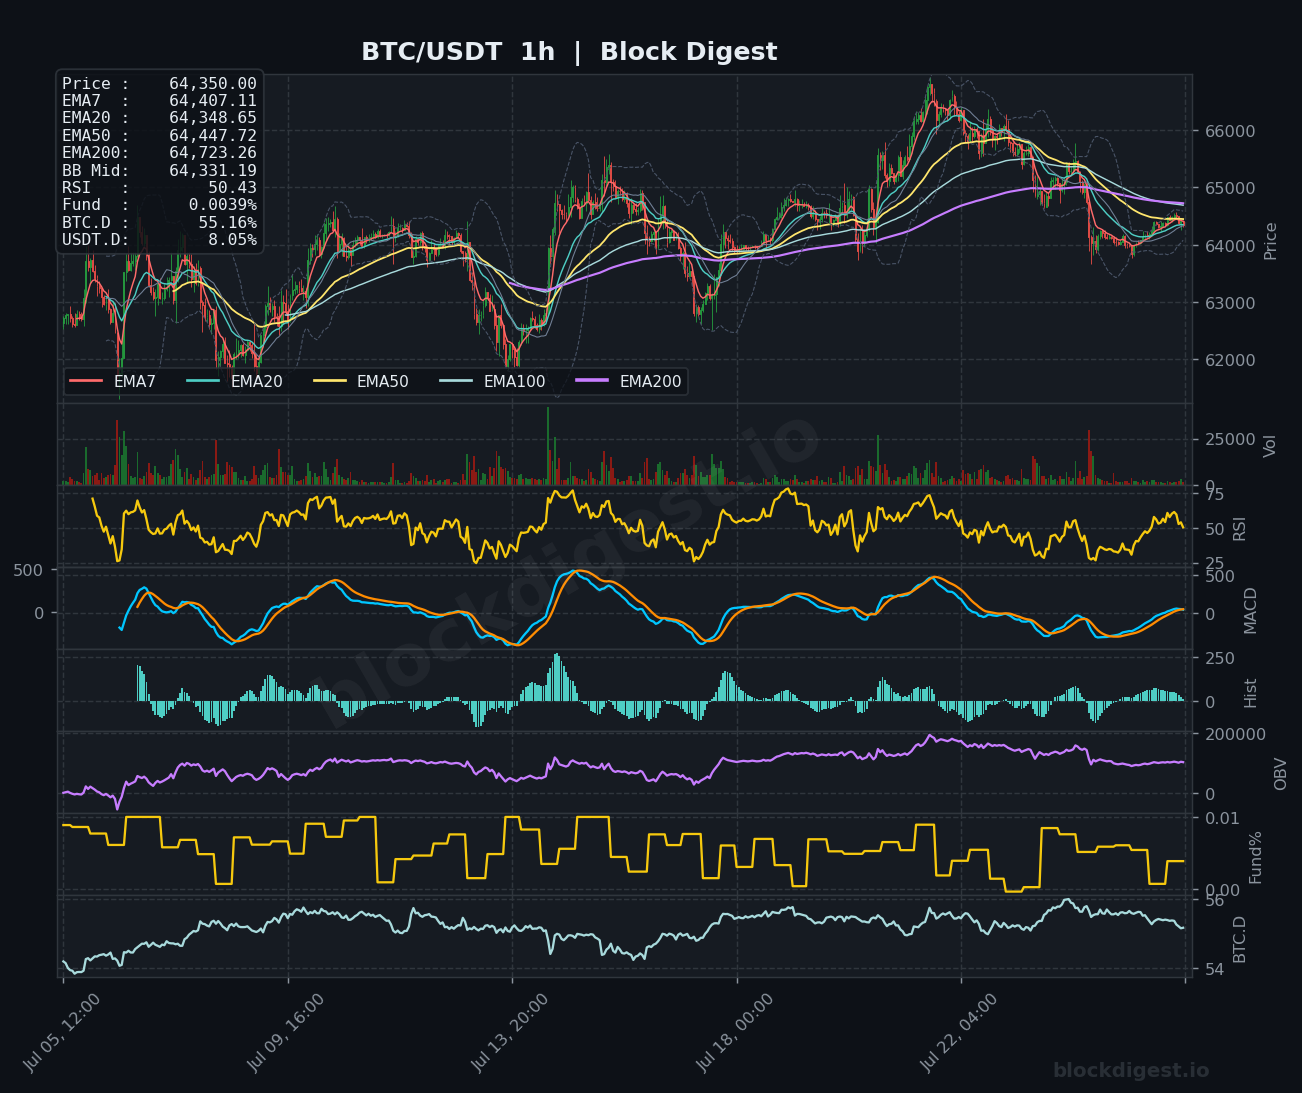
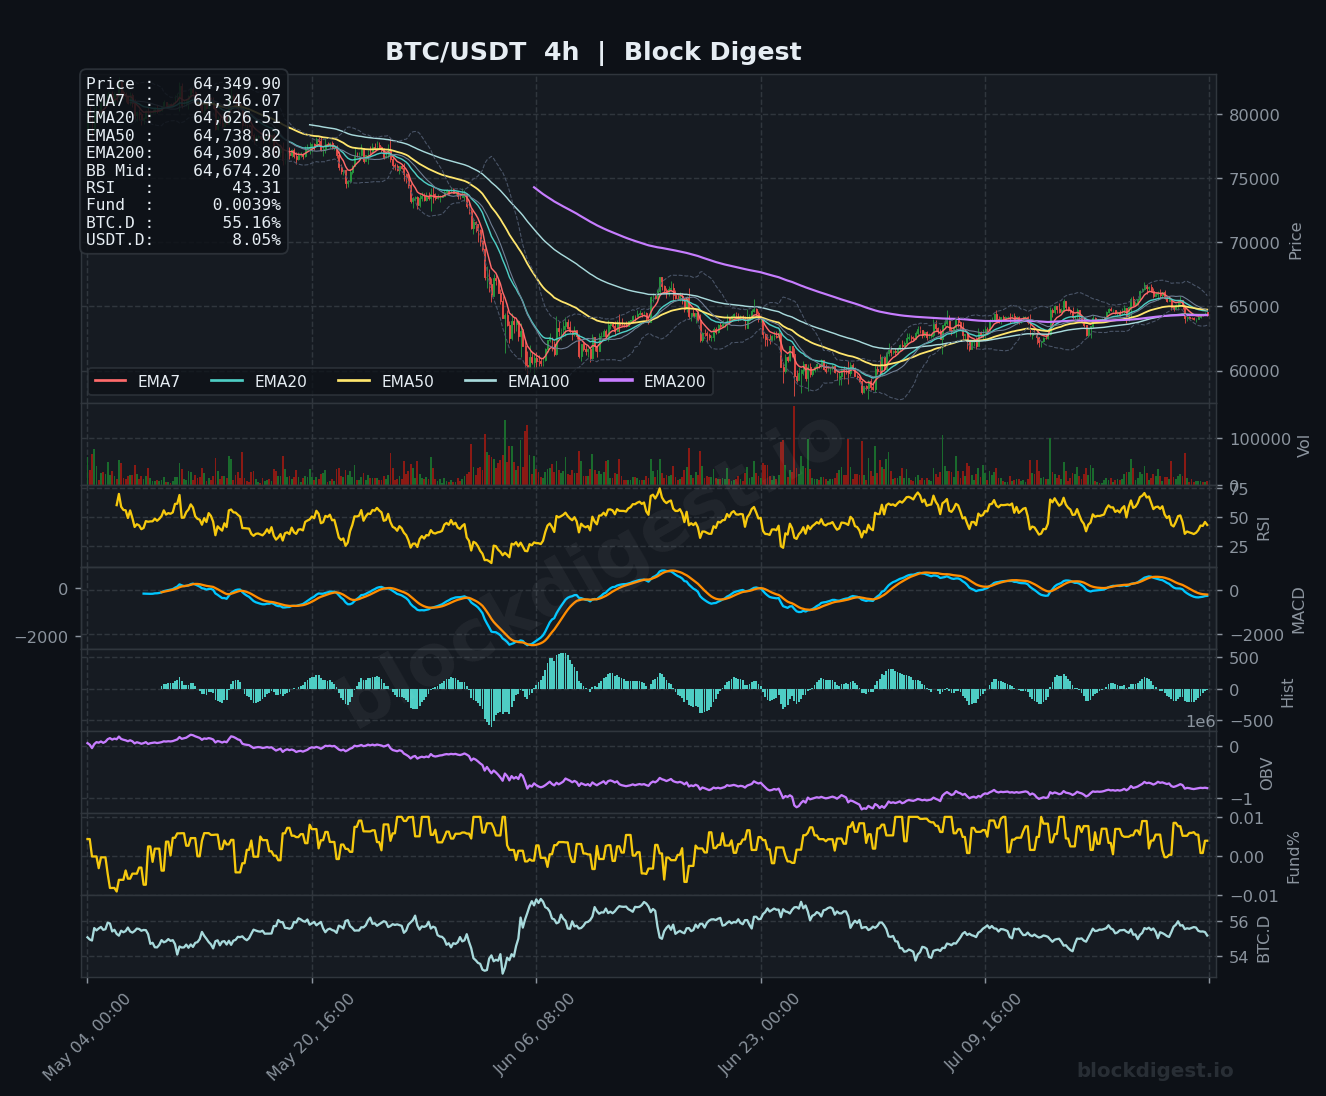
On the 1H chart, price is coiled tightly around the EMA7 ($64,407), EMA20 ($64,348), and EMA50 ($64,447), with all three compressed within a ~100-point band — a classic pre-breakout squeeze. The 4H chart tells a more cautious story: price remains below the EMA20 ($64,626) and EMA50 ($64,738), with the overall EMA stack still in bearish alignment following the significant June selloff. The daily and 4H frames are broadly aligned in suggesting a recovery attempt that has stalled, while the 1H shows short-term neutrality with no clear directional edge. The $64,300–$64,750 zone represents a dense confluence of EMA resistance across all three timeframes that bulls must decisively clear to shift momentum.
Key Levels to Watch
- Resistance: $64,738 — 4H EMA50, the immediate ceiling capping the current bounce; $65,014 — daily EMA50, a major structural resistance that has rejected price repeatedly; $66,000 — psychological round number and approximate recent swing high visible on the 1H chart
- Support: $64,270 — daily Bollinger Band midline and 4H EMA200 ($64,309), a layered support cluster directly beneath current price; $63,000 — psychological and structural support level that held during recent intraday dips; $61,500–$62,000 — prior swing low and lower Bollinger Band boundary on the 4H, the last meaningful defense before a deeper retest
Momentum & On-Chain Signals
Our BD Pulse Score sits at 47/100, squarely in neutral territory, which aligns precisely with what the charts are showing: neither buyers nor sellers have seized control. The 1H RSI reads 50.43 and the daily RSI 50.65, both pinned at the midline — a setup that often resolves with a sharp directional move once a catalyst emerges. The 4H MACD lines remain in slight negative territory with a flat histogram, suggesting the bounce from June lows has lost upside momentum without yet rolling into fresh bearish expansion. On the OBV front, the 1H OBV trend score of +1 from BD Pulse indicates modest accumulation pressure at current levels, though the 4H OBV remains in a broader downtrend — a divergence worth monitoring for signs of smart money positioning.
BTC Dominance & Market Sentiment
BTC dominance holds at 55.16%, a relatively elevated level that continues to signal capital consolidation into Bitcoin rather than rotation into altcoins — a defensive posture typical of uncertain macro environments. USDT.D at 8.05% reflects a still-meaningful stablecoin allocation on the sidelines, which could fuel a relief rally if risk appetite returns but equally suggests investors remain cautious. The slide in U.S. chip stocks, including Micron’s 9% single-day drop, is contributing to broader risk-off sentiment that is weighing on BTC’s ability to sustain upside momentum above key resistance.
Risk Scenarios
- Bullish case: A decisive 4H close above $64,738 (4H EMA50) followed by a daily close above $65,014 (daily EMA50) would signal trend recovery, opening a path toward $66,000 and potentially $67,500 on continued volume. This scenario gains further conviction if BTC dominance holds above 55% while macro equity sentiment stabilizes.
- Bearish case: A breakdown below the $64,270–$64,309 support cluster (daily BB mid / 4H EMA200) with elevated volume would invalidate the current recovery structure, targeting $63,000 first and $61,500–$62,000 on a sustained flush. Deteriorating macro conditions — particularly further weakness in tech equities — could accelerate this move.
Outlook
The overall setup is one of compressed, high-stakes neutrality: Bitcoin sits at a convergence of EMAs across all timeframes with momentum indicators pinned at equilibrium. The next 24–48 hours are critical — a clean break above $65,014 on the daily would materially improve the short-to-medium term outlook, while failure to hold $64,270 would hand bears the initiative ahead of the weekend. The macro headwind from the U.S. chip sector selloff adds a layer of uncertainty that traders should price into position sizing. Until one of these levels is resolved with conviction and volume, range-bound chop between $63,000 and $65,500 remains the most probable near-term scenario.
—
Disclaimer: This analysis is for informational purposes only and does not constitute financial advice. Cryptocurrency markets are highly volatile and unpredictable. All trading decisions should be made based on your own research and risk tolerance. Block Digest is not responsible for any financial losses incurred as a result of acting on this content.