Market Overview
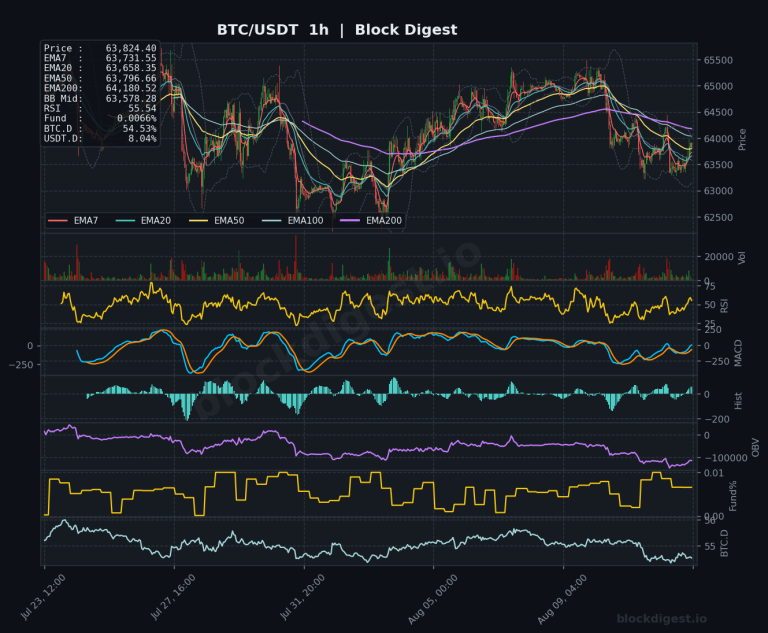
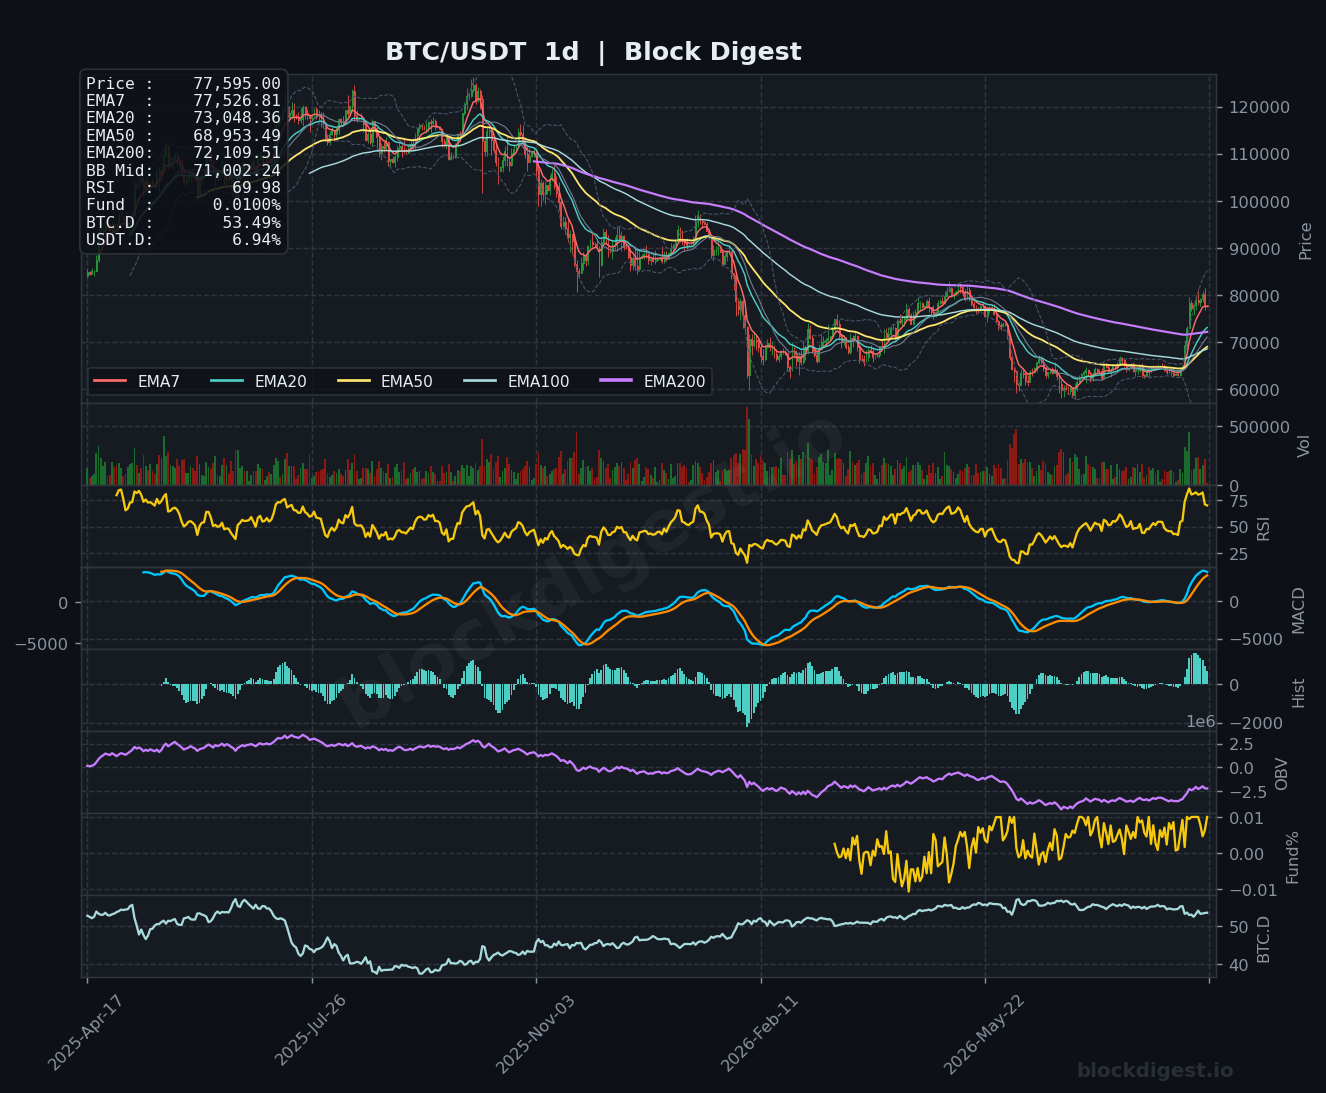
Bitcoin is currently navigating a critical consolidation phase, trading at $77,595 after a period of aggressive expansion. On the daily timeframe, the asset remains firmly above its key EMAs, with the price holding well above the 200-day EMA of $72,109, signaling a dominant bullish structure. While the price is currently testing the mid-range of the daily Bollinger Bands, the overall trend remains constructive as long as the immediate support clusters hold against short-term volatility.
Multi-Timeframe Confluence
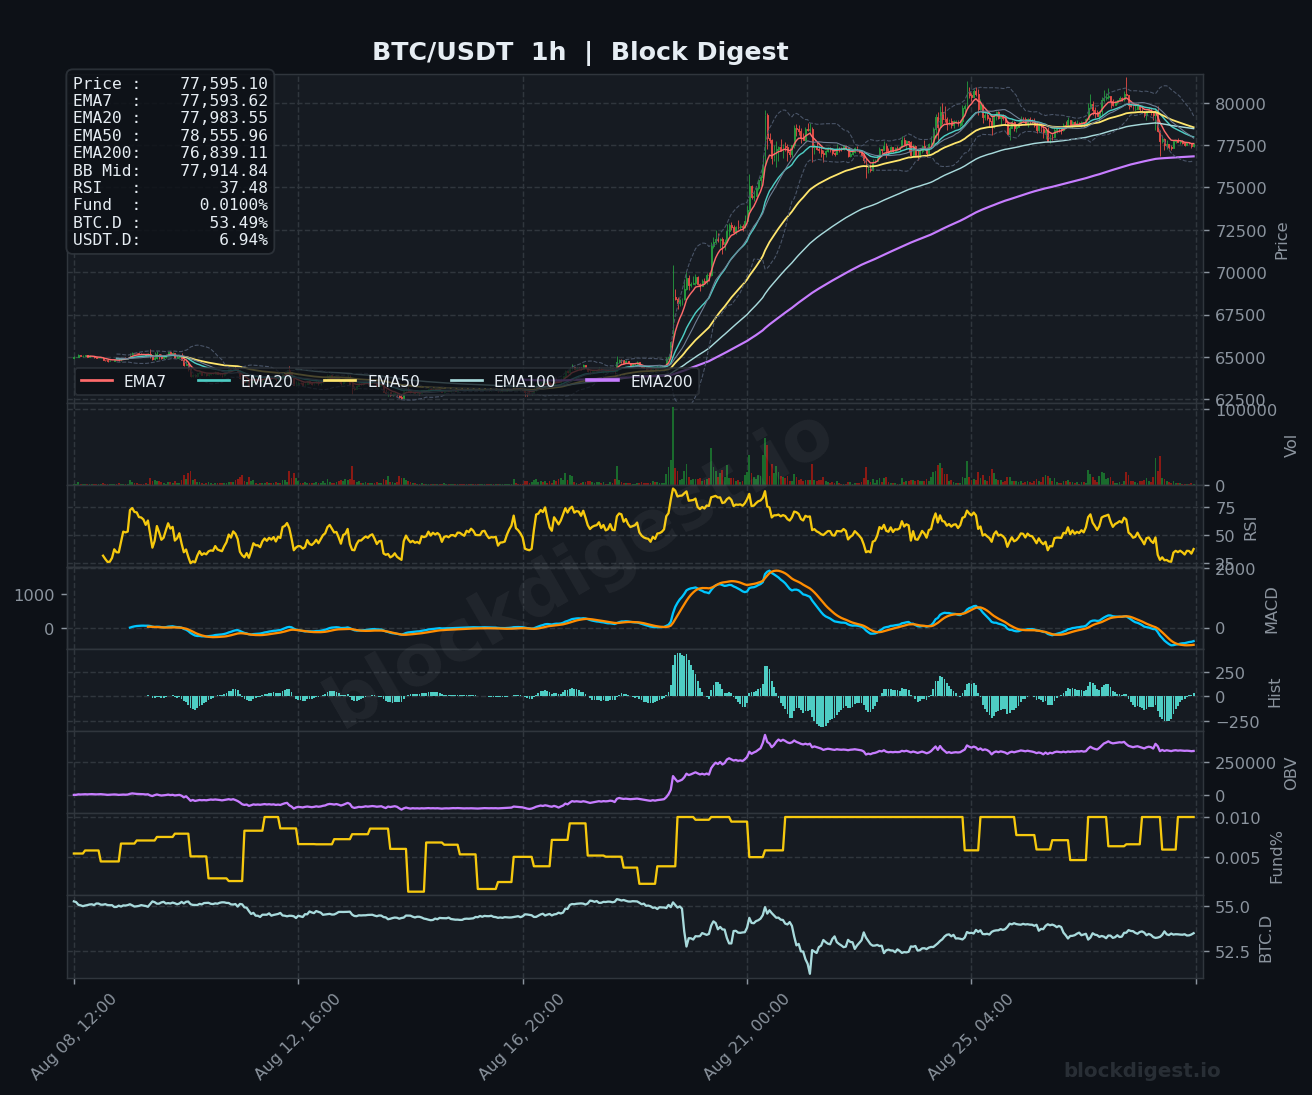
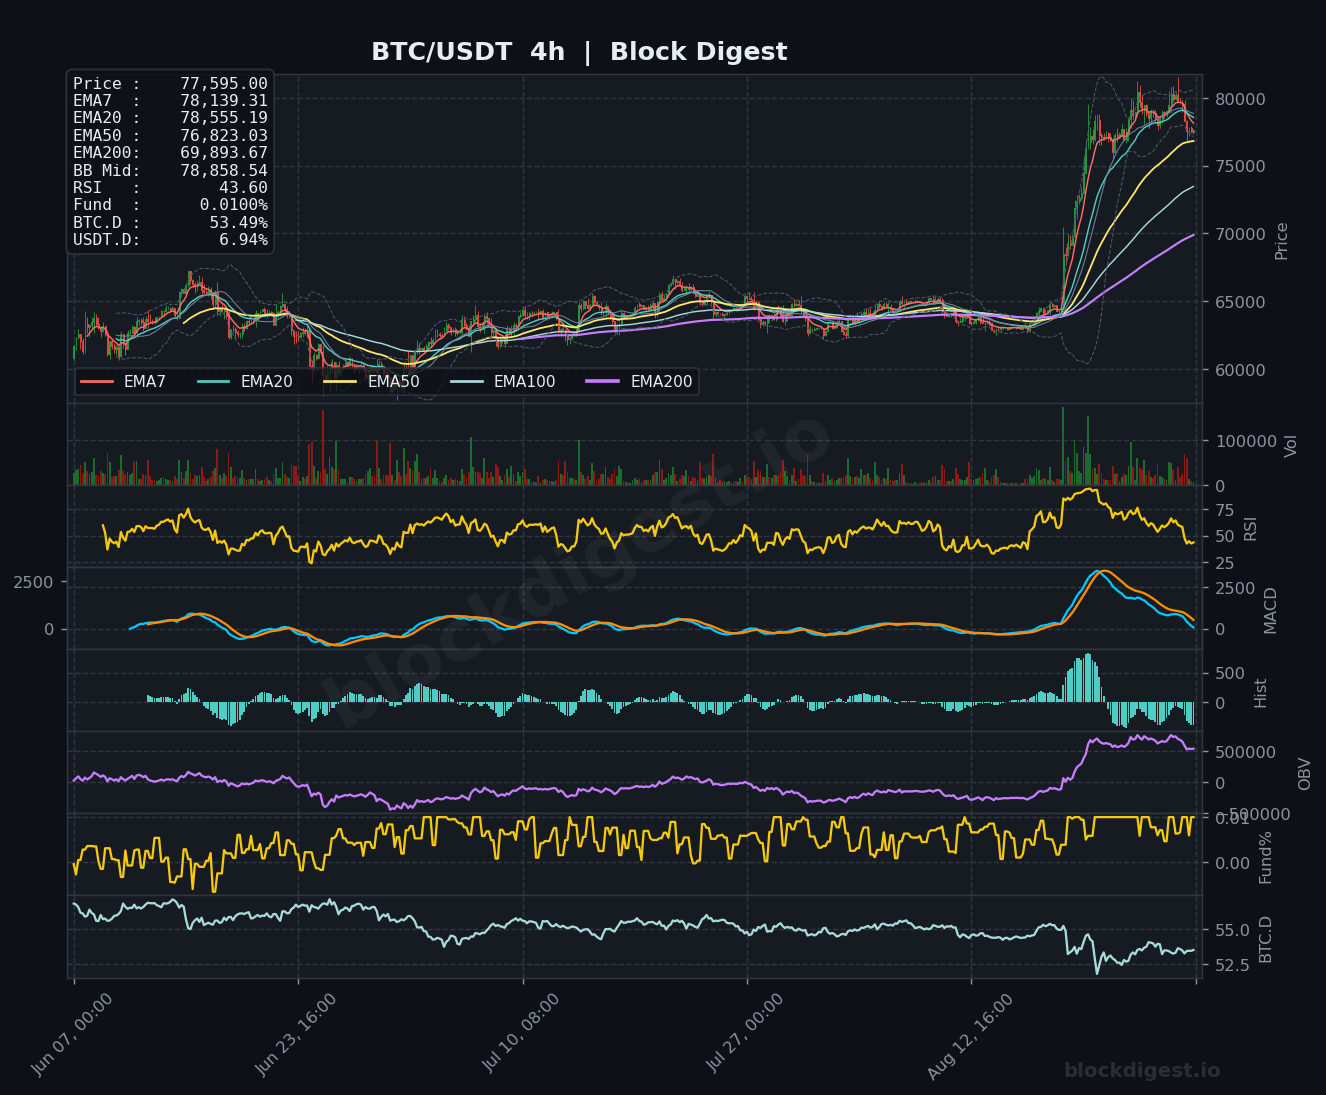
The confluence across timeframes reveals a tug-of-war between short-term cooling and long-term strength. While the 1d timeframe shows a robust uptrend with the price comfortably above the EMA7 ($77,526), the 1h and 4h charts indicate a localized pullback, with the price currently hovering just below the 4h EMA20 of $78,555. This suggests that while the macro trend is intact, the market is currently digesting recent gains, with the 1h EMA200 acting as a vital safety net at $76,839 to prevent a deeper retracement.
Key Levels to Watch
- Resistance:
- $79,221: The 1h Bollinger Band upper boundary, representing the immediate ceiling for current momentum.
- $80,591: The 4h Bollinger Band upper limit, serving as the primary hurdle for a trend continuation.
- $85,103: The daily Bollinger Band upper band, marking the major structural resistance for the current cycle.
- Support:
- $77,125: The 4h Bollinger Band lower support, which must hold to prevent a slide toward the 1h EMA200.
- $76,839: The 1h EMA200; a critical level that, if lost, would signal a shift in short-term sentiment.
- $76,607: The 1h Bollinger Band lower boundary, providing the final line of defense for immediate consolidation.
Momentum & On-Chain Signals
Momentum indicators are currently flashing mixed signals, reflecting the “overbought” status of the market. Our proprietary BD Extreme Index currently sits at +1.64σ, confirming that the market is in an overextended state, which aligns with the daily RSI reading of 69.98, nearing the traditional threshold for exhaustion. Despite this, the BD Pulse Score remains a healthy 67/100, suggesting that underlying demand remains resilient. The funding rate remains stable at +0.0086%, indicating that leverage is not yet excessively skewed, though the Long/Short Account Ratio of 1.17 shows a slight preference for long positioning that bears watching should the price dip toward the $76,800 support zone.
BTC Dominance & Market Sentiment
BTC Dominance stands at 53.49%, maintaining its position as the primary driver of market liquidity. With USDT dominance at 6.94%, the market is showing a balanced risk appetite, where capital is being rotated into BTC rather than fleeing to stablecoin sidelines, suggesting that the current consolidation is a healthy pause rather than a distribution event.
Risk Scenarios
- Bullish case: A decisive hourly close above $78,555 would invalidate the current bearish divergence and likely trigger a retest of the $80,000 psychological barrier.
- Bearish case: A breakdown below the $76,839 support level would likely invite further selling pressure, potentially testing the $73,000 zone where the daily EMA20 resides.
Outlook
Our directional bias remains cautiously bullish, provided the $76,800 support cluster holds during the next 24-48 hours. The market is currently in a “cool-down” phase, and traders should watch for a potential MACD bullish crossover on the 4h timeframe as a trigger for renewed upside. If the price fails to reclaim the 4h EMA20, we anticipate a deeper consolidation toward the $73,000 level before any further structural moves are realized.
Disclaimer: This analysis is for informational purposes only and does not constitute financial advice. Cryptocurrency markets are highly volatile and unpredictable. All trading decisions should be made based on your own research and risk tolerance. Block Digest is not responsible for any financial losses incurred as a result of acting on this content.
Stay Ahead of the Market
Follow BlockDigest for crypto market intelligence, research and real-time updates.