
Market Overview
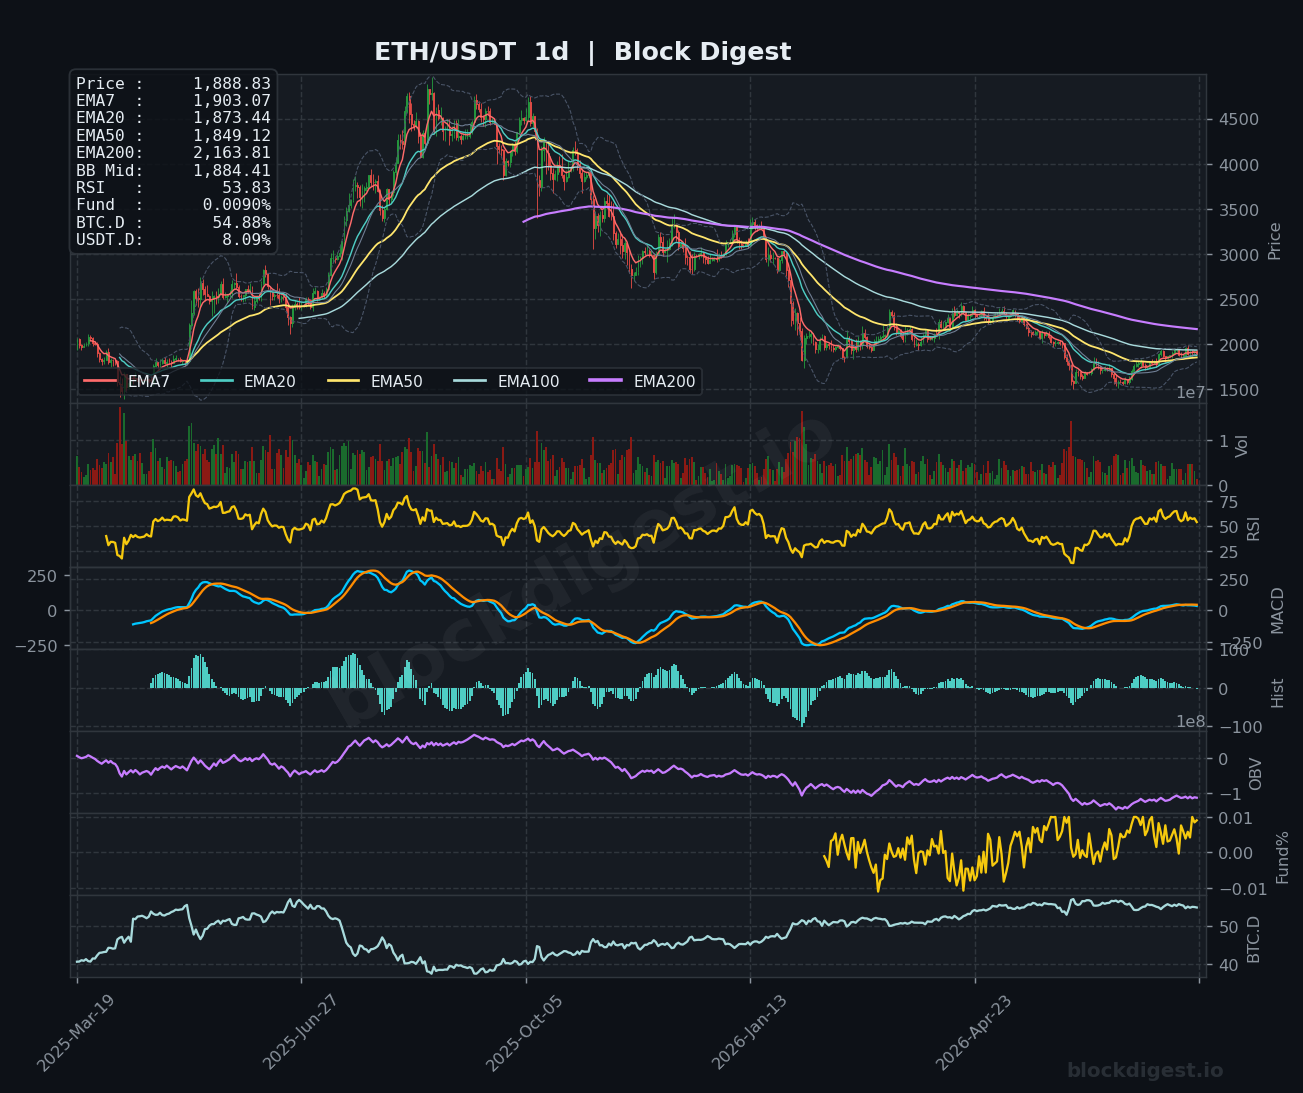
Ethereum is trading at $1,888.83 as of July 31, 2026, sitting just below a tight cluster of short-term EMAs on the daily chart — the EMA7 at $1,903.07, EMA20 at $1,873.44, and EMA50 at $1,849.12. Price is hovering marginally below the Bollinger Band midline of $1,884.41, a level that has acted as a near-term pivot zone. The dominant daily trend remains cautiously constructive off the multi-month lows seen earlier in 2026, though the looming EMA200 at $2,163.81 continues to cast a long bearish shadow over the broader structure, keeping ETH in a technically challenged recovery phase.
Multi-Timeframe Confluence
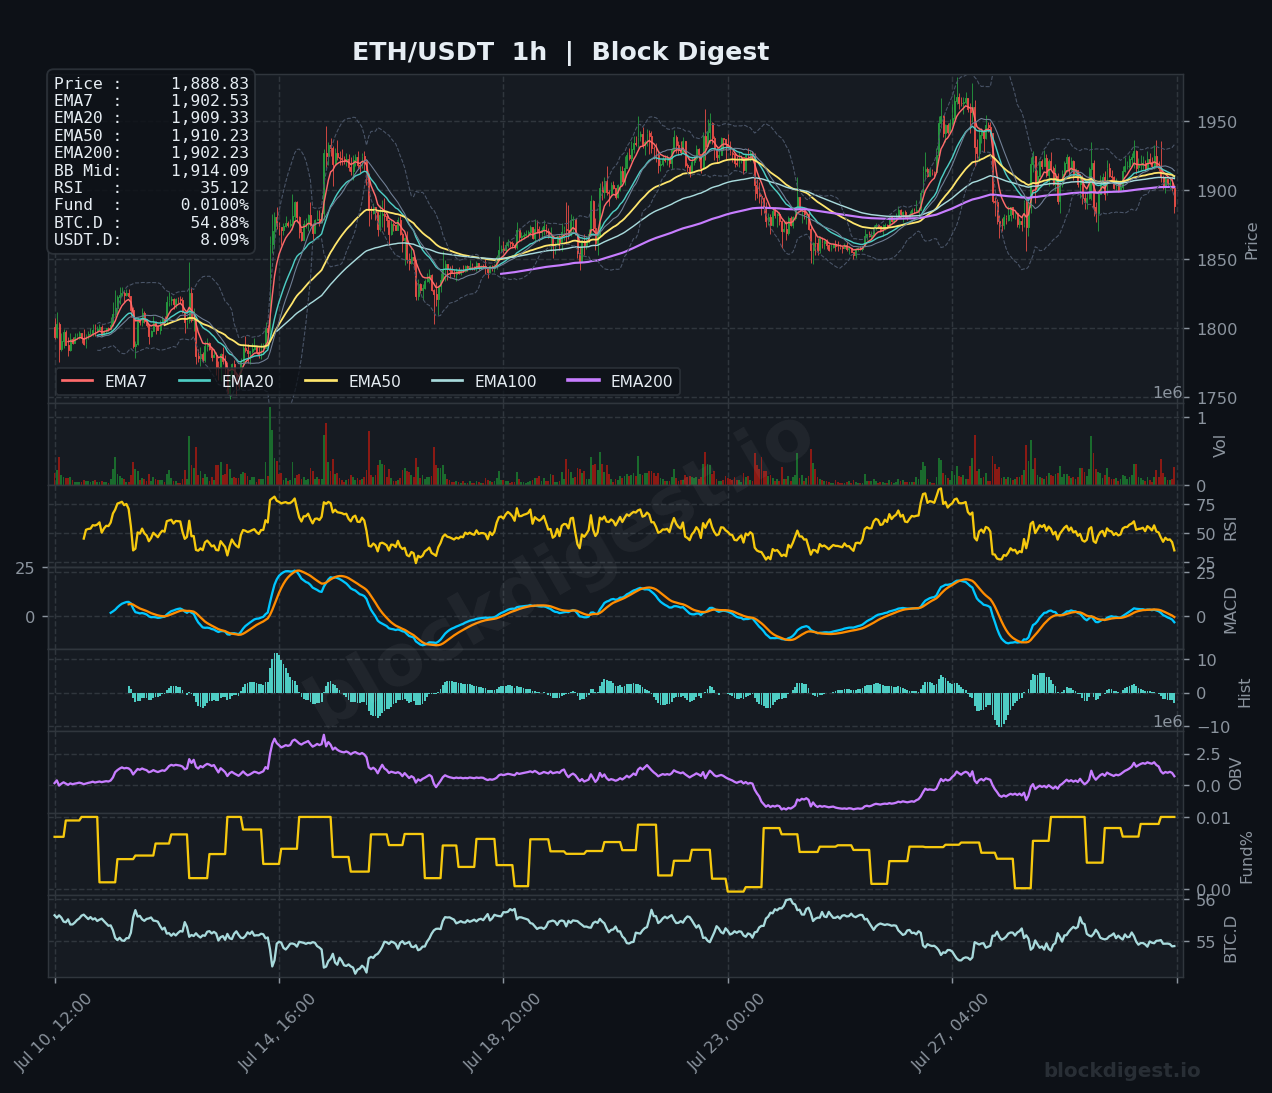
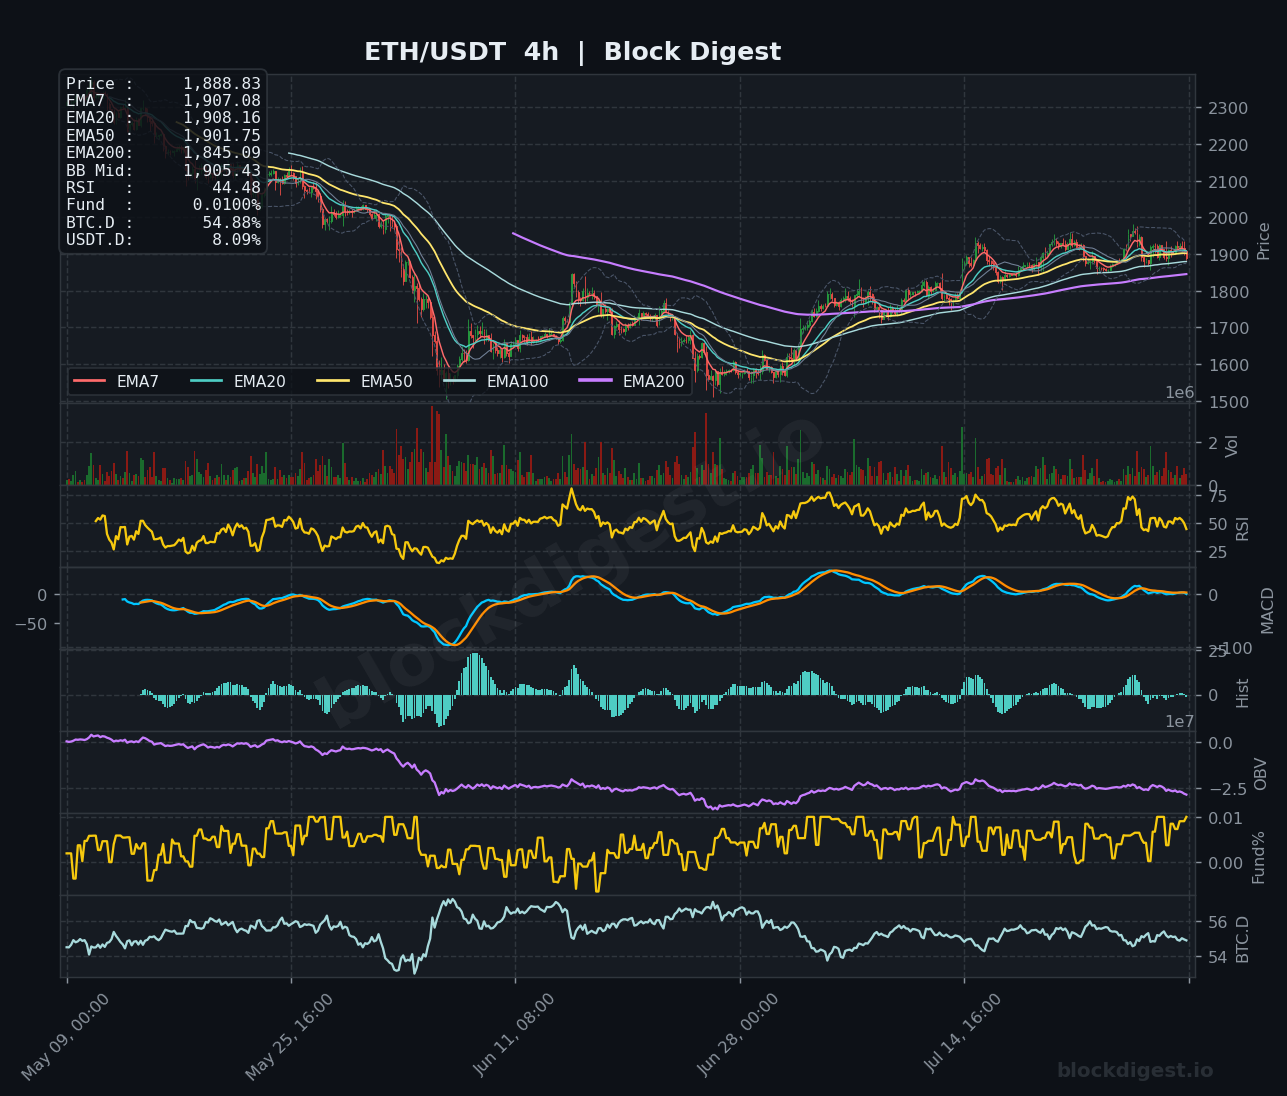
On the 1-hour chart, price has slipped back beneath all key EMAs (EMA7: $1,902.53, EMA20: $1,909.33, EMA50: $1,910.23), signaling near-term weakness after a failed attempt to sustain above the $1,910–$1,920 zone. The 4-hour chart tells a similar story — price is below the EMA7 ($1,907.08) and EMA20 ($1,908.16), though it remains decisively above the 4h EMA200 ($1,845.09), which is a meaningful distinction and speaks to the intermediate recovery structure holding. The daily timeframe provides the most constructive read, with EMAs stacked in a budding bullish sequence below price (EMA20 > EMA50 > EMA100), though confluent resistance in the $1,900–$1,920 band is proving sticky and must be resolved for the recovery thesis to advance.
Key Levels to Watch
- Resistance: $1,910–$1,914 — dense EMA cluster on the 1h timeframe (EMA20, EMA50, and BB Mid), representing the immediate ceiling that capped the most recent bounce
- Resistance: $1,950–$1,960 — recent swing high visible on the 1h chart where sellers re-emerged aggressively; a close above here would materially shift short-term momentum
- Resistance: $2,080 — widely cited technical ceiling per current market context; aligns with the EMA100 on higher timeframes and would be the key test for any sustained recovery toward the EMA200
- Support: $1,873–$1,875 — daily EMA20, which has been providing dynamic support; a daily close below this level would weaken the near-term bullish structure
- Support: $1,845–$1,850 — daily EMA50 and the 4h EMA200 zone; this is a critical structural floor — losing it would open the door to a more significant retracement
- Support: $1,780–$1,800 — prior consolidation base and psychological level; failure at $1,845 would likely see price gravitate toward this demand zone
Momentum & On-Chain Signals
The RSI picture is mixed across timeframes: the 1h RSI has cooled sharply to 35.12, entering near-oversold territory on the short-term frame, while the 4h RSI sits at 44.48 — below the midline but not yet at extremes. Importantly, the daily RSI at 53.83 remains in constructive territory above 50, suggesting that the broader recovery momentum has not broken down despite near-term pressure. Our BD Pulse Score of 45/100 — sitting in neutral territory — aligns with this mixed picture; while the setup is not overtly bearish, it lacks the conviction to call a decisive bullish breakout just yet. On the MACD front, both the 1h and 4h lines are converging toward the zero line with declining histogram momentum, suggesting near-term bearish pressure, while the daily MACD continues to inch positively above zero — a constructive signal on the macro frame. The BD Pulse’s OBV Trend reading of +1 (mildly positive accumulation) is worth noting — it suggests underlying buying pressure hasn’t fully capitulated despite the price pullback.
BTC Dominance & Market Sentiment
BTC dominance stands at 54.91% per our BD Pulse data, which is corroborated by the 54.88% reading visible across all three chart timeframes, and remains elevated — a headwind for ETH as capital continues to favor Bitcoin in the current macro environment following the Fed’s rate hold. USDT.D at 8.09% is relatively subdued, suggesting some risk appetite remains in the system, but it is not low enough to imply aggressive rotation into altcoins. Until BTC dominance shows a meaningful rollover, ETH is likely to underperform Bitcoin on a relative basis even if absolute prices grind higher.
Risk Scenarios
- Bullish case: A reclaim of the $1,910–$1,914 EMA cluster on the 1h chart, followed by a sustained 4h close above $1,950, would confirm the pullback as a healthy retest and open a path toward the $2,080 resistance level. This scenario is reinforced by the daily RSI holding above 50 and the 4h EMA200 providing a structural floor at $1,845.
- Bearish case: A break and daily close below the $1,873 EMA20 support, particularly on elevated volume, would signal a shift in the near-term recovery structure and risk exposing the $1,845–$1,850 zone. Failure there would likely accelerate selling toward the $1,780–$1,800 support band, potentially invalidating the recovery narrative built over recent weeks.
Outlook
ETH enters August 1 in a delicate position — the daily trend remains tentatively constructive, but the rejection from the $1,920–$1,950 zone and the subsequent slide back beneath the hourly EMA cluster introduces caution. The Fed’s decision to hold rates steady has provided a mild macro tailwind, but this alone is unlikely to sustain a rally without technical confirmation. The next 24–48 hours will be defined by whether bulls can defend the $1,873 daily EMA20 and stage a reclaim of the $1,910 EMA cluster; failure to do so would shift the bias decisively neutral-to-bearish in the short term. A neutral BD Pulse Score of 45 and a Long/Short Account Ratio of 1.53 (60.4% long) suggest the market is not overly positioned for either direction, leaving ETH vulnerable to a liquidity sweep before any directional resolution — watch this space closely.
—
Disclaimer: This analysis is for informational purposes only and does not constitute financial advice. Cryptocurrency markets are highly volatile and unpredictable. All trading decisions should be made based on your own research and risk tolerance. Block Digest is not responsible for any financial losses incurred as a result of acting on this content.
Stay Ahead of the Market
Follow BlockDigest for crypto market intelligence, research and real-time updates.


