
Market Overview
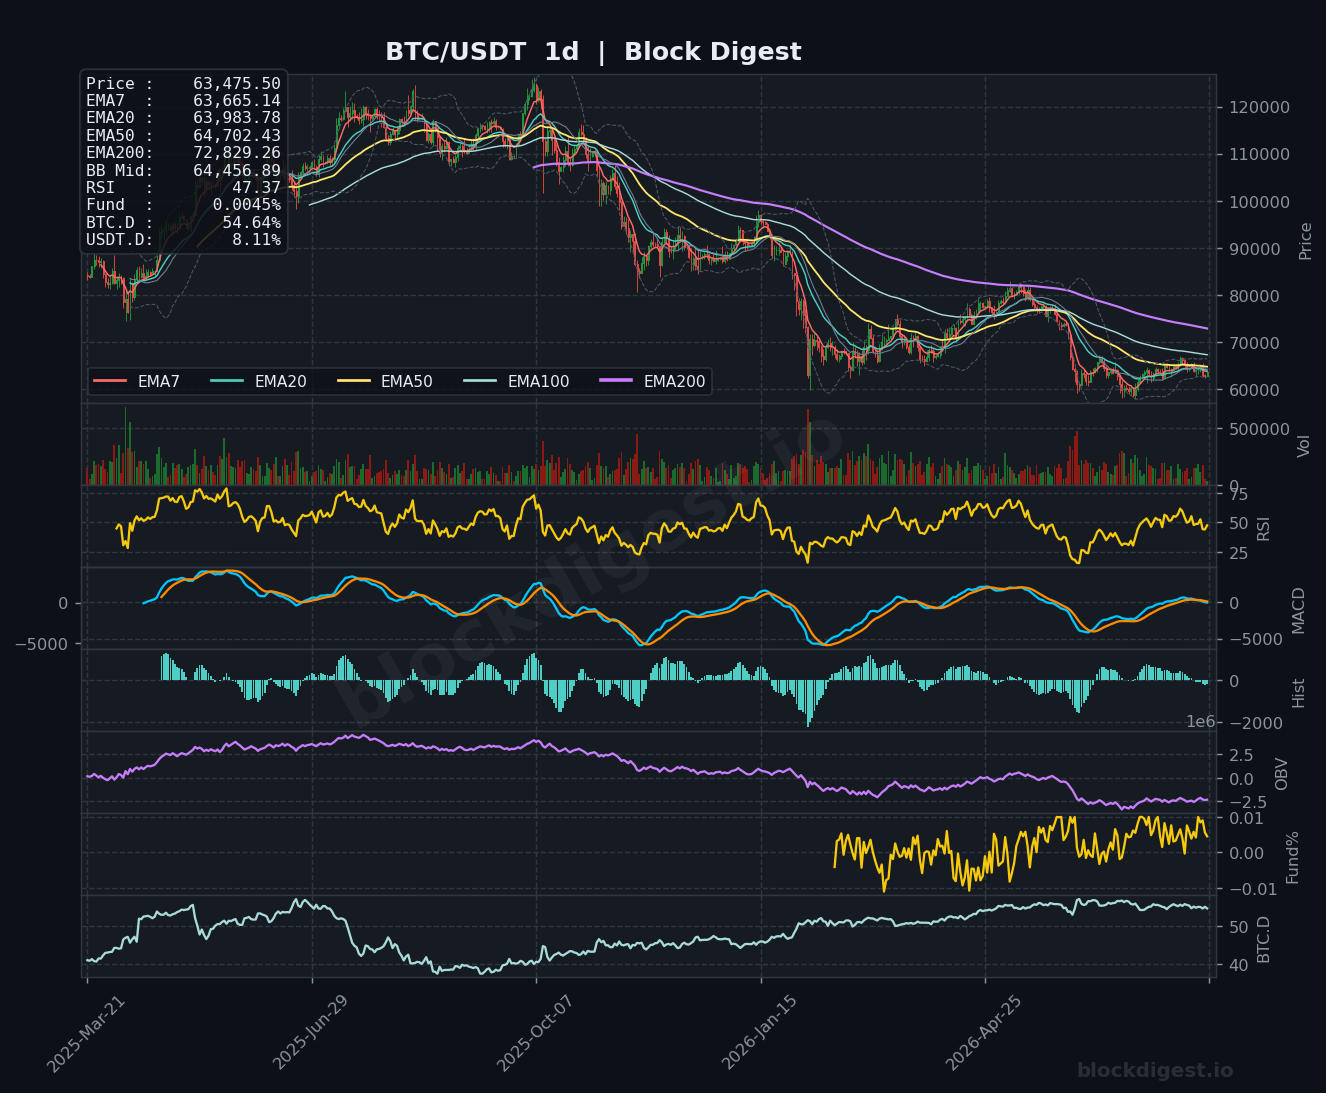
Bitcoin is trading at $63,475.50, positioned in a tentative consolidation zone after a notable drawdown from the mid-$60,000s. On the daily timeframe, price sits below its EMA7 ($63,665), EMA20 ($63,983), EMA50 ($64,702), and significantly beneath the EMA200 ($72,829) — a bearish stack that underscores the dominant downtrend in force since last year’s highs. The Bollinger Band midline on the daily sits at $64,456, and price is currently hugging the lower half of that range, suggesting continued compression without a decisive directional catalyst. Overall market structure on the higher timeframe remains bearish until price can reclaim the clustered EMA resistance zone above $64,000.
Multi-Timeframe Confluence
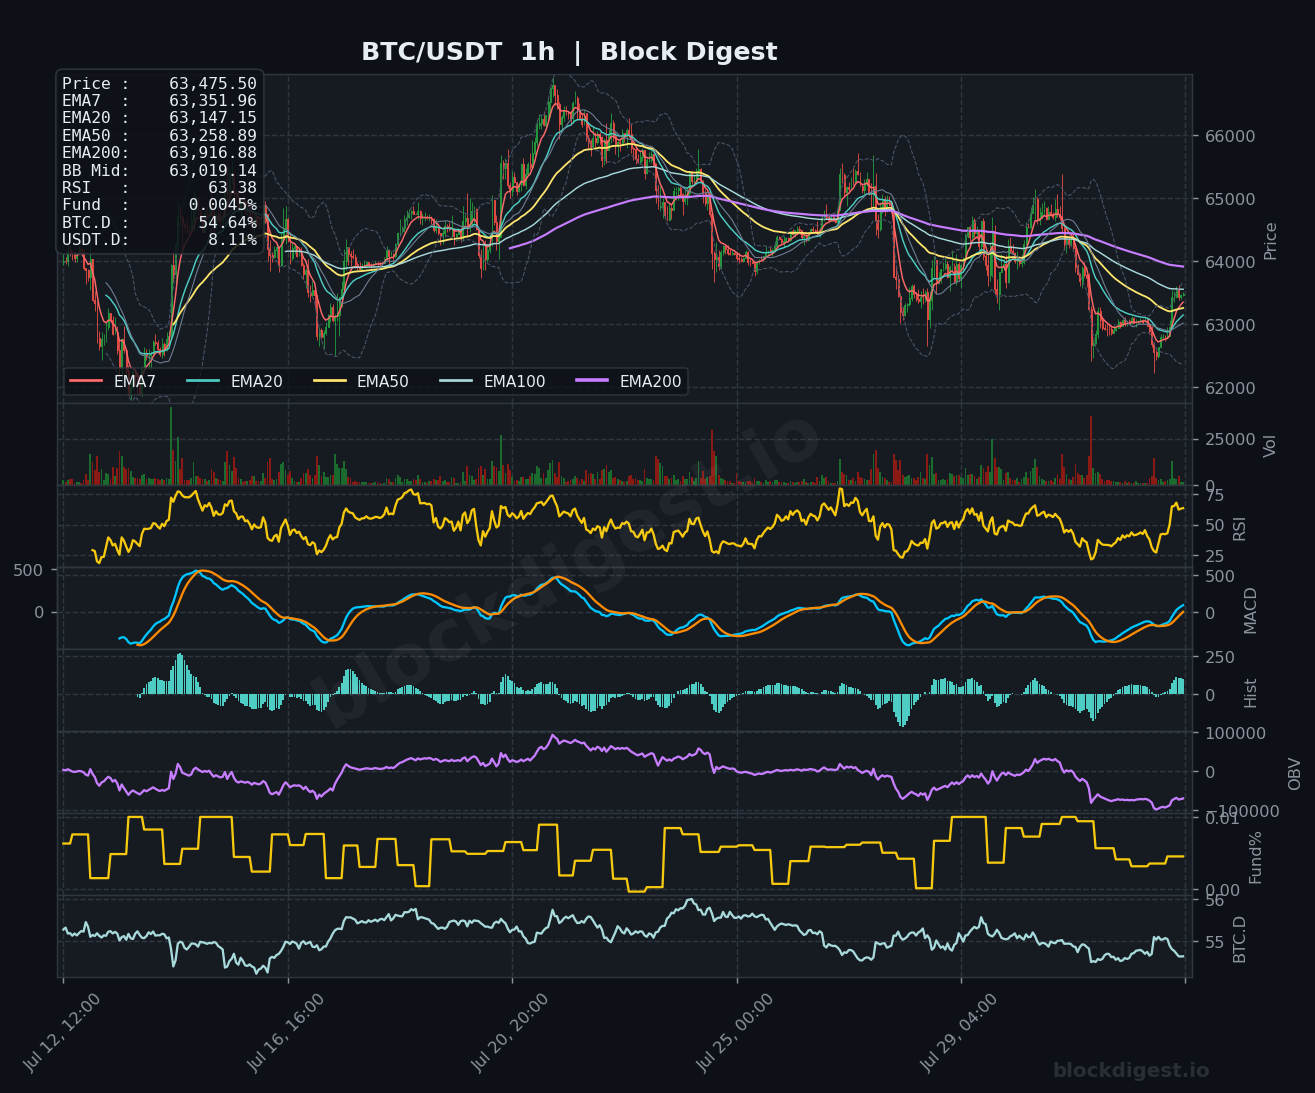
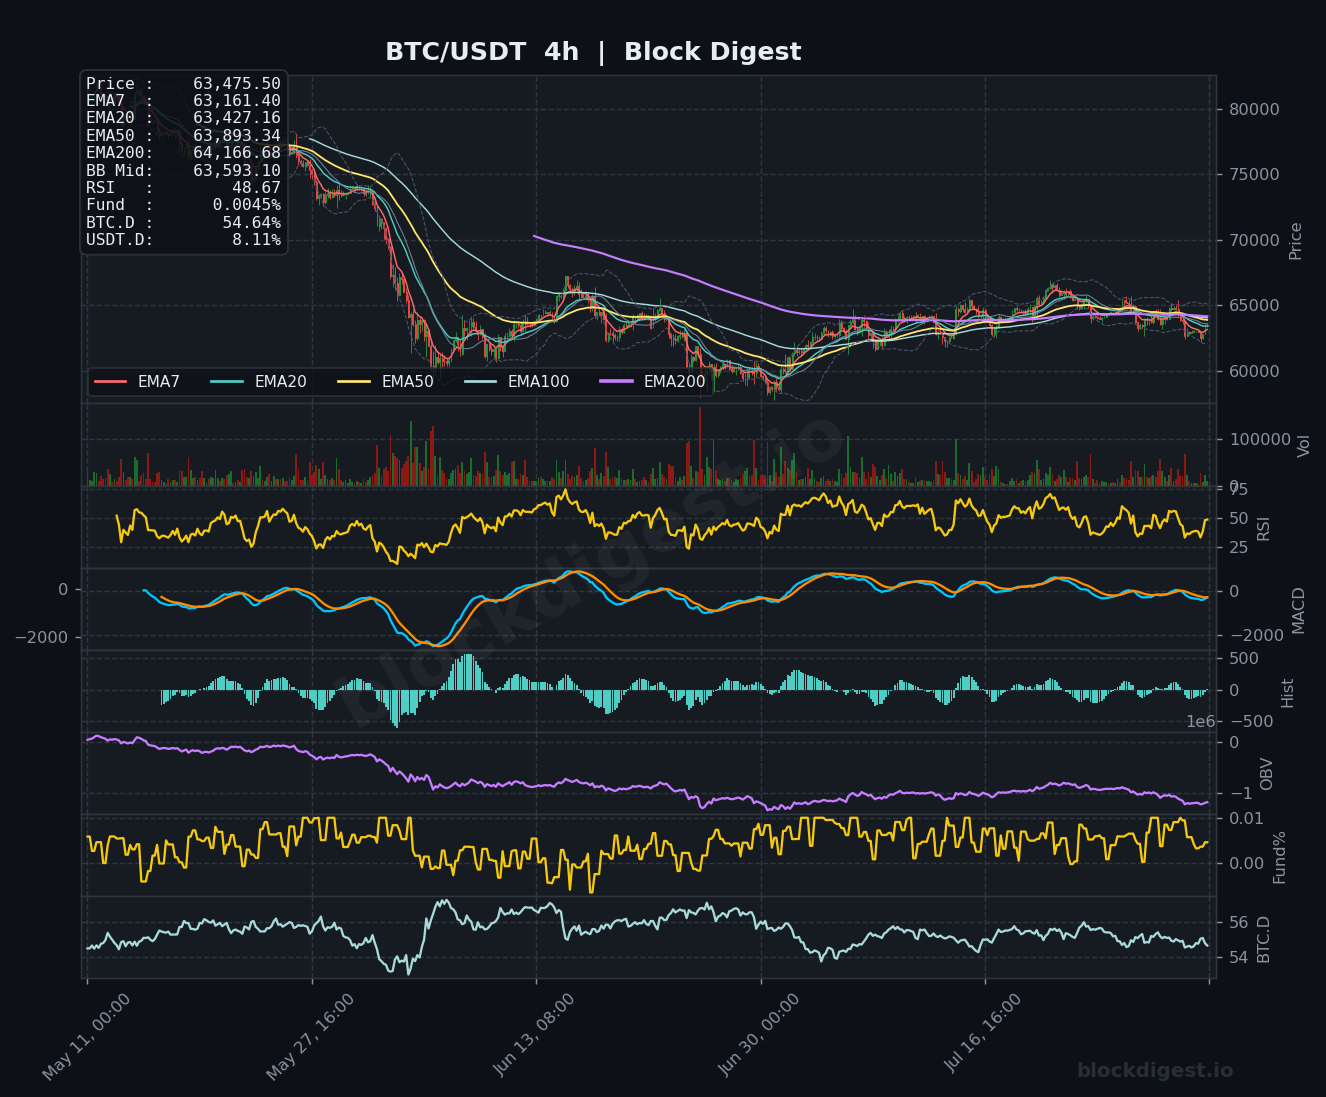
Across all three timeframes, the EMA structure tells a consistent story of distribution rather than accumulation. On the 1-hour chart, price is trading just above EMA7 ($63,351) and EMA20 ($63,147) after a sharp intraday drop, but remains well below the 1h EMA200 at $63,916 — a level that has been acting as dynamic resistance. The 4-hour chart reinforces this bearish bias: EMAs are tightly compressed between $63,161 and $63,893, with the EMA200 at $64,166 capping upside attempts. All three timeframes converge on the $63,900–$64,200 zone as a key battleground, with no meaningful short-term momentum currently supporting a break above it.
Key Levels to Watch
- Resistance:
- $63,916–$64,167 — Confluence of the 1h EMA200 and 4h EMA200; repeated rejections here define the current ceiling
- $64,456–$64,702 — Daily Bollinger Band midline and daily EMA50; reclaiming this zone would be the first meaningful structural shift
- $65,200–$65,500 — Prior consolidation base from the 4h chart; a recovery into this area would signal genuine demand recovery
- Support:
- $63,000–$63,019 — 1h Bollinger Band midline and round-number psychological support; immediate floor
- $62,000 — Visible lower Bollinger Band on the 1h chart and recent intraday wick lows; key breakdown trigger zone
- $60,000–$60,500 — Macro support visible on the daily chart, representing the broader demand zone from the prior consolidation base
Momentum & On-Chain Signals
Our BD Pulse Score sitting at 41/100 — firmly in bearish territory — aligns with what the charts are showing across timeframes. The daily RSI of 47.37 has yet to reclaim the neutral 50 line, and the 4h RSI at 48.67 mirrors this tepid momentum, with neither indicator showing oversold conditions that would typically invite aggressive dip buyers. The daily MACD lines are converging near the zero line but the histogram remains in negative territory, suggesting any bullish crossover would be fragile and low-conviction. OBV on both the 4h and daily charts continues to slope downward, consistent with our BD Pulse OBV Trend reading of -1, confirming that volume is not supporting price recovery — a classic distribution signal.
BTC Dominance & Market Sentiment
BTC dominance holds at 54.64%, a relatively firm reading that suggests capital is not rotating aggressively into altcoins — if anything, the broader market is in a risk-off posture with investors gravitating toward Bitcoin as the safer crypto asset rather than chasing higher-beta plays. USDT dominance at 8.11% remains elevated, reinforcing a cautious sentiment backdrop where a meaningful portion of market participants remain in stablecoins on the sidelines. This combination — high USDT.D paired with moderate BTC.D — historically reflects a market waiting for a clearer directional signal before deploying fresh capital.
Risk Scenarios
- Bullish case: A sustained hourly close above $64,167 (4h EMA200) with expanding volume would mark the first credible reclaim of resistance, with an initial target toward $64,702 (daily EMA50) and extended upside toward $65,500. The $233M in Bitcoin ETF inflows reported at July’s close provides a macro tailwind if sustained into August.
- Bearish case: A decisive break below $63,000 on elevated volume would confirm the current consolidation as distribution, opening the path toward $62,000 and potentially the $60,000–$60,500 macro demand zone; the negative OBV trend and BD Pulse score of 41 lend credibility to this scenario if buying pressure fails to materialize.
Outlook
The near-term bias leans cautiously bearish given the persistent EMA headwinds above and the lack of volume confirmation on any bounce attempts. The next 24–48 hours hinge on whether Bitcoin can hold the $63,000 psychological level and stage a reclaim of the $63,900–$64,200 EMA cluster — failure to do so shifts probabilities toward a test of $62,000. The soft US PCE inflation print provides a macro tailwind and could support a brief relief rally, but the technical structure suggests any upward move without a volume catalyst should be treated as corrective rather than impulsive. Traders should watch the $64,456 daily BB midline as the key level that would meaningfully alter the bearish thesis.
—
Disclaimer: This analysis is for informational purposes only and does not constitute financial advice. Cryptocurrency markets are highly volatile and unpredictable. All trading decisions should be made based on your own research and risk tolerance. Block Digest is not responsible for any financial losses incurred as a result of acting on this content.
Stay Ahead of the Market
Follow BlockDigest for crypto market intelligence, research and real-time updates.


