
Market Overview
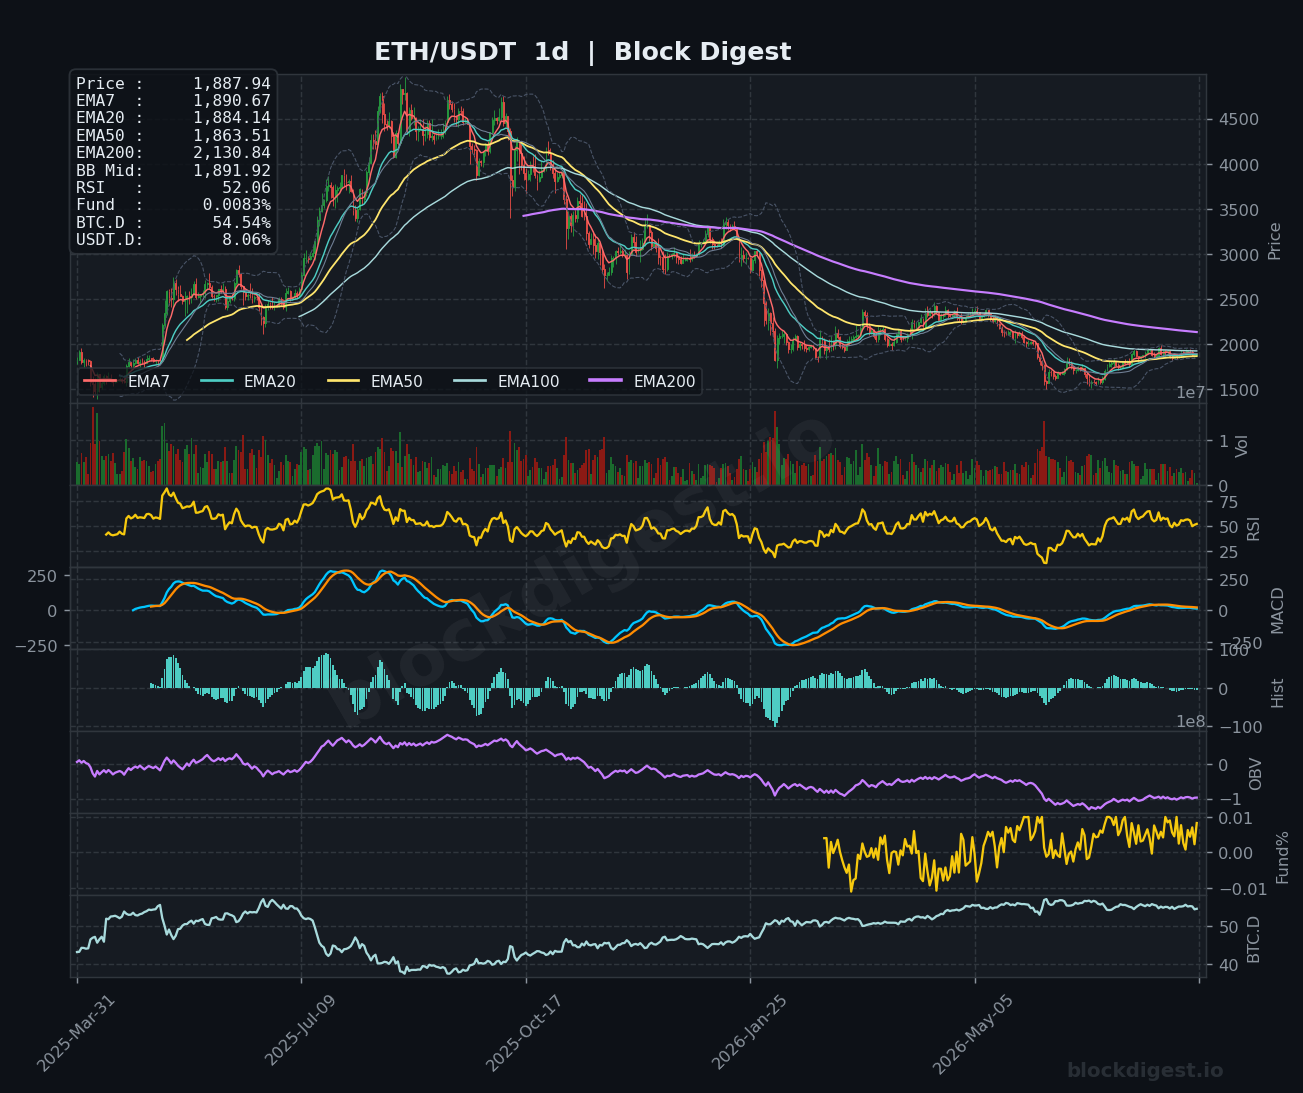
Ethereum is trading at $1,887.93 as of August 12, 2026, navigating a technically precarious zone as price hovers just below several converging EMA barriers. On the daily timeframe, ETH remains well beneath its EMA200 at $2,130.84 — a stark reminder of the dominant macro downtrend that has defined price action since mid-2025. However, the shorter-term EMAs are beginning to cluster tightly around current price levels, with the daily EMA7 at $1,890.67, EMA20 at $1,884.14, and EMA50 at $1,863.51 all compressing within a roughly $27 range. Price is also trading just below the Bollinger Band midline at $1,891.92 on the daily chart, suggesting a market still searching for directional conviction.
Multi-Timeframe Confluence
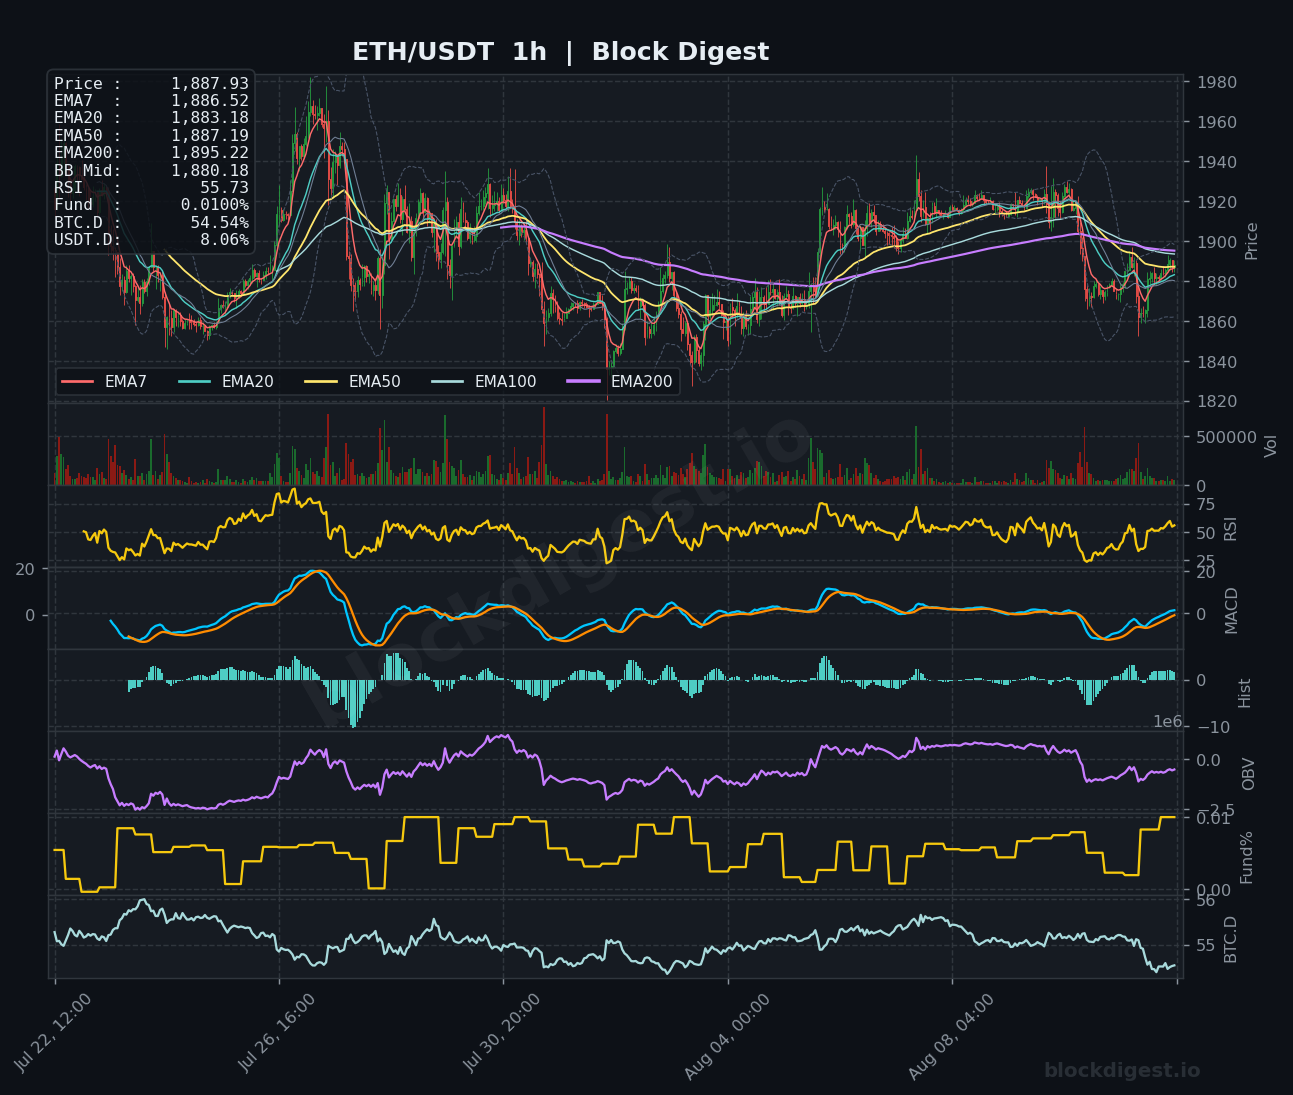
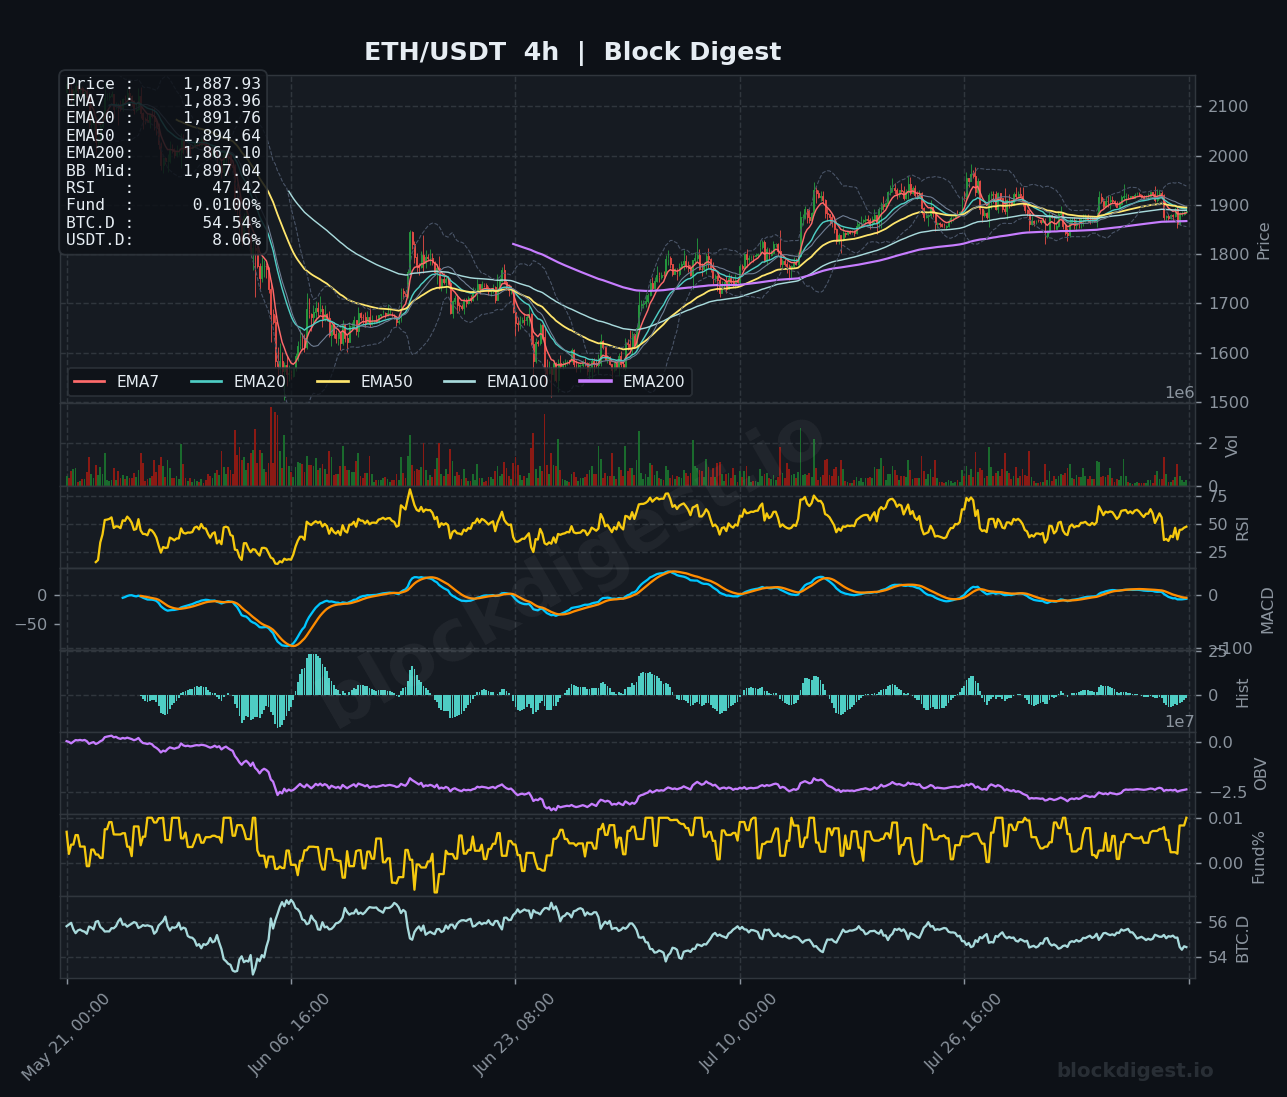
On the 1-hour chart, price is threading between the EMA7 ($1,886.52), EMA20 ($1,883.18), and EMA50 ($1,887.19) in a tight coil, with the EMA200 at $1,895.22 acting as immediate overhead resistance. The 4-hour chart shows a similar picture: the EMA20 ($1,891.76) and EMA50 ($1,894.64) are stacked just above current price, forming a resistance cluster in the $1,891–$1,895 zone, while the 4H EMA200 at $1,867.10 provides a closer floor. Across all three timeframes, the consistent theme is price trading below multiple EMA bands simultaneously — a structurally bearish alignment — with short-term momentum attempting a modest recovery from recent lows near $1,860 but failing to establish a clean breakout. The daily BB midline and the 1H/4H EMA200 levels all converge near $1,891–$1,897, making this band the most critical near-term battleground.
Key Levels to Watch
- Resistance: $1,895–$1,897 — confluence of the 4H EMA50, 4H BB midline, and daily BB midline; repeated rejection here would reinforce the bearish structure
- Resistance: $1,920–$1,925 — a former consolidation zone visible on the 1H chart and a prior swing high; reclaiming this level would represent a meaningful shift in short-term structure
- Resistance: $1,960–$1,980 — upper Bollinger Band on the 1H chart and an area of prior distribution; a push here would require a significant catalyst
- Support: $1,867 — the 4H EMA200 and a logical first line of defense on a pullback; loss of this level would accelerate selling pressure
- Support: $1,860 — recent swing low visible on both the 1H and 4H charts; this level has held on prior tests and serves as a near-term floor
- Support: $1,820–$1,830 — a deeper structural support zone coinciding with the lower Bollinger Band on the 4H chart; a breakdown here would open the door to a retest of the $1,780 area
Momentum & On-Chain Signals
The RSI picture is mixed but leans cautious: the 4H RSI sits at 47.42, hovering just below the neutral 50 line, while the 1H RSI has recovered to 55.73 following the recent bounce — suggesting short-term buying interest that has yet to translate into higher timeframe strength. Our proprietary BD Pulse score of 38/100 corroborates this subdued reading, flagging overall bearish momentum conditions even as price attempts to stabilize. The daily MACD shows both lines converging near the zero line from below, with a histogram that is narrowing but not yet positive — a tentative setup that needs confirmation before signaling a sustained recovery. Critically, the BD Pulse’s OBV Trend reading of -1 aligns with what the 4H OBV chart shows: a gradual descent since the local peak, indicating that volume is not yet supporting the current price recovery, raising the risk that this bounce is a relief rally rather than a structural reversal.
BTC Dominance & Market Sentiment
BTC dominance sits at 54.53% — a level that has been firm throughout recent weeks — signaling that capital continues to favor Bitcoin over altcoins including Ethereum during this period of macro uncertainty. USDT.D at 8.06% remains elevated, reflecting a risk-off posture among a meaningful segment of participants who are sitting in stablecoins ahead of this week’s critical U.S. inflation data releases. For ETH specifically, persistent BTC dominance at these levels typically suppresses altcoin outperformance, meaning ETH would likely need a broader risk-on catalyst — such as a dovish inflation print — to mount a meaningful rally relative to BTC.
Risk Scenarios
- Bullish case: A clean break and daily close above the $1,897 resistance cluster, ideally accompanied by a 4H RSI push above 55 and improving OBV, could target a move toward $1,920–$1,925 in the near term, with a stretch target of $1,960 if broader market sentiment flips on a softer-than-expected inflation print.
- Bearish case: Failure to reclaim $1,895 on a retest, combined with a breakdown below the 4H EMA200 at $1,867, would signal that the bounce has exhausted itself and open a path toward the $1,820–$1,830 support zone, with further downside risk if BTC rolls over on hawkish macro data.
Outlook
ETH’s short-term posture is one of fragile consolidation — price is wedged between a cluster of EMAs on all timeframes with no clear directional edge, and our BD Pulse score of 38 reflects that the underlying momentum environment remains tilted bearish. The next 24–48 hours are dominated by macro risk, with U.S. inflation data serving as the most likely catalyst to break the current compression. A daily close above $1,897 with expanding volume would shift the near-term bias to neutral-to-bullish, while a failure at resistance followed by a break below $1,860 would reinforce the downtrend and likely invite a test of $1,820. Until ETH reclaims its daily EMA200 at $2,130.84, any rallies should be treated as countertrend moves within a broader bearish structure.
Disclaimer: This analysis is for informational purposes only and does not constitute financial advice. Cryptocurrency markets are highly volatile and unpredictable. All trading decisions should be made based on your own research and risk tolerance. Block Digest is not responsible for any financial losses incurred as a result of acting on this content.
Stay Ahead of the Market
Follow BlockDigest for crypto market intelligence, research and real-time updates.


