
Market Overview
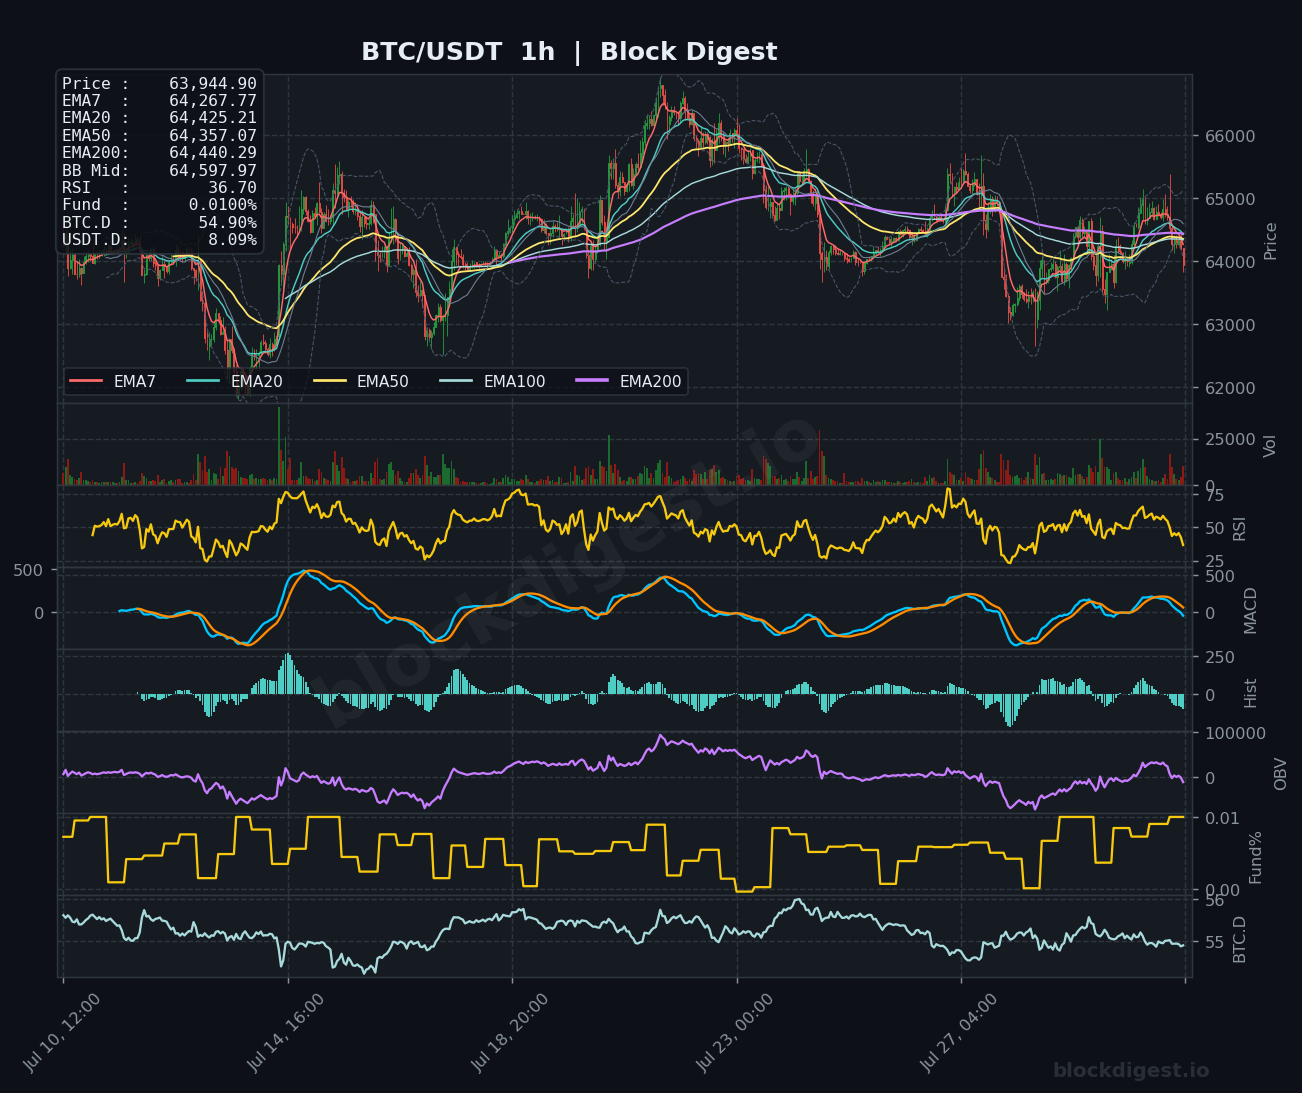
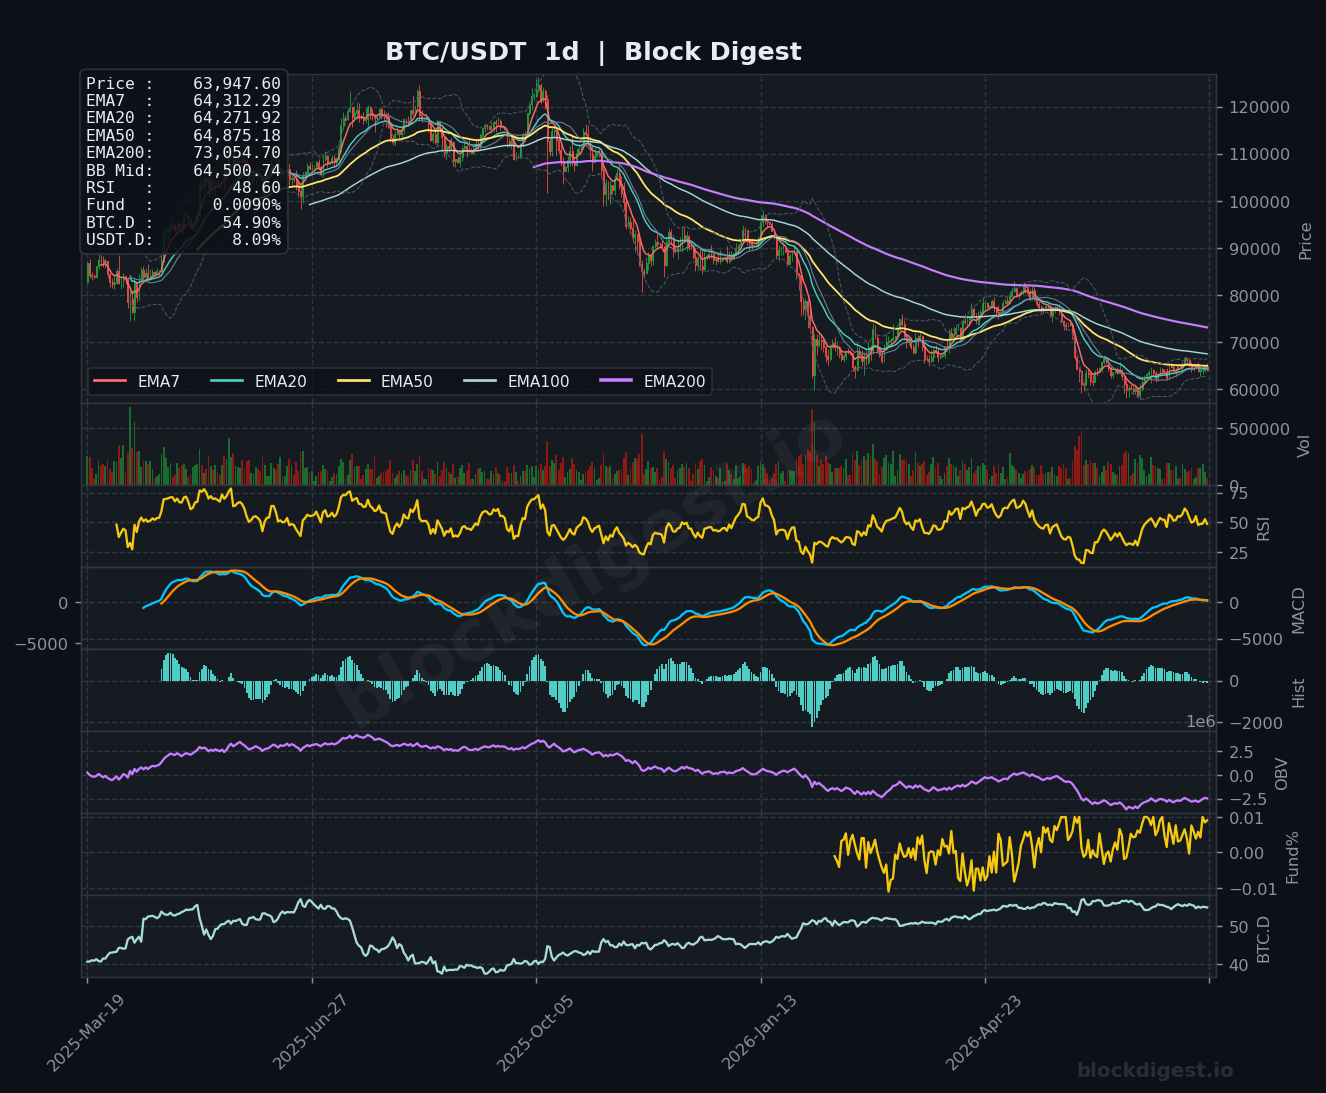
Bitcoin is trading at approximately $63,945, sitting beneath a tightly compressed cluster of key EMAs on both the hourly and daily timeframes, signaling hesitation rather than directional conviction. On the daily chart, price remains well below the EMA200 at $73,054 — a structural overhang that has defined the broader bearish regime since early 2026 — while also trading under the daily EMA50 at $64,875 and the Bollinger Band midline at $64,500. The overall daily trend structure reflects a market that has recovered from its mid-cycle lows but has stalled in a contested range between roughly $63,000 and $66,000, unable to establish a clean higher-high sequence. With the recent slip below $65,000 coinciding with US-Iran geopolitical tension and ETF outflows snapping a seven-day inflow streak, the path of least resistance appears sideways-to-lower in the near term.
Multi-Timeframe Confluence
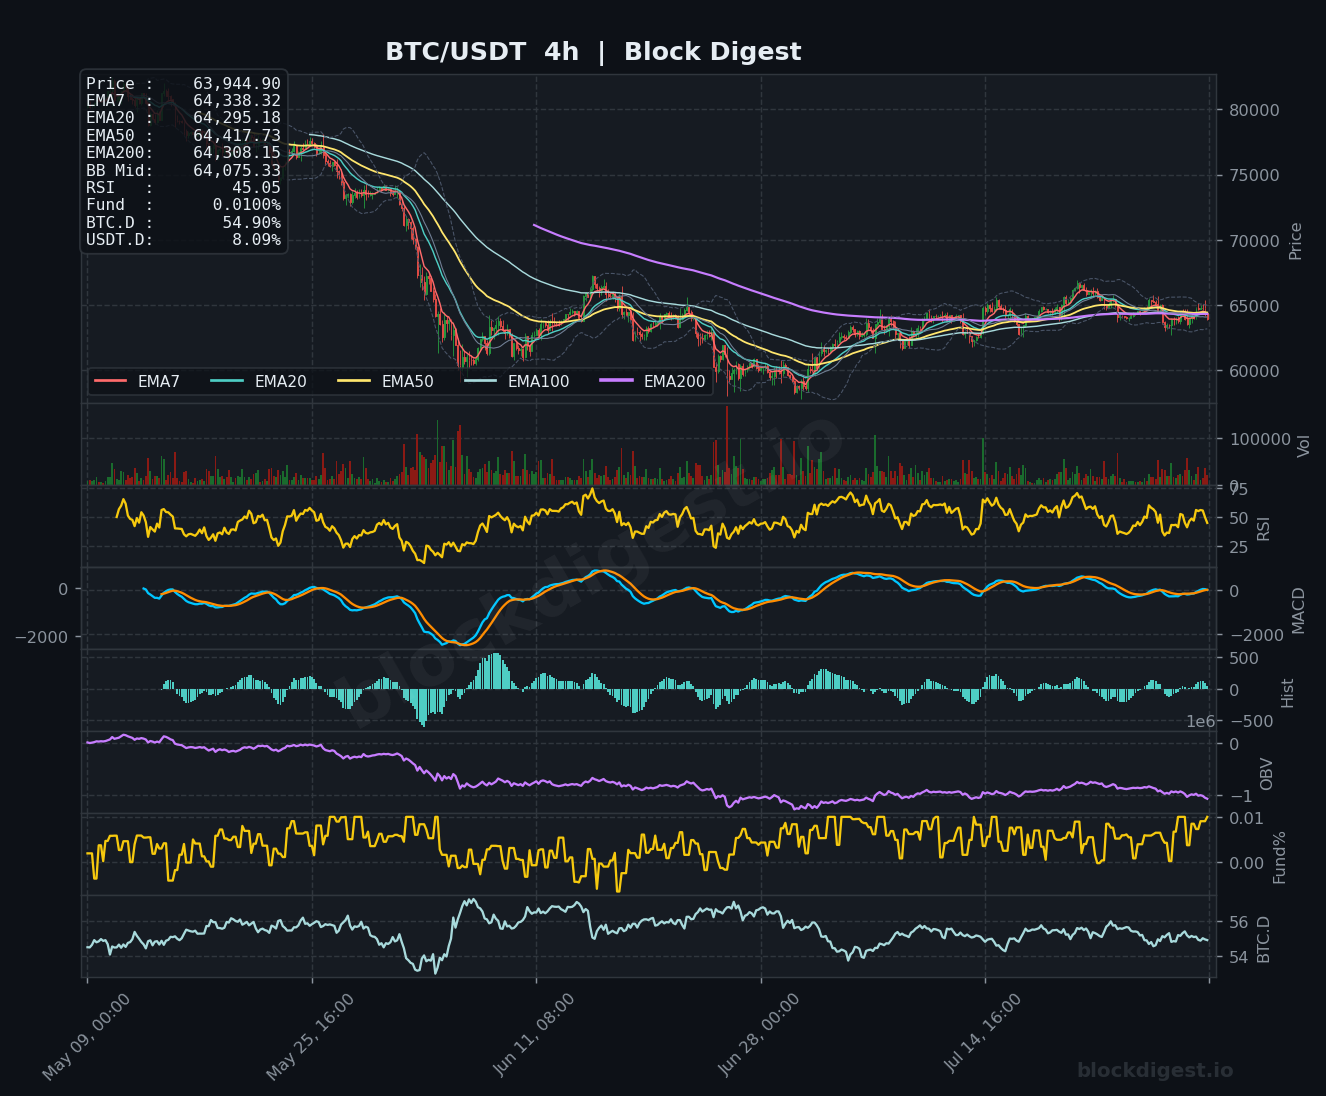
Across all three timeframes, the EMA stack is bearishly ordered relative to recent price action, with the 1h chart showing price ($63,945) trading below the EMA7 ($64,268), EMA20 ($64,425), EMA50 ($64,357), and EMA200 ($64,440) simultaneously — a notably compressed bearish alignment that typically precedes a volatility expansion. On the 4h chart, the EMA cluster between $64,295 and $64,418 is acting as overhead resistance, and the Bollinger Band midline at $64,075 is now the immediate pivot to watch. The daily and 4h timeframes broadly agree: momentum has been fading since the mid-July high near $66,000, and any short-term recoveries have consistently failed to produce sustained follow-through above the $65,000 area.
Key Levels to Watch
- Resistance: $64,425–$64,440 — the 1h EMA20/EMA200 confluence acting as the first meaningful ceiling for any intraday bounce; $64,875 — the daily EMA50, which must be reclaimed to shift short-term structure bullish; $65,500–$66,000 — the mid-July swing high zone where sellers have consistently re-engaged.
- Support: $63,500–$63,600 — recent intraday low and the lower end of the current consolidation range; $62,800–$63,000 — a structural support shelf that capped downside during earlier consolidation and represents the last meaningful demand zone before open air; $61,500 — the broader swing low from late June, a breakdown below which would signal a more serious trend deterioration.
Momentum & On-Chain Signals
The 1h RSI at 36.70 is approaching oversold territory without yet triggering a confirmed reversal signal, while the 4h RSI at 45.05 and the daily RSI at 48.60 both sit in neutral-to-slightly-weak territory — consistent with Block Digest’s BD Pulse Score of 45/100, which corroborates the absence of either strong bullish or bearish momentum pressure. The 1h MACD is curling toward a bearish cross below zero, while the 4h MACD histogram has been producing shallow, diminishing bars on recent recovery attempts — a sign of fading buying pressure. OBV on the daily timeframe continues its broader downward drift, and our BD Pulse OBV Trend reading of +1 suggests only marginal accumulation at current levels, not the kind of aggressive buying that typically precedes sustained rallies. Funding rates remain mildly positive at +0.0088%, indicating longs are paying a small premium but without the overheated positioning that would suggest imminent flush risk.
BTC Dominance & Market Sentiment
BTC Dominance sits at 54.91%, holding a relatively elevated level that reflects continued risk-off rotation within crypto — capital is not flowing into altcoins, but it is also not aggressively rotating back into Bitcoin. USDT.D at 8.09% remains elevated, suggesting a meaningful portion of market participants are still sitting on the sidelines in stablecoins, which is consistent with the cautious sentiment following ETF outflows and macro uncertainty around oil prices and geopolitical risk.
Risk Scenarios
- Bullish case: A clean reclaim of the $64,875 daily EMA50 on meaningful volume, combined with a 4h MACD bullish crossover, would improve the short-term structure and open a path toward $65,500–$66,000. A renewed ETF inflow cycle and easing geopolitical pressures could provide the macro catalyst to push a re-test of the $66,000 resistance zone.
- Bearish case: Failure to hold the $63,500 support and a confirmed 4h close below $63,000 would accelerate selling pressure toward the $61,500 swing low. A deterioration in BTC Dominance below 54% alongside continued ETF outflows and rising macro risk would compound downside pressure and bring the broader bearish trend back into focus.
Outlook
The setup as of July 31 is one of cautious consolidation under key resistance, with the weight of evidence — EMA structure, MACD, OBV drift, and macro headwinds — leaning modestly bearish in the near term. The $64,875 daily EMA50 is the line in the sand: bulls need to reclaim it convincingly to change the narrative, while a loss of $63,500 support would expose the $62,800 zone quickly. The next 24–48 hours will likely be shaped by macro sentiment around geopolitical developments and whether institutional flows resume or extend the current outflow pattern. Until price demonstrates a clear break and hold above $65,000, the path of least resistance remains range-bound with a downside bias.
—
Disclaimer: This analysis is for informational purposes only and does not constitute financial advice. Cryptocurrency markets are highly volatile and unpredictable. All trading decisions should be made based on your own research and risk tolerance. Block Digest is not responsible for any financial losses incurred as a result of acting on this content.
Stay Ahead of the Market
Follow BlockDigest for crypto market intelligence, research and real-time updates.


