
Market Overview
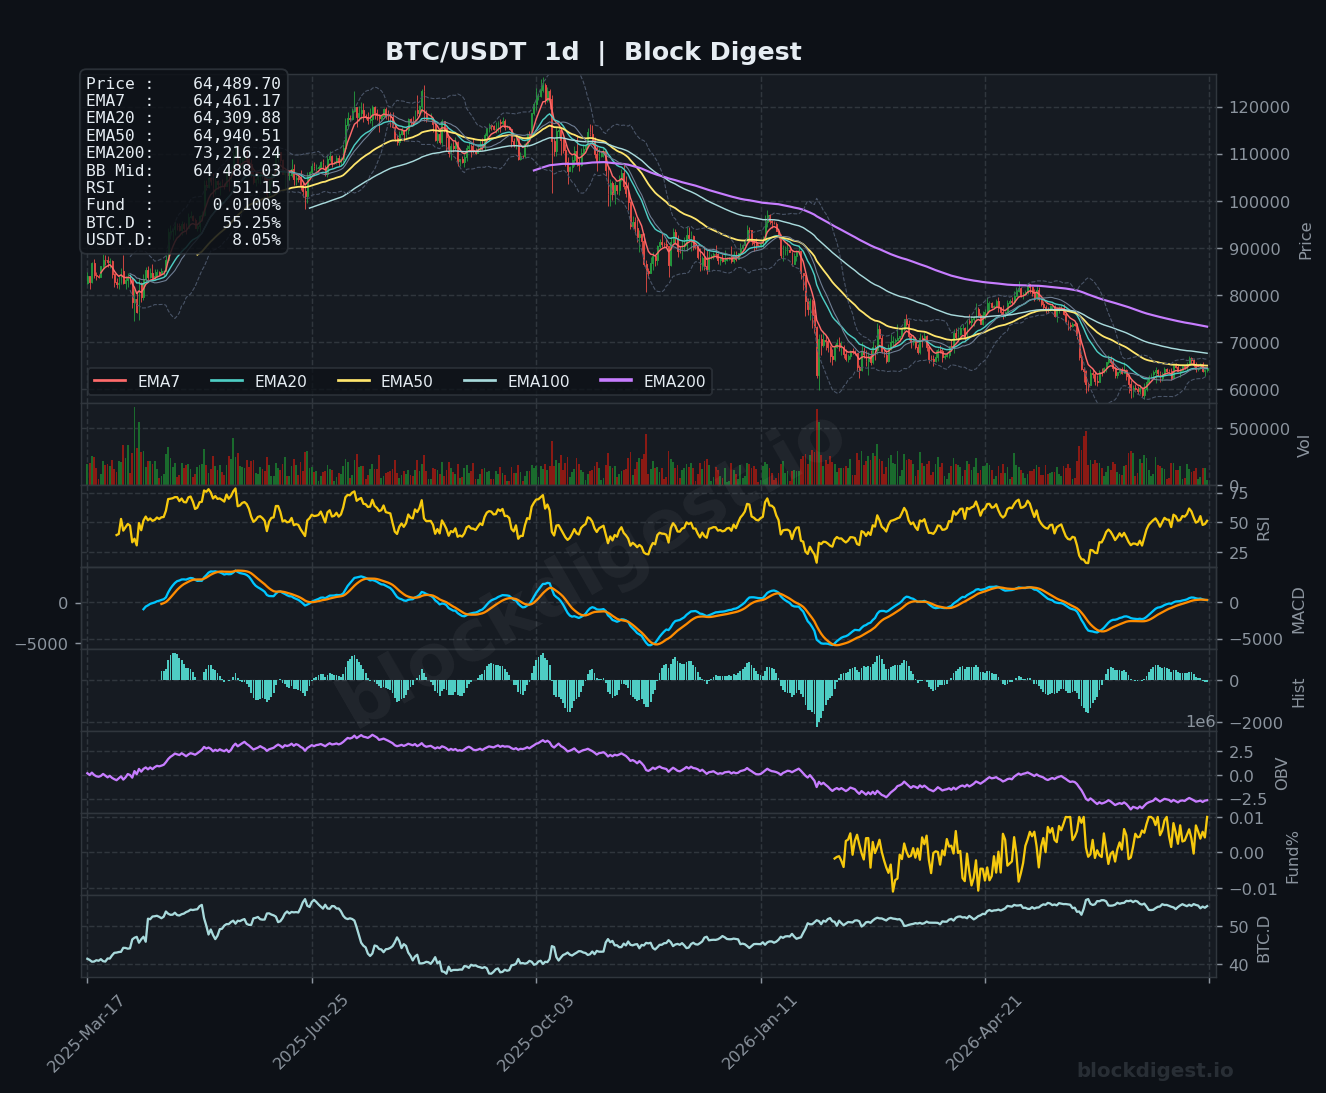
Bitcoin is trading at approximately $64,489 as of July 29, 2026, consolidating in a tight range after pulling back from recent highs near $66,000. On the daily timeframe, price is hugging the Bollinger Band midline at $64,488, suggesting indecision rather than a clear directional conviction. The short-term EMAs on the daily chart — EMA7 ($64,461), EMA20 ($64,309), and EMA50 ($64,940) — are tightly compressed around current price, a hallmark of a market coiling before its next significant move. Critically, the daily EMA200 remains elevated at $73,216, confirming that BTC is still operating well beneath its long-term trend average, meaning the broader macro structure remains bearish until that level is reclaimed.
Multi-Timeframe Confluence
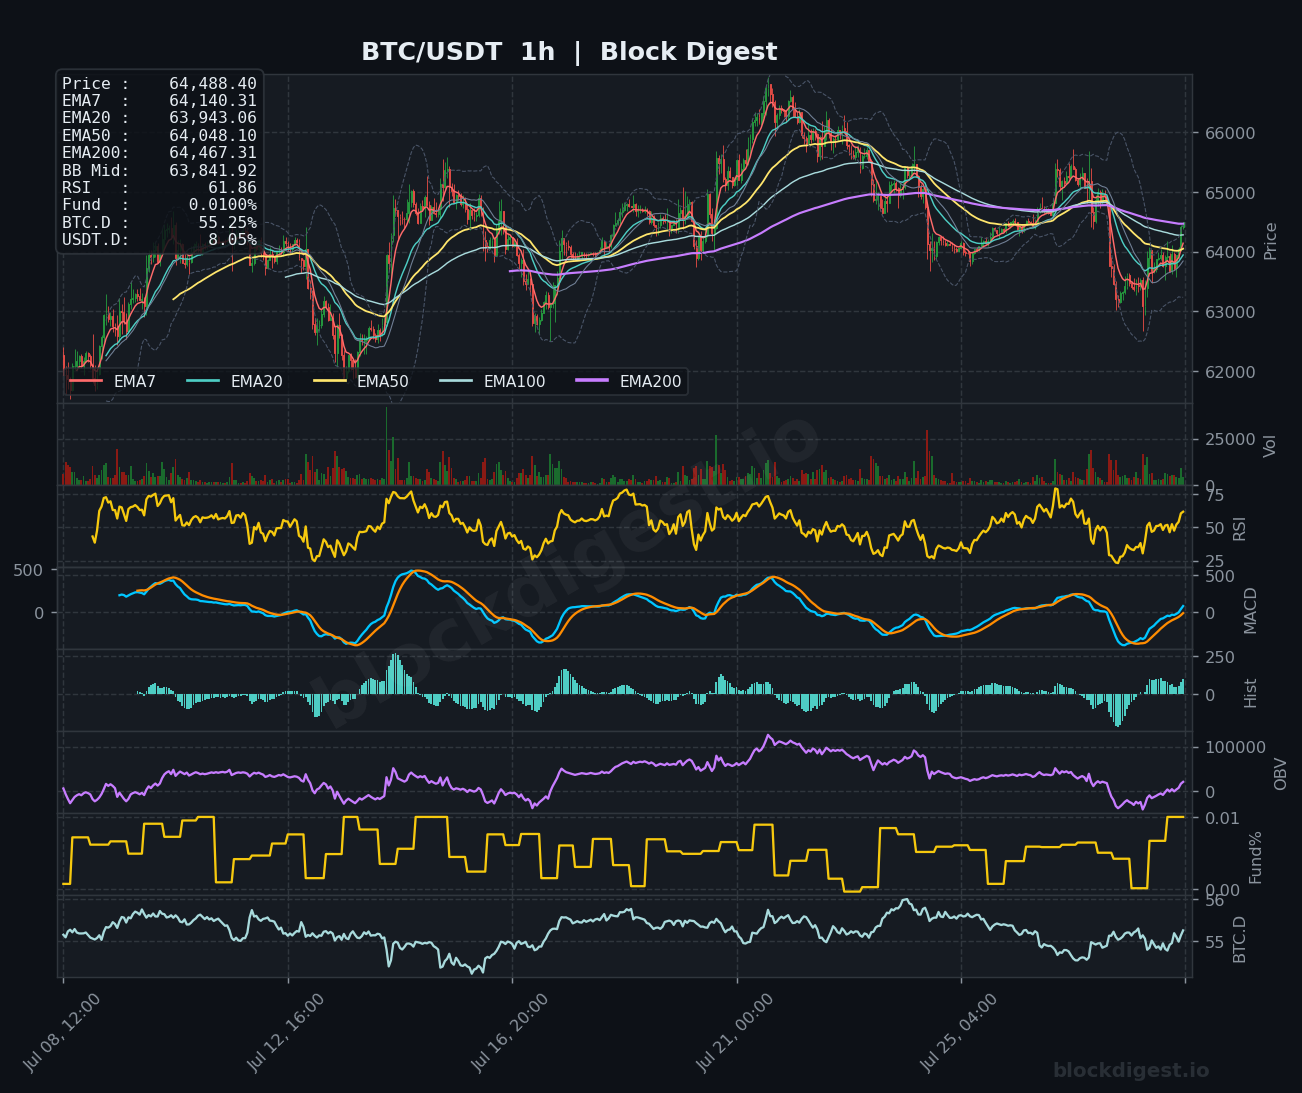
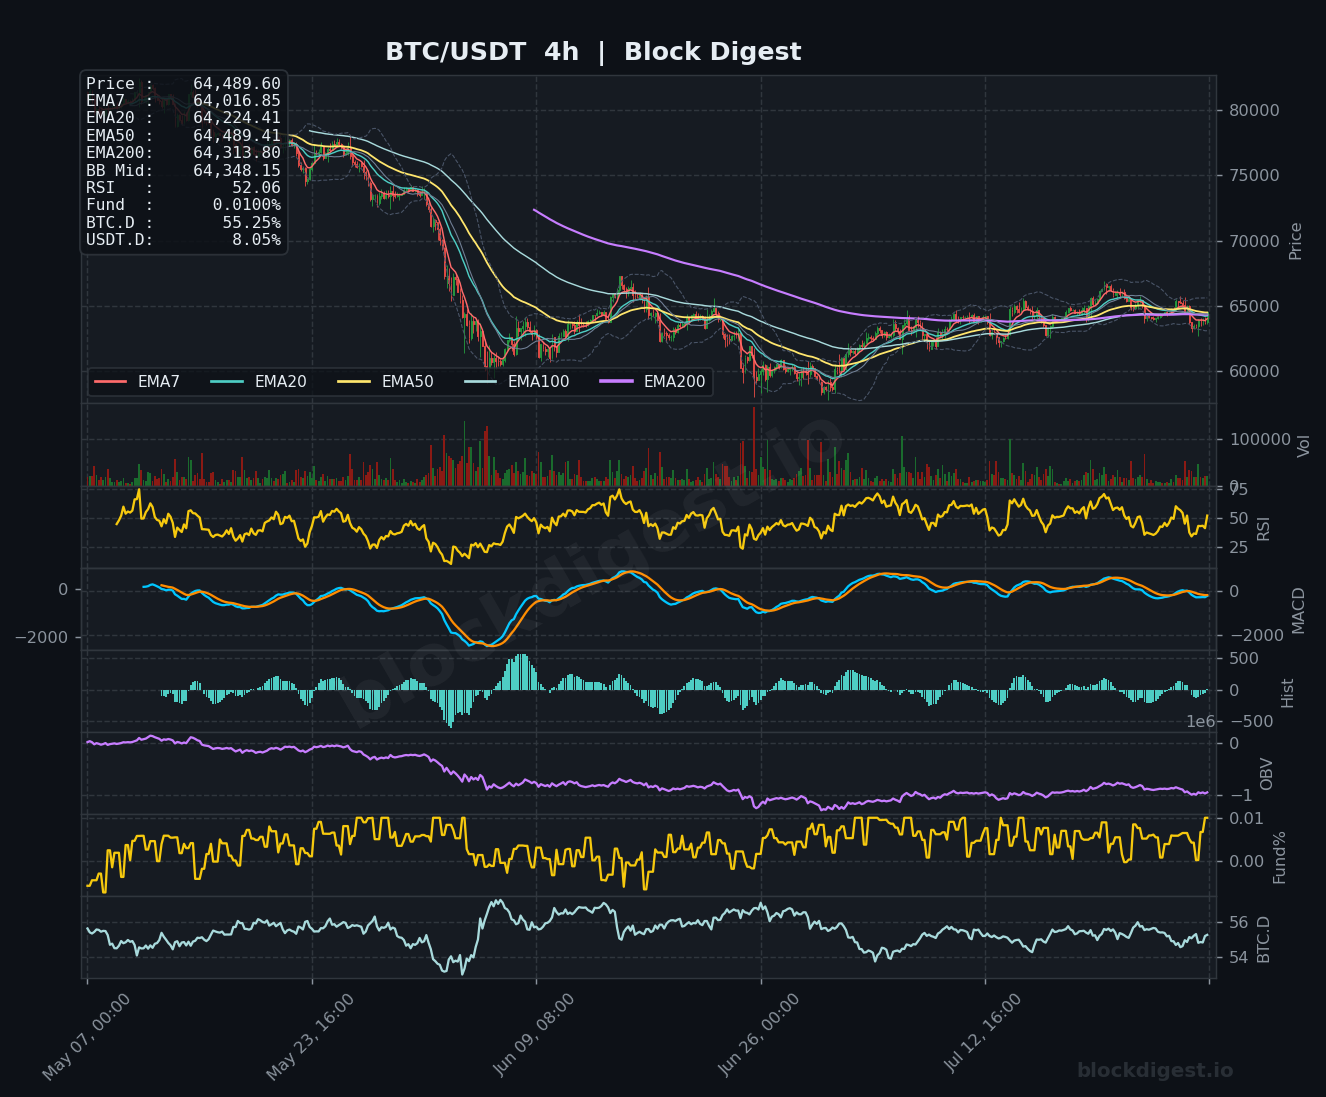
On the 1-hour chart, price has recovered above all short-term EMAs (EMA7 at $64,140, EMA200 at $64,467), showing near-term resilience, though the 1h RSI at 61.86 is cooling from overbought territory after the recent bounce. The 4-hour chart tells a more cautious story: EMAs are tightly bunched between $64,016 and $64,489, with price essentially flat-lining at the EMA50 ($64,489) — a level that has proven to be both support and resistance in recent sessions. Daily and 4h timeframes broadly agree that $64,000–$65,000 is a pivotal decision zone, and until price stages a convincing close above the $65,200–$65,500 band, the path of least resistance remains sideways-to-lower.
Key Levels to Watch
- Resistance: $65,200 — recent swing high and upper boundary of the current consolidation range; a clean hourly close above here would shift short-term momentum bullish. $65,800–$66,000 — the zone from which the most recent rejection originated, coinciding with the upper Bollinger Band on the 1h. $67,500 — intermediate structural resistance and former breakdown level from the April–May decline.
- Support: $63,840 — the 1h Bollinger Band midline and a short-term intraday pivot; a breach would expose the next layer. $63,000 — psychological round number and a cluster of prior intraday lows from recent sessions. $61,500–$62,000 — the broader demand zone established during the June consolidation floor; a test here would represent a meaningful correction.
Momentum & On-Chain Signals
Block Digest’s proprietary BD Pulse score sits at 41/100 (Bearish), and with the daily RSI registering 51.06 — essentially at the midpoint — there is no strong momentum bias in either direction, consistent with what the charts are showing. On the 4h MACD, the signal line and MACD line are converging near zero, with histogram bars shrinking, pointing to a loss of downside momentum but not yet a confirmed bullish crossover. The OBV trend scores a +1 on our BD Pulse framework, indicating marginal accumulation, yet the 4h OBV remains in a gradual decline from its cycle peak, suggesting distribution has not fully reversed. Funding rates are a modest +0.0056%, keeping leveraged positioning neutral with no significant squeeze risk in either direction at current levels.
BTC Dominance & Market Sentiment
BTC dominance is holding firm at 55.24% — a level confirmed across all three chart timeframes — while USDT.D sits at 8.05%, suggesting that a meaningful portion of capital remains parked in stablecoins rather than rotating into altcoins or risk assets broadly. This combination implies the market is in a wait-and-see mode: BTC is not losing ground to altcoins, but fresh capital is not aggressively deploying into crypto either. The recent $225M in ETF outflows after a seven-day inflow streak reinforces this cautious institutional posture, though the social sentiment score of 3.9/5 suggests retail mood has not turned overtly negative.
Risk Scenarios
- Bullish case: A sustained hourly close above $65,200, accompanied by rising volume and a 4h MACD bullish crossover, would open a path toward the $65,800–$66,000 resistance zone. Further ETF inflow resumption and positive macro catalysts could extend the move toward $67,500.
- Bearish case: A decisive break below $63,840, confirmed on the 4h with a close beneath the EMA cluster, would likely trigger a retest of $63,000 and potentially $61,500. A deterioration in the BD Pulse score below 35, combined with renewed ETF outflows, would strengthen the case for a deeper correction.
Outlook
Bitcoin’s technical setup as of July 29 reflects a market at an inflection point — compressed EMAs, RSI at midpoint, and price sitting precisely on the daily Bollinger Band midline all point to an imminent directional resolution rather than extended consolidation. The 24–48 hour trigger to watch is a decisive move through either $65,200 to the upside or $63,840 to the downside, as both levels carry multi-timeframe significance. MicroStrategy’s pause on BTC purchases and the recent ETF outflow streak remove two key demand catalysts that have previously backstopped dips, adding a degree of downside vulnerability. Given the BD Pulse sitting at 41 and the EMA200 on the daily still more than $8,700 above current price, the balance of evidence favors a cautiously bearish bias unless bulls can engineer a clean break and hold above $65,200.
—
Disclaimer: This analysis is for informational purposes only and does not constitute financial advice. Cryptocurrency markets are highly volatile and unpredictable. All trading decisions should be made based on your own research and risk tolerance. Block Digest is not responsible for any financial losses incurred as a result of acting on this content.
Stay Ahead of the Market
Follow BlockDigest for crypto market intelligence, research and real-time updates.


