
Author: BD Research Desk
BTC Daily Analysis — 2026-08-03 (Full Archive)
Market Overview Bitcoin is trading at $62,573 as of August 3, 2026, situated beneath a stacked bearish EMA formation across all major timeframes. On the daily chart, price sits well below the EMA7 ($63,406), EMA20 ($63,856), EMA50 ($64,622), and a sharply declining EMA200 at $72,726 — a configuration that underscores the dominant downtrend that has...
ALTCOIN Daily Analysis — 2026-08-02 (Full Archive)
Market Context The altcoin market is navigating a broadly defensive environment as BTC dominance holds at 54.64% — a level that continues to siphon capital away from lower-cap assets and suppress meaningful altcoin momentum. USDT.D sitting at 8.11% signals that a non-trivial amount of capital remains parked on the sidelines, reflecting lingering risk-off sentiment following...
ETH Daily Analysis — 2026-08-02 (Full Archive)
Market Overview Ethereum is trading around $1,875.60 as of August 2, 2026, navigating a technically delicate zone following a broader market pullback that has seen ETH shed roughly 3.1% in 24 hours. On the daily timeframe, price sits in a congested region between the EMA7 ($1,881.34), EMA20 ($1,869.00), and EMA50 ($1,848.99), with the heavily suppressive...
BTC Daily Analysis — 2026-08-02 (Full Archive)
Market Overview Bitcoin is trading at $63,475.50, positioned in a tentative consolidation zone after a notable drawdown from the mid-$60,000s. On the daily timeframe, price sits below its EMA7 ($63,665), EMA20 ($63,983), EMA50 ($64,702), and significantly beneath the EMA200 ($72,829) — a bearish stack that underscores the dominant downtrend in force since last year’s highs....
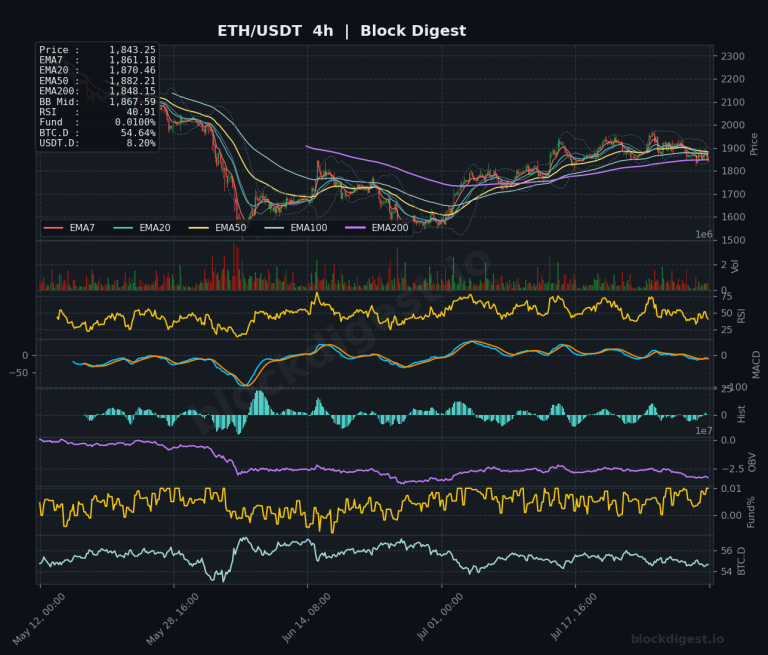
Ethereum Weekly Analysis: Ethereum slides to $1,843, resistance holds at $1,950
Weekly Market Overview Ethereum enters the week of August 3, 2026 under meaningful selling pressure, with price trading around $1,843 after a 3%+ decline in the most recent session. The weekly candle structure reflects a continuation of the broader downtrend that has dominated ETH since its cycle highs, with price struggling to sustain any meaningful...
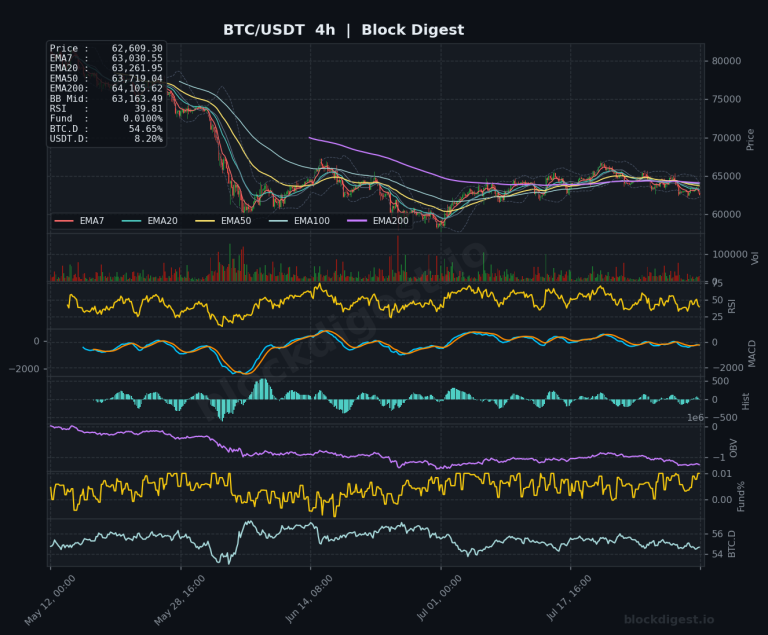
Bitcoin Weekly Analysis: Bitcoin Stalls at $62.6K Amid EMA Compression
Weekly Market Overview Bitcoin enters August 2026 in a structurally fragile position, trading near $62,609 after a modest July recovery that failed to establish any meaningful higher-high on the weekly timeframe. The week’s price action has been characterized by compression just below a cluster of declining EMAs, with sellers repeatedly asserting control near the $64,000–$65,000...
ALTCOIN Daily Analysis — 2026-08-01 (Full Archive)
Market Context The broader altcoin market is navigating a risk-off environment as Bitcoin dominance holds firm at 54.59%, a level that historically suppresses meaningful alt rallies and signals continued capital rotation toward BTC as a relative safe haven. USDT dominance at 8.15% remains elevated, confirming that sidelined cash has yet to re-enter risk assets in...
ETH Daily Analysis — 2026-08-01 (Full Archive)
Market Overview Ethereum is trading at $1,868.76 as of August 1, 2026, registering a decline of approximately 3.18% over the past 24 hours as the broader crypto market enters a cautious phase heading into the new month. On the daily timeframe, price has pulled back beneath the EMA7 ($1,889.41) and is now testing the EMA20...
BTC Daily Analysis — 2026-08-01 (Full Archive)
Market Overview Bitcoin is trading at approximately $63,024 as of August 1, 2026, down roughly 3% over the past 24 hours and sitting in a structurally weak position across all major timeframes. On the daily chart, price is trading well below the EMA200 at $72,926 — a level that has acted as a gravitational ceiling...
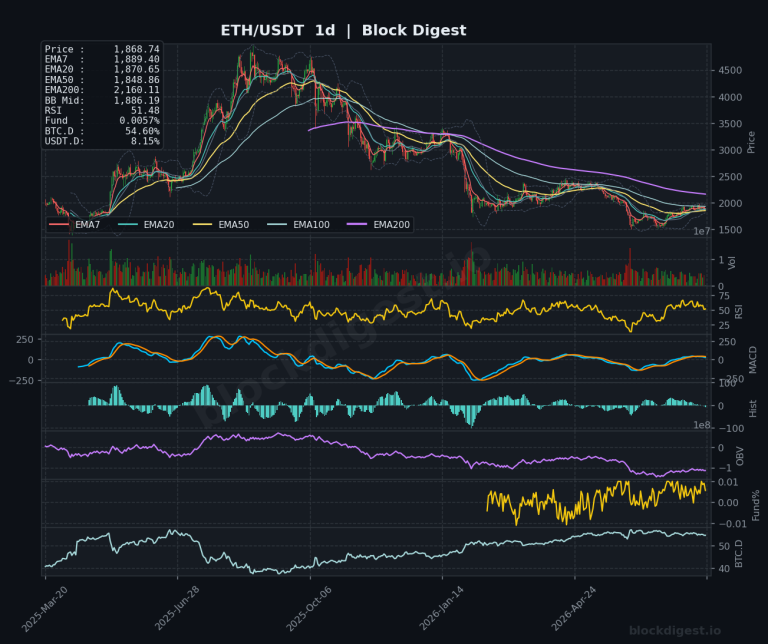
Ethereum Monthly Analysis: Ethereum Retests 2023 Base at $1,868
Macro Market Overview Ethereum enters August 2026 printing what is shaping up to be a structurally significant monthly candle, currently holding near $1,868 after a pronounced multi-month downtrend that has erased the majority of the 2024–2025 bull cycle gains. On the monthly chart, price has now retraced deep into the macro consolidation zone that defined...
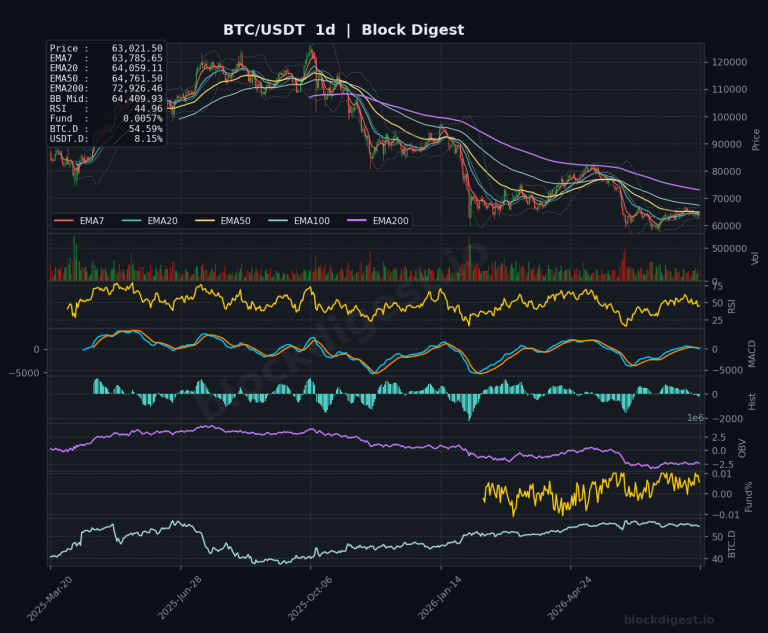
Bitcoin Monthly Analysis: Bitcoin at $63K Tests Macro Range After Peak
Macro Market Overview Bitcoin enters August 2026 trading near $63,021, firmly below its all-time high territory and navigating what the monthly chart reveals as a clear post-peak distribution phase. The current monthly candle structure shows a sequence of lower highs following the cycle top established above $109,000, with price now testing the lower bounds of...
ALTCOIN Daily Analysis — 2026-07-31 (Full Archive)
Market Context The broader altcoin market is navigating a cautious, low-conviction environment as BTC dominance holds firm at 54.91% — a level that historically suppresses meaningful altcoin outperformance and keeps risk-off dynamics in play. USDT.D at 8.08% suggests stablecoin sideline capital remains relatively elevated, meaning a decisive rotation into alts has yet to materialize. Block...