
Market Overview
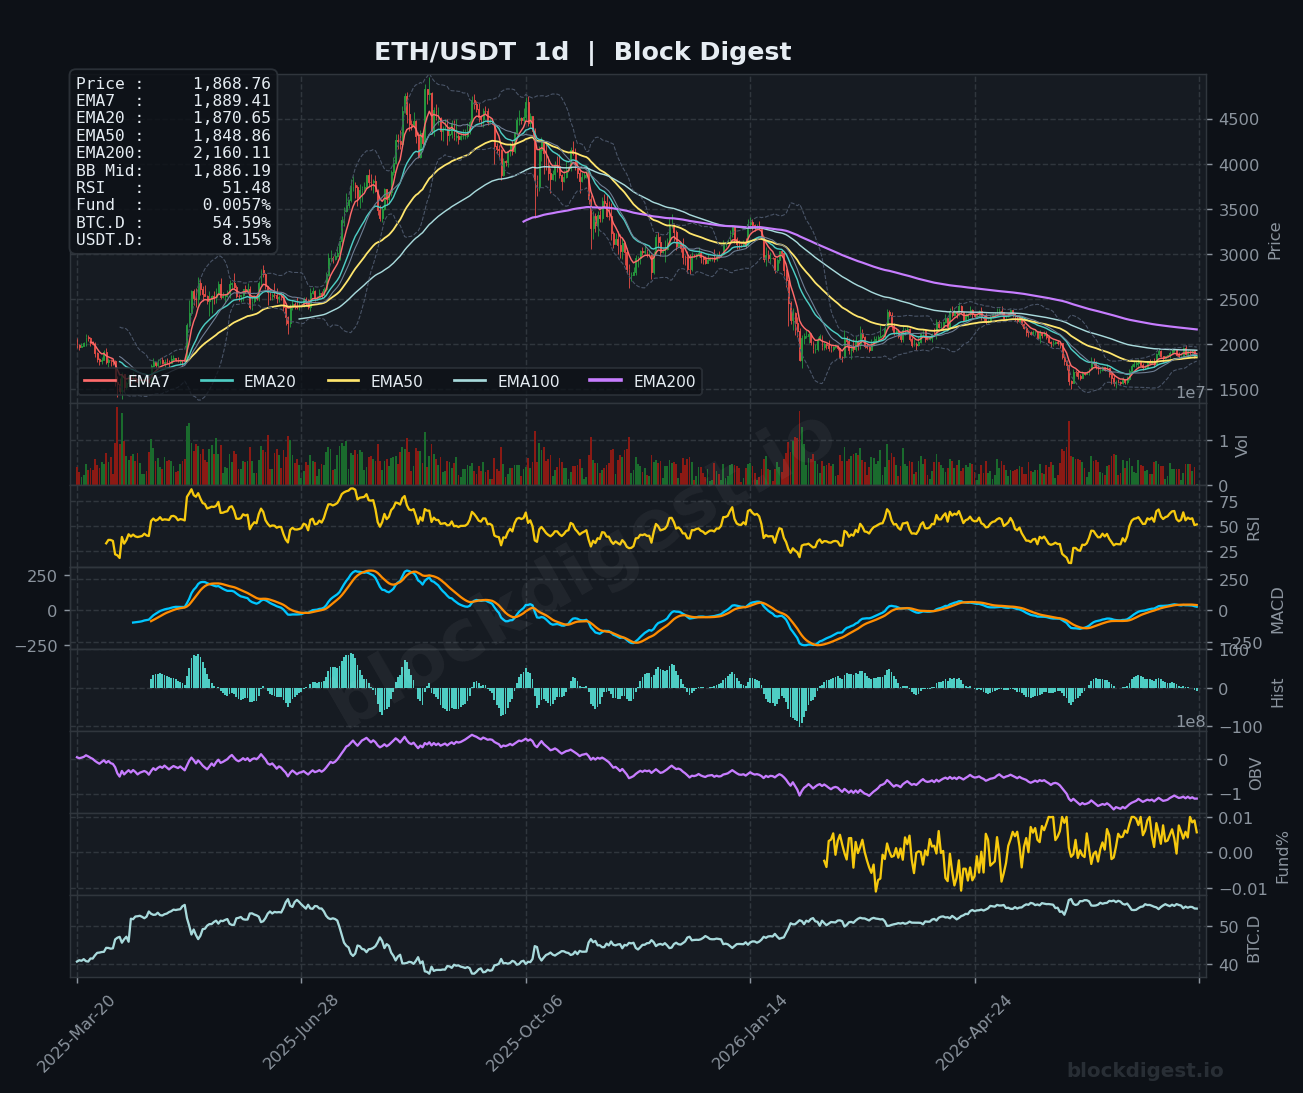
Ethereum is trading at $1,868.76 as of August 1, 2026, registering a decline of approximately 3.18% over the past 24 hours as the broader crypto market enters a cautious phase heading into the new month. On the daily timeframe, price has pulled back beneath the EMA7 ($1,889.41) and is now testing the EMA20 ($1,870.65), while sitting well below the long-term EMA200 at $2,160.11 — a level that has acted as a persistent macro ceiling throughout the current structure. The Bollinger Band midline on the daily chart sits at $1,886.19, and price has slipped just below it, suggesting the recent recovery momentum from the June-July lows is beginning to stall. The daily trend remains structurally bearish on the macro scale, though a tentative base has been building since the early 2026 lows.
Multi-Timeframe Confluence
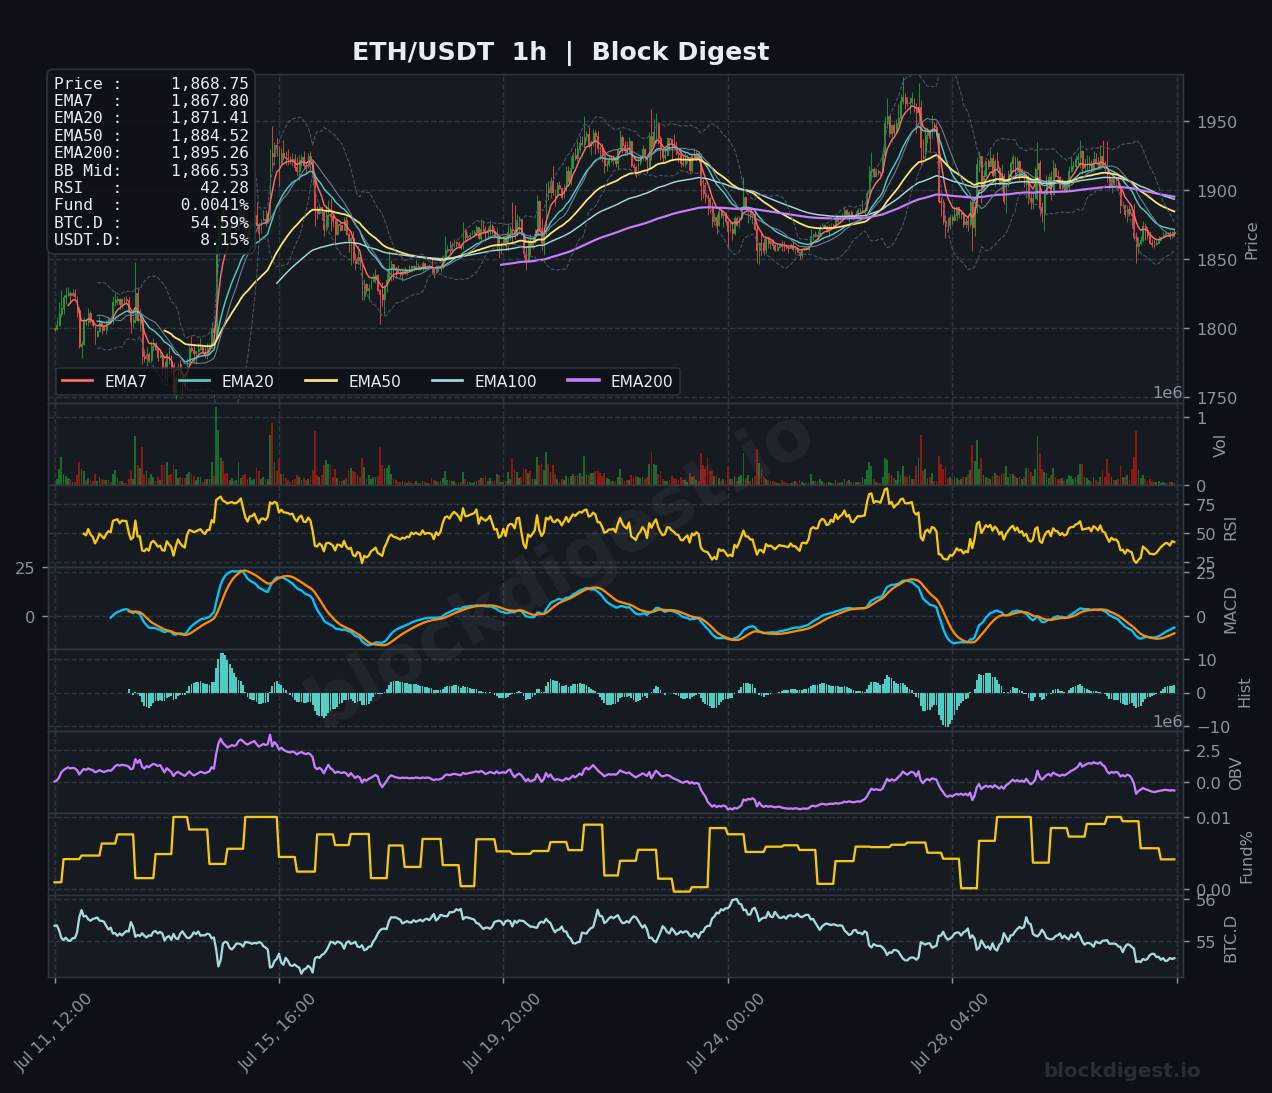
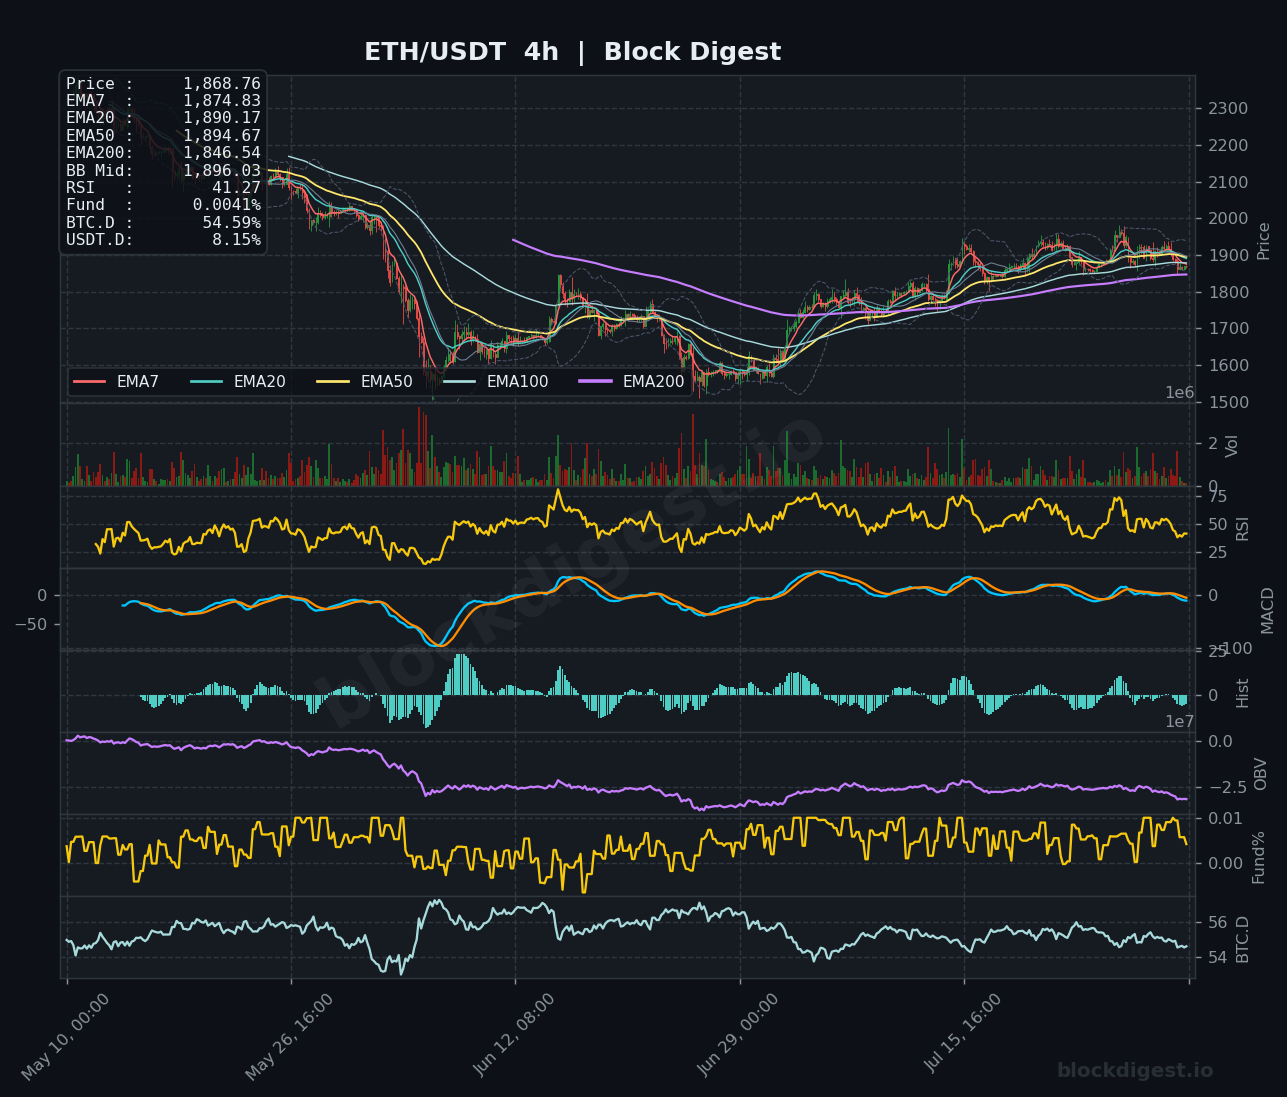
On the 1-hour chart, ETH is trading in a tight cluster between its EMA7 ($1,867.80) and EMA20 ($1,871.41), with all shorter-term EMAs beginning to fan downward beneath a falling EMA50 ($1,884.52) and EMA200 ($1,895.26) — a classic bearish stack that signals distribution rather than accumulation at current levels. The 4-hour chart reinforces this picture: price has rolled below its EMA7 ($1,874.83), EMA20 ($1,890.17), and EMA50 ($1,894.67), with the BB midline at $1,896.03 now acting as overhead resistance. Notably, the 4-hour EMA200 at $1,846.54 represents a key dynamic support below current price — a decisive close beneath it could meaningfully accelerate selling. The daily timeframe shows price still holding above its EMA50 ($1,848.86), which provides a marginal structural support buffer, but the alignment across all three timeframes is increasingly bearish, with short-term momentum squarely contradicting any higher-timeframe recovery thesis.
Key Levels to Watch
- Resistance: $1,884–$1,896 — the convergence of the 1h EMA50, 4h EMA20/EMA50, and the 4h BB midline creates a dense supply zone that capped the most recent bounce attempt
- Resistance: $1,920–$1,940 — prior consolidation ceiling from the late-July range, where multiple rejections have occurred on both the 1h and 4h timeframes
- Resistance: $2,160 — the daily EMA200, which has not been reclaimed since the broader downtrend began; this remains the key macro resistance for any sustained recovery
- Support: $1,846–$1,849 — confluence of the 4h EMA200 and the daily EMA50; a close below both would be a significant technical deterioration
- Support: $1,800 — a psychologically and technically important round-number level, previously tested during the June consolidation trough
- Support: $1,750–$1,760 — the lower Bollinger Band region on the daily chart and proximity to the 2026 structural lows; a breakdown here would mark a full round-trip of the July recovery
Momentum & On-Chain Signals
RSI across timeframes is uniformly weak: 42.28 on the 1-hour, 41.27 on the 4-hour, and 51.48 on the daily — the latter still just barely above neutral but trending lower, echoing the broader deceleration in bullish momentum. Block Digest’s proprietary BD Pulse Score has collapsed to 24/100 (Extreme Bear territory), which is a notable deterioration from the mid-July readings and aligns with the technical breakdown visible across the shorter timeframes. The MACD on both the 1h and 4h charts shows bearish crossovers with negative and contracting histograms, while the 4h OBV has been trending lower since late July, indicative of sustained distribution rather than accumulation. Funding rates remain slightly positive at +0.0064%, suggesting longs are marginally paying shorts — a setup that can accelerate moves to the downside if leveraged longs begin to unwind under pressure.
BTC Dominance & Market Sentiment
BTC dominance currently stands at 54.59%, holding near multi-month highs, which historically correlates with a risk-off rotation away from altcoins including ETH. USDT dominance at 8.15% adds further context — elevated stablecoin positioning suggests participants are sitting on the sidelines rather than deploying capital into risk assets, reinforcing the cautious sentiment heading into August. For ETH specifically, sustained BTC dominance above 54% typically suppresses ETH/BTC appreciation and limits the upside potential for Ethereum even if Bitcoin itself stabilizes.
Risk Scenarios
- Bullish case: A decisive hourly close back above $1,896 (the 4h BB midline and EMA cluster) accompanied by a volume expansion and RSI reclaim above 50 would signal a potential false breakdown, opening a path toward the $1,920–$1,940 resistance zone and potentially a retest of $1,980+.
- Bearish case: A sustained breakdown below $1,846 (4h EMA200 and daily EMA50 confluence) would invalidate the July recovery structure, exposing ETH to a swift move toward $1,800 and subsequently the $1,750–$1,760 range, consistent with a full retracement of the prior rally.
Outlook
The immediate bias for ETH heading into August 1–2 leans cautiously bearish, with price trapped beneath a dense EMA resistance cluster on both the 1-hour and 4-hour charts while the BD Pulse Score at 24/100 confirms that on-chain conditions are not yet supportive of a durable rebound. The most critical trigger to watch in the next 24–48 hours is whether price can hold the $1,846–$1,849 support band — a clean daily close below it would shift the structural outlook decidedly negative. Conversely, bulls need to see a convincing recapture of $1,896 with improving volume and RSI momentum to neutralize the current distribution pattern. Until either of those conditions is met, the path of least resistance remains lower, with range-bound chop between $1,846 and $1,896 the most probable short-term scenario.
—
Disclaimer: This analysis is for informational purposes only and does not constitute financial advice. Cryptocurrency markets are highly volatile and unpredictable. All trading decisions should be made based on your own research and risk tolerance. Block Digest is not responsible for any financial losses incurred as a result of acting on this content.
Stay Ahead of the Market
Follow BlockDigest for crypto market intelligence, research and real-time updates.


