Weekly Market Overview
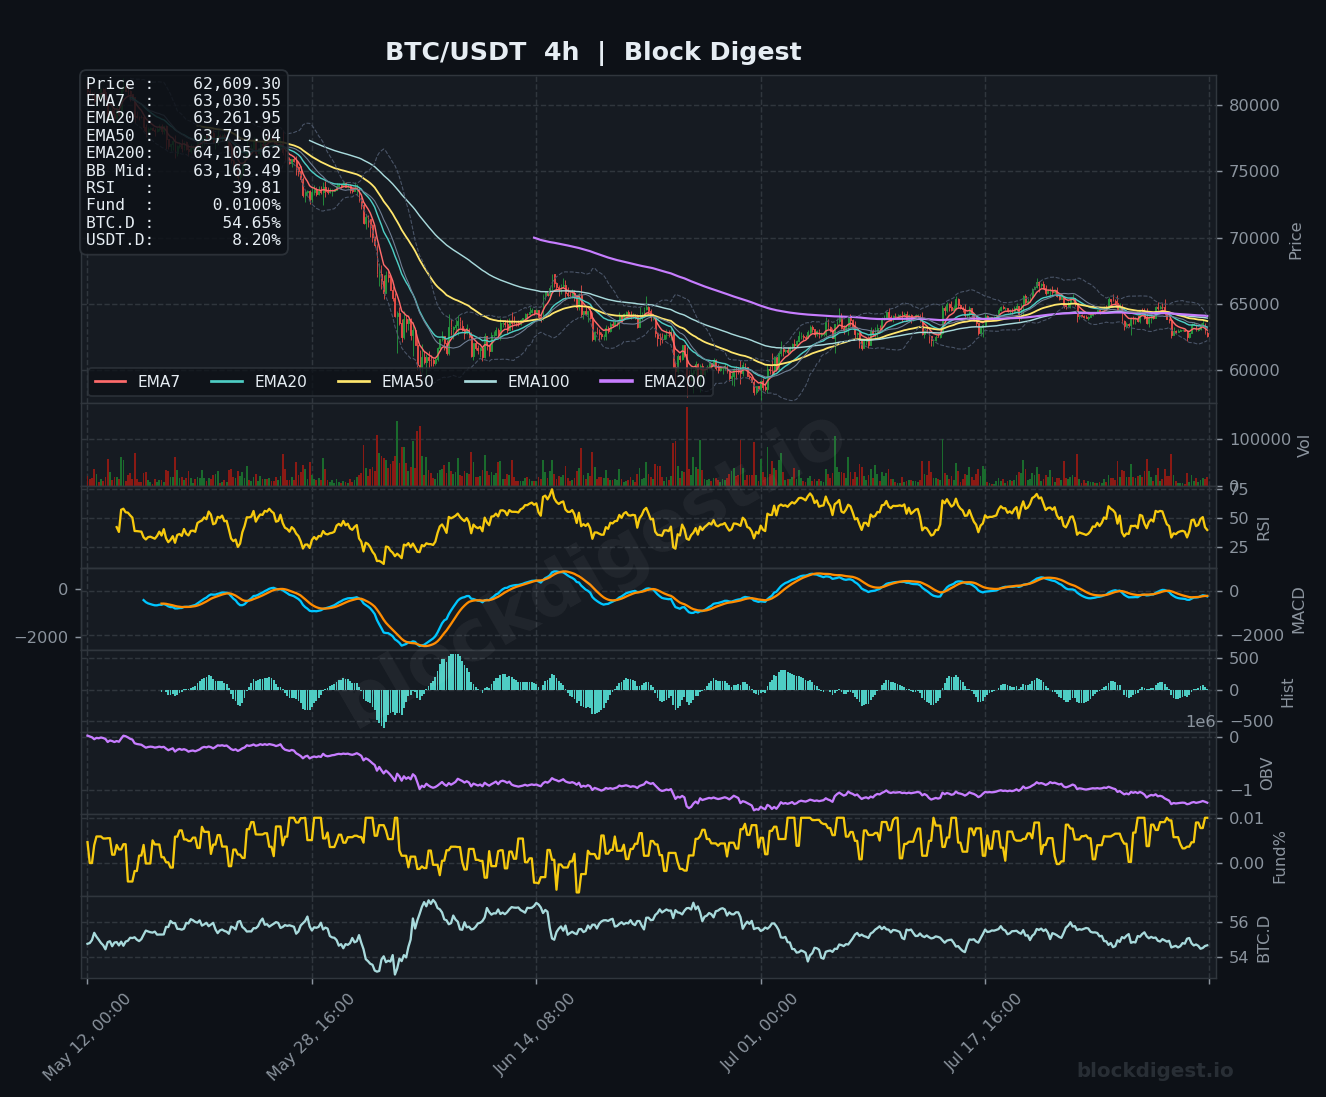
Bitcoin enters August 2026 in a structurally fragile position, trading near $62,609 after a modest July recovery that failed to establish any meaningful higher-high on the weekly timeframe. The week’s price action has been characterized by compression just below a cluster of declining EMAs, with sellers repeatedly asserting control near the $64,000–$65,000 zone. While Bitcoin posted an approximate 8.67% gain over the past 30 days, the rebound has the hallmarks of a relief rally rather than a trend reversal — price remains beneath all major weekly moving averages and has yet to reclaim the Bollinger Band midline at $69,115. The broader structure continues to print lower highs from the cycle peak, and the burden of proof firmly rests with bulls heading into a historically hostile August seasonal window.
Higher Timeframe Structure
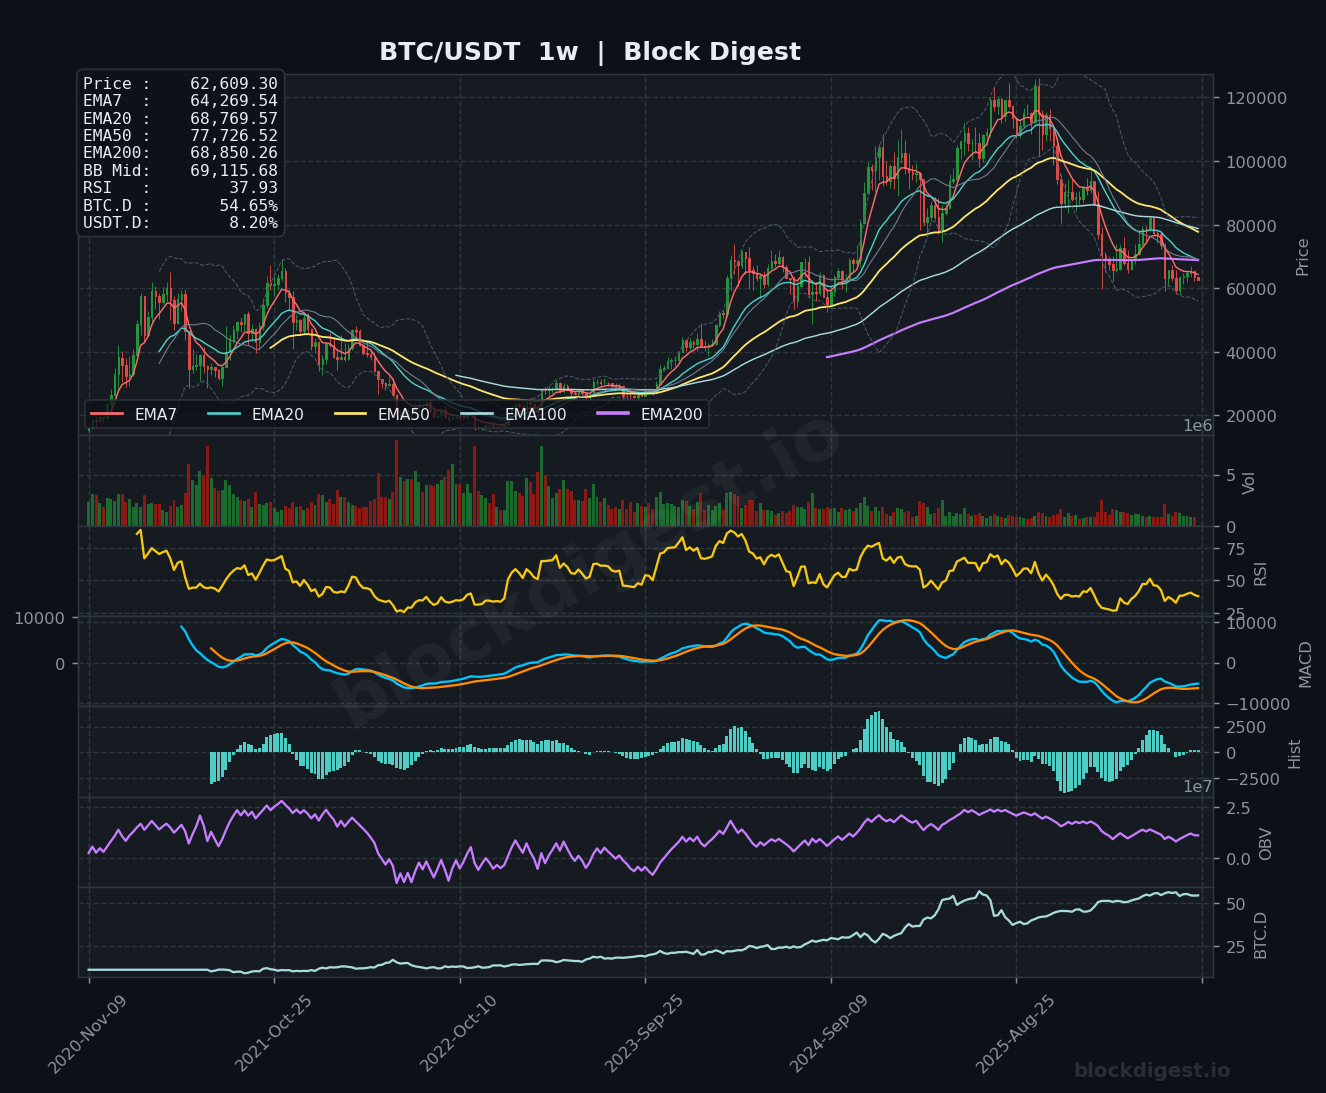
On the weekly chart, the EMA stack is fully bearish and fanned out to the downside: EMA7 at $64,269, EMA20 at $68,769, EMA50 at $77,726, and EMA200 at $68,850 — all sloping lower with price sitting beneath every one of them. This is a textbook bearish EMA alignment reminiscent of the 2022 distribution phase, and the weekly Bollinger Band midline near $69,115 has flipped from support to overhead resistance. Price is currently pressing against the lower half of the weekly Bollinger Band, a region that has historically acted as a gravitational pull toward the lower band expansion during sustained downtrends. The weekly candle structure shows a series of overlapping, low-conviction closes — characteristic of a market lacking directional commitment but skewed to the downside given the macro EMA configuration.
Multi-Timeframe Confluence
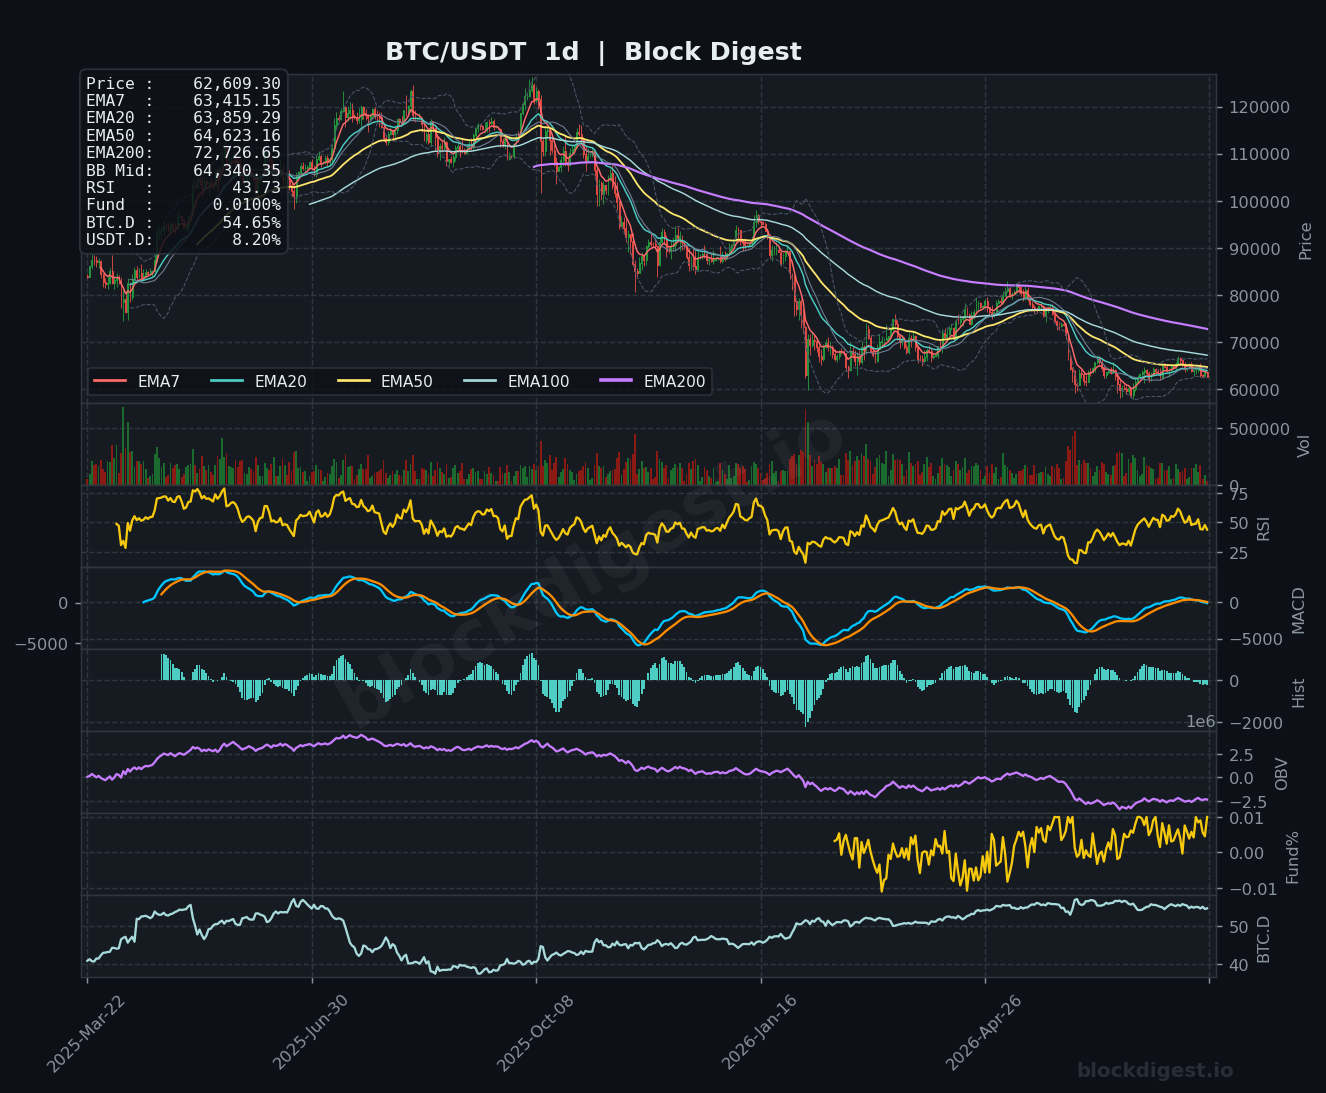
Across all three timeframes, the picture is unified in its bearishness: the daily chart shows price trading below EMA7 ($63,415), EMA20 ($63,859), EMA50 ($64,623), and EMA200 ($72,726), with the 4-hour chart mirroring this alignment almost identically. The $63,000–$64,600 zone represents a dense cluster of converging EMAs on both the daily and 4-hour frames, making it the most critical near-term resistance band — a zone that has capped every meaningful intraweek rally attempt. Intraweek momentum on the 4-hour is slightly constructive off the $60,000 lows but lacks the volume and follow-through needed to challenge this overhead EMA wall with conviction, leaving the weekly bearish thesis intact.
Key Weekly Levels
- Weekly Resistance: $64,000–$64,600 (converging 4h/daily EMA cluster and prior consolidation ceiling); $68,769–$69,115 (weekly EMA20 and Bollinger Band midline — key macro resistance); $72,726 (daily EMA200, major structural level bulls must reclaim to shift trend)
- Weekly Support: $61,500–$62,000 (near-term demand zone that has provided short-term bounces and aligns with horizontal price congestion); $59,500–$60,000 (critical macro support — multi-test floor since the June low, loss of which opens deeper downside); $56,000–$57,000 (next significant weekly demand zone and prior consolidation from the 2025 accumulation range)
Momentum & Volume Analysis
The weekly RSI at 37.93 is approaching, but has not yet confirmed, oversold territory — a level that historically has preceded at minimum short-term relief but does not guarantee trend reversal in the absence of structural improvement. Our proprietary BD Pulse Score sits at a deeply depressed 23/100 (Extreme Bear), corroborating what the RSI is signaling: this market is under sustained selling pressure with no momentum recovery in sight. The OBV trend registers at -1 on the BD Pulse framework, consistent with what the weekly and daily OBV lines show — a persistent downward slope indicating that volume on down days continues to outpace buying volume, a classically bearish accumulation signal. On the funding rate front, the current reading of +0.0066% is mildly positive but effectively neutral, suggesting the market is not yet leaning aggressively long — a condition that removes the risk of a short-squeeze catalyst but also indicates no speculative excess is building to the upside.
BTC Dominance & Altcoin Implications
BTC dominance at 54.65% remains elevated and has been trending sideways-to-slightly-lower off recent highs, suggesting that while Bitcoin bleeds, altcoins are not yet seeing meaningful capital rotation — a pattern more consistent with broad risk-off behavior than a healthy altcoin season. USDT dominance holding at 8.20% reflects that a significant portion of the market remains parked in stablecoins, indicating caution rather than active deployment into risk assets. Until BTC.D breaks decisively lower with price strength — rather than weakness — any altcoin outperformance is likely to be short-lived and selective rather than a broad market rally.
Risk Scenarios
- Bull case: A decisive 4-hour close above $64,600, followed by a daily close above $65,000, would begin to shift short-term momentum and could trigger a squeeze toward the $68,769–$69,115 weekly EMA20/BB midline cluster. Sustained holding above that band, combined with an RSI reclaim above 50 on the weekly, would open the path toward analyst targets in the $74,000–$80,000 range and represent a genuine trend-shift signal.
- Bear case: Failure to hold the $61,500–$62,000 support zone on a weekly closing basis would confirm the resumption of the downtrend, with the next logical target at the $59,500–$60,000 macro floor. A weekly close beneath $60,000 would be a high-conviction bearish signal, aligning with analyst forecasts for a retest of the $58,000 range and potentially exposing the $56,000–$57,000 demand zone.
Weekly Outlook
The directional bias for the week ahead is cautiously bearish with a tight watch on the $61,500–$62,000 support floor — the level that has defined the lower boundary of the July recovery and must hold to prevent a more significant drawdown. The dense EMA resistance between $63,000 and $64,600 is the immediate ceiling, and without a catalyst strong enough to break that band on meaningful volume, rallies into that zone should be treated as distribution opportunities rather than breakout setups. Historically, August has been one of Bitcoin’s weakest seasonal months, averaging a -10% decline over the past four years, and with the BD Pulse Score at Extreme Bear (23/100) and OBV trending negative, the path of least resistance remains to the downside. Key catalysts to monitor this week include any macroeconomic data that could shift the broader risk-on/risk-off tone, as well as whether BTC dominance begins to roll over decisively — which would signal either an alt-season rotation or, more likely given current conditions, a market-wide deleveraging event. Risk management remains paramount: the reward-to-risk for new long positions is unfavorable until price either confirms the $60,000 floor with strong reclaim candles or breaks the EMA cluster overhead with volume.
Disclaimer: This analysis is for informational purposes only and does not constitute financial advice. Cryptocurrency markets are highly volatile and unpredictable. All trading decisions should be made based on your own research and risk tolerance. Block Digest is not responsible for any financial losses incurred as a result of acting on this content.
Stay Ahead of the Market
Follow BlockDigest for crypto market intelligence, research and real-time updates.