Macro Market Overview
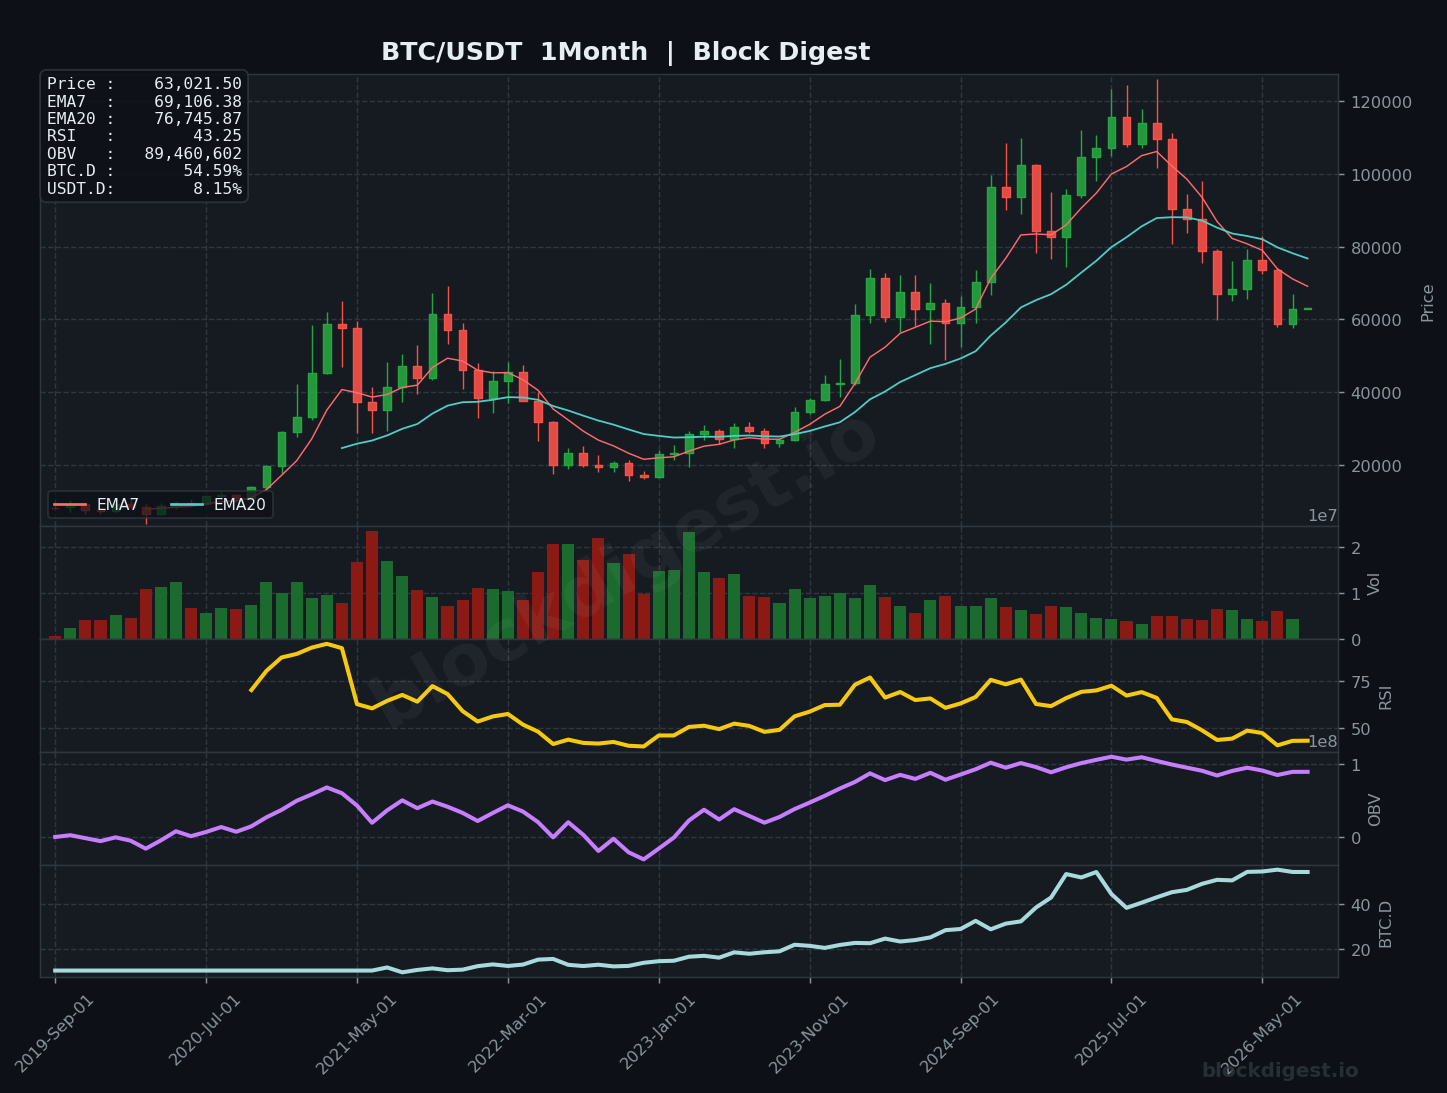
Bitcoin enters August 2026 trading near $63,021, firmly below its all-time high territory and navigating what the monthly chart reveals as a clear post-peak distribution phase. The current monthly candle structure shows a sequence of lower highs following the cycle top established above $109,000, with price now testing the lower bounds of the broader macro range that defined the 2024–2025 bull run. On the monthly timeframe, BTC has now closed red for several consecutive months, a pattern historically associated with the middle innings of a bear cycle rather than its terminal phase. The monthly EMA7 ($69,106) and EMA20 ($76,745) are both in bearish alignment above current price, acting as a dual overhead resistance structure that will require sustained buying pressure to reclaim. Contextually, August has historically been Bitcoin’s weakest calendar month — a seasonal headwind that compounds the already fragile technical backdrop entering this period.
Long-Term Trend Structure
On the monthly chart, the EMA7 ($69,106) has decisively crossed below the EMA20 ($76,745), a bearish signal that on prior cycles has preceded extended consolidation or further drawdown before a meaningful recovery phase initiated. The Bollinger Bands on the monthly frame have begun to contract slightly after an extended period of expansion from the cycle high, suggesting volatility may compress before the next directional resolution. Price is currently trading below the monthly Bollinger Band midline, which reinforces the distribution-to-markdown narrative visible across the past several months of candle structure. Historically, the $58,000–$62,000 zone served as significant resistance during the 2021 cycle and transitioned into support during the 2024 markup — this zone now represents the critical macro floor that bulls must defend. From a cycle phase perspective, the evidence leans toward a mid-bear markdown phase, though the depth relative to cycle highs (~42% drawdown from peak) remains less severe than either the 2018 or 2022 cycle corrections at equivalent temporal distances from their respective tops.
Weekly Timeframe Context
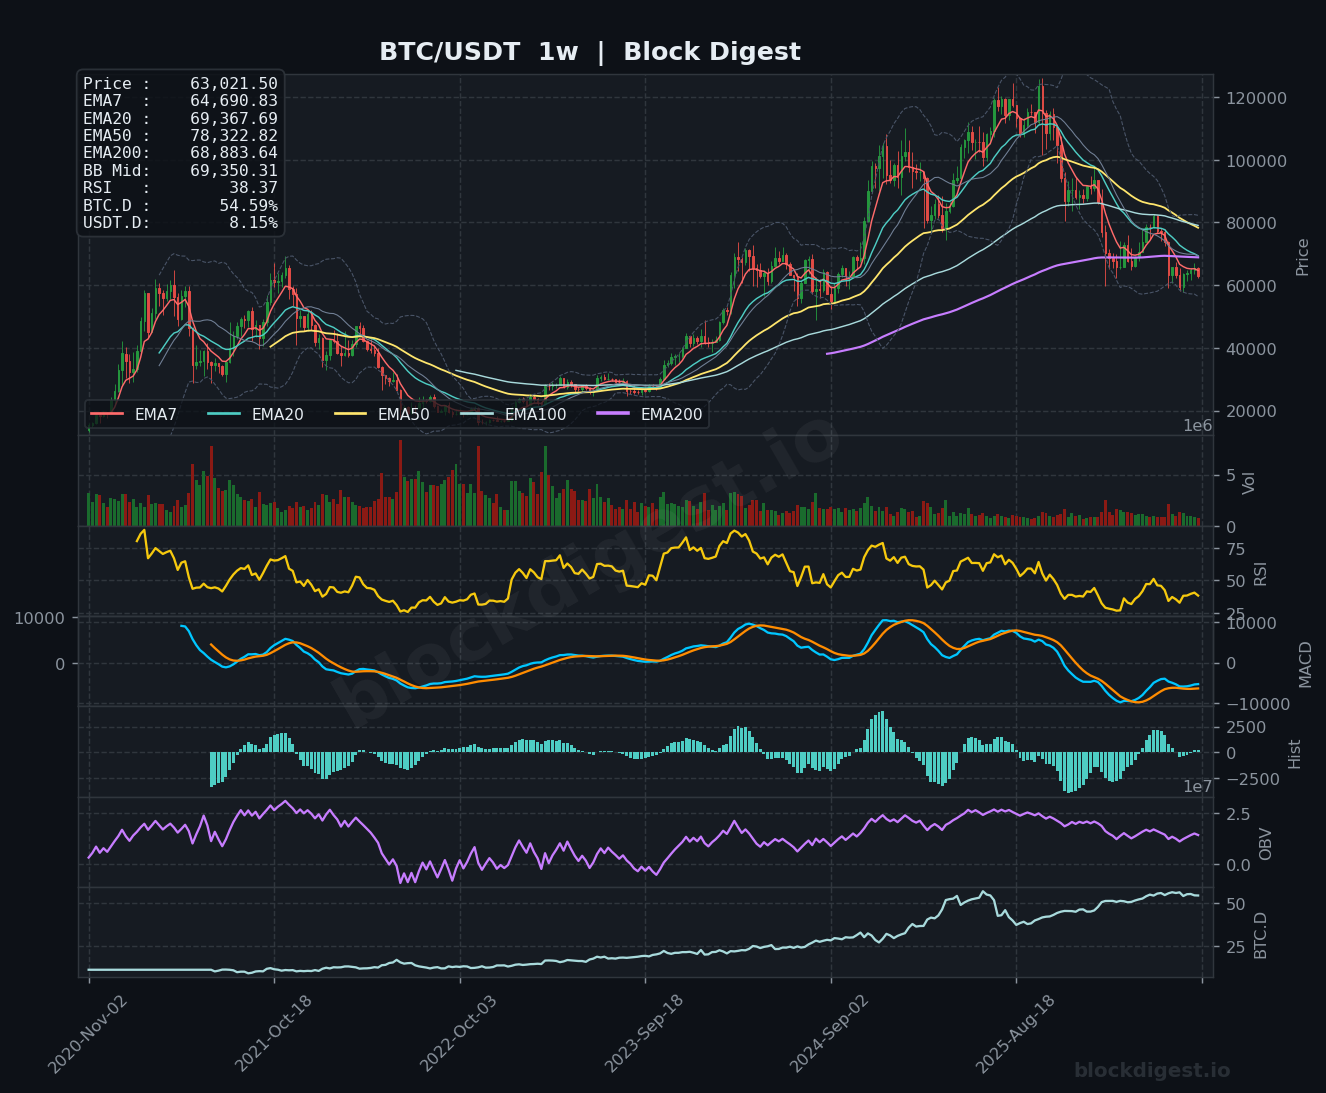
The weekly chart presents a bearish EMA stack, with price trading well below the EMA20 ($69,367), EMA50 ($78,322), and EMA200 ($68,883) — the latter of which capped the most recent recovery attempt as resistance. The weekly EMA7 ($64,690) sits just above current price, and a failure to reclaim and hold this level through August would likely open the door toward a retest of the $58,000–$60,000 demand zone established in recent months. Weekly Bollinger Bands remain wide relative to historical norms, implying that the volatility expansion from the distribution phase has not fully exhausted itself. The weekly structure does not yet offer a constructive base pattern — there is no clear higher-low sequence forming — which challenges any near-term bullish monthly thesis and suggests the macro trend remains in consolidation at best.
Key Macro Levels
- Major Resistance: $69,000–$69,500 (weekly EMA200 and monthly EMA7 confluence); $76,700–$77,000 (monthly EMA20, former cycle support flipped resistance); $80,000–$81,500 (psychological round number and prior consolidation zone); $88,000–$90,000 (significant supply zone from the distribution top structure)
- Major Support: $62,000–$63,000 (current price area; monthly lower structure and former 2024 breakout zone); $58,000–$60,000 (major demand confluence, weekly Bollinger Band lower boundary and late-cycle accumulation zone from prior months); $52,000–$53,000 (2024 pre-halving consolidation base and long-term macro support); $40,000–$42,000 (deep cycle support, monthly EMA20 macro floor zone if cycle deterioration accelerates)
Momentum & Accumulation Analysis
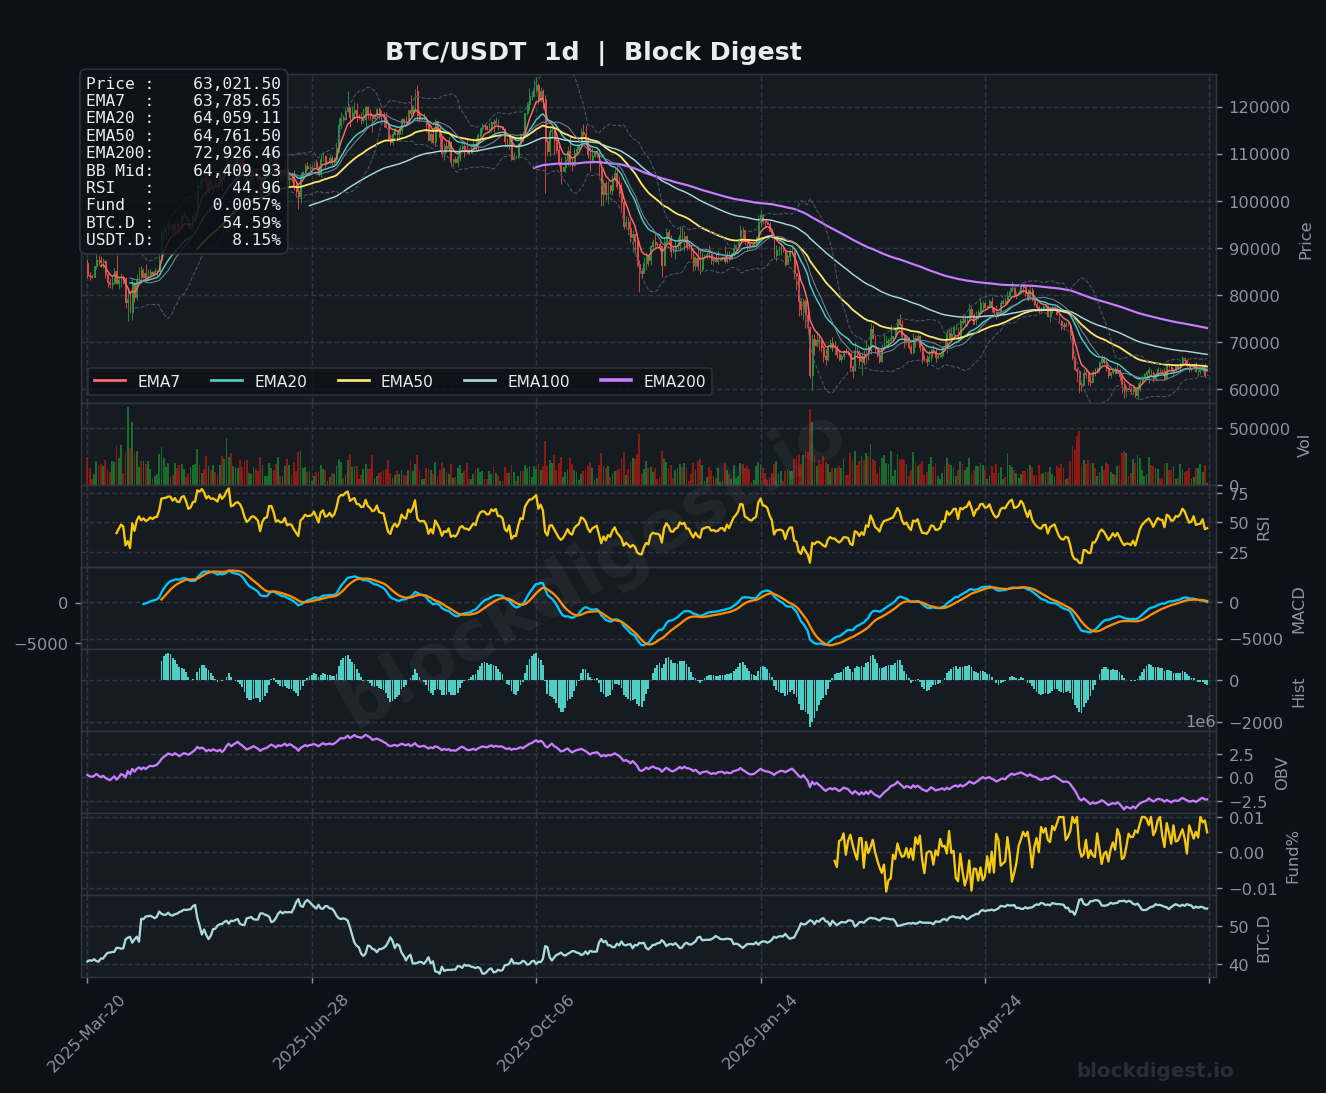
The monthly RSI at 43.25 is approaching oversold territory when viewed through the lens of prior cycle troughs — during the 2022 bear market, monthly RSI bottomed in the 30–35 range before meaningful accumulation began, suggesting there may still be modest downside momentum available before exhaustion is confirmed. Our proprietary BD Pulse indicator reinforces this caution: the BD Pulse Score sits at just 28/100 (Bearish), with the BD Extreme Index registering -1.27σ — a reading that places price firmly in oversold territory on a normalized basis, though oversold does not guarantee an immediate reversal. On the monthly OBV, the trend has been declining since the cycle peak, indicating that net selling volume has outpaced buying across the distribution phase — a pattern consistent with institutional distribution rather than accumulation. The daily MACD remains negative, with histogram bars still below zero, though the weekly MACD shows early signs of convergence between the signal and MACD lines — a development worth monitoring as a potential precursor to a momentum shift if sustained. Funding rates at +0.0061% remain mildly positive, reflecting the modest long bias in the market without indicating excessive leverage — a neutral reading that neither confirms a squeeze setup nor a capitulation floor.
BTC Dominance – Cycle Context
Bitcoin dominance at 54.59% remains elevated by post-2021 standards and has been in a broad ascending trend throughout the current cycle, reflecting ongoing capital rotation away from altcoins and into BTC as the risk-adjusted preference during periods of macro uncertainty. Historically, BTC dominance peaks in the mid-to-late stages of a bear cycle before declining sharply as capital rotates into altcoins during early bull phases — the current level does not yet signal that an altseason is imminent. USDT dominance at 8.15% remains notably elevated, indicating that a substantial portion of crypto capital remains sidelined in stablecoins, which is a double-edged signal: it represents latent buying power that could fuel a recovery, but also reflects investor defensiveness and a reluctance to commit to risk assets at current levels. Until BTC dominance begins a sustained structural decline and USDT dominance meaningfully compresses, the macro environment is unlikely to support a broad altcoin recovery cycle.
Risk Scenarios
- Bull case: A Federal Reserve pivot toward rate cuts or clearer crypto-favorable U.S. legislation could reignite institutional inflows, pushing BTC back through the $69,000 EMA cluster and targeting a reclaim of $76,700–$80,000 by quarter-end. A sustained weekly close above the EMA200 ($68,883) would represent the first credible technical signal of trend reversal on the macro timeframe. Should this scenario materialize, the longer-term measured move from the cycle structure points toward a full retest of the $88,000–$90,000 supply zone within the following two to three months.
- Bear case: Continued deterioration in macro conditions — persistent Fed hawkishness, weakening ETF inflows (already down 83% from July peak levels), or a breakdown in risk appetite correlated with the S&P 500 — could see price fail the $62,000–$63,000 current support and target the $58,000–$60,000 demand zone. A monthly close below $58,000 would represent a significant macro structural break, opening the path toward $52,000–$53,000 and raising the probability of a cycle low extension. In this scenario, the monthly RSI would likely approach the 30–35 range that historically marks terminal bear phase exhaustion.
Monthly Outlook
August 2026 presents a technically precarious setup for Bitcoin, with price trapped below a converging wall of monthly and weekly EMAs while seasonal headwinds historically weigh on performance — the month’s median return of -7.87% across prior cycles is a statistic that the current technical structure does not contradict. The macro directional bias remains cautiously bearish to neutral, with the burden of proof firmly on the bulls to reclaim $69,000 on a sustained weekly basis before any higher-timeframe trend reversal can be declared. The key conditions to monitor this month are: Federal Reserve communications following any economic data releases, the trajectory of spot ETF inflows after their sharp July deceleration, and whether price can hold the $62,000–$63,000 macro floor under any renewed selling pressure. A consolidation range of $60,500–$69,000 appears the most probable near-term outcome, consistent with the broader consensus of ranging rather than trending conditions. The overall macro setup is one of a market in a corrective markdown phase, searching for a durable accumulation floor — the BD Extreme Index at -1.27σ suggests conditions are approaching historically significant oversold levels, but confirmation of a genuine cycle bottom will require both on-chain and price structure evidence that has not yet emerged.
Disclaimer: This analysis is for informational purposes only and does not constitute financial advice. Cryptocurrency markets are highly volatile and unpredictable. All trading decisions should be made based on your own research and risk tolerance. Block Digest is not responsible for any financial losses incurred as a result of acting on this content.
Stay Ahead of the Market
Follow BlockDigest for crypto market intelligence, research and real-time updates.