
Author: BD Research Desk
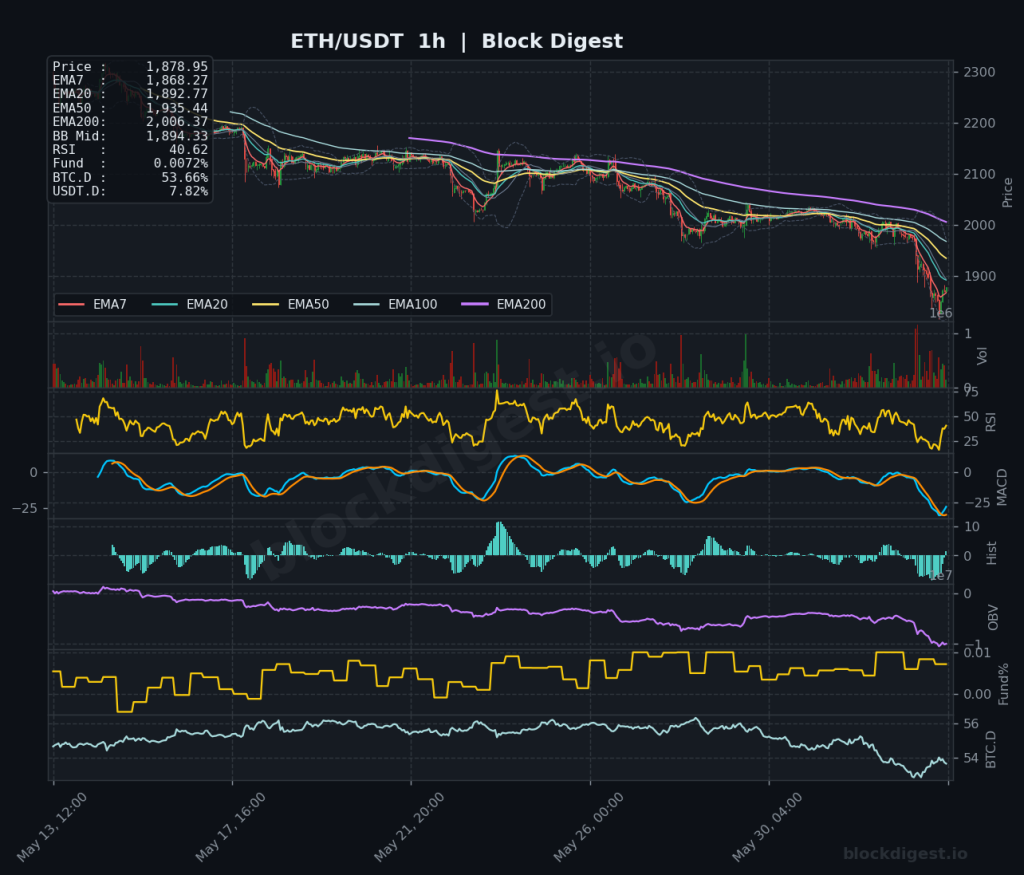
Ethereum Daily Analysis: ETH Falls Below Key EMAs at $1,878
Market Overview ETH/USDT is trading at $1,878.84–$1,878.95 as of June 3, 2026, extending a sharp multi-week decline that has pushed price well below all major exponential moving averages on every timeframe. On the daily chart, ETH sits beneath the EMA7 ($1,959.26), EMA20 ($2,058.10), EMA50 ($2,148.80), and the EMA200 ($2,482.58), confirming a deeply bearish macro structure....
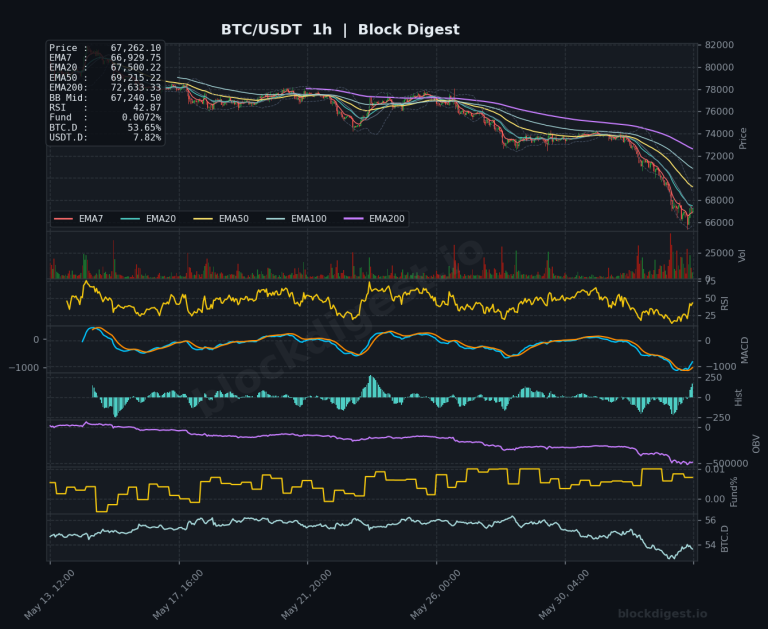
Bitcoin Daily Analysis: Bitcoin Breaks Below Key EMAs at $67,262
Market Overview Bitcoin is trading at approximately $67,262 as of June 3, 2026, down roughly 7% over the past 24 hours and sitting well below all key exponential moving averages across the daily timeframe. On the 1D chart, price has broken decisively beneath the EMA7 ($70,785), EMA20 ($74,098), EMA50 ($75,305), and EMA200 ($80,814), confirming a...
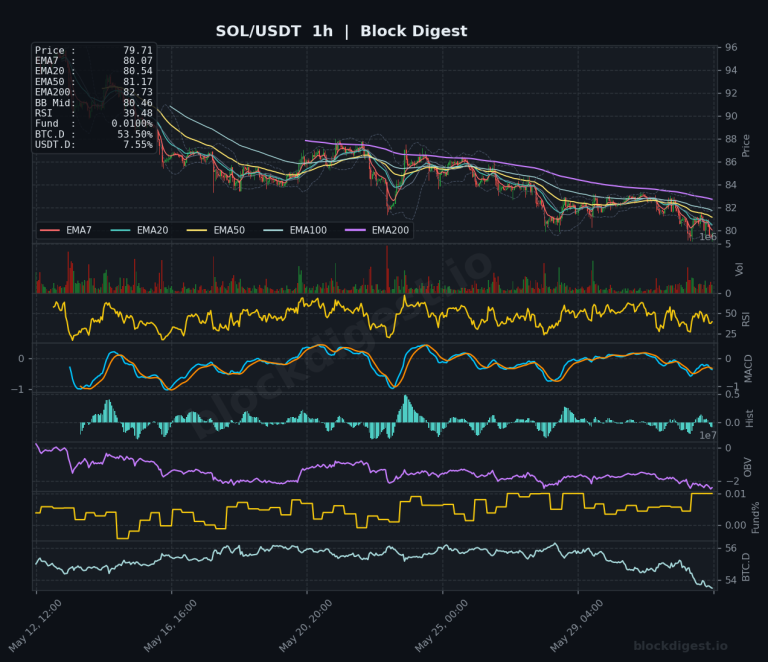
Altcoin Daily Analysis: Bitcoin Dominance at 53.50%, Altcoins Face Distribution Pressure
Market Context Bitcoin dominance sits at 53.50%, reflecting a continued rotation dynamic where BTC maintains a commanding share of total market cap, limiting meaningful altcoin outperformance in the near term. USDT dominance at 7.55% signals that a significant portion of capital remains parked on the sidelines, indicating cautious risk appetite rather than aggressive deployment into...
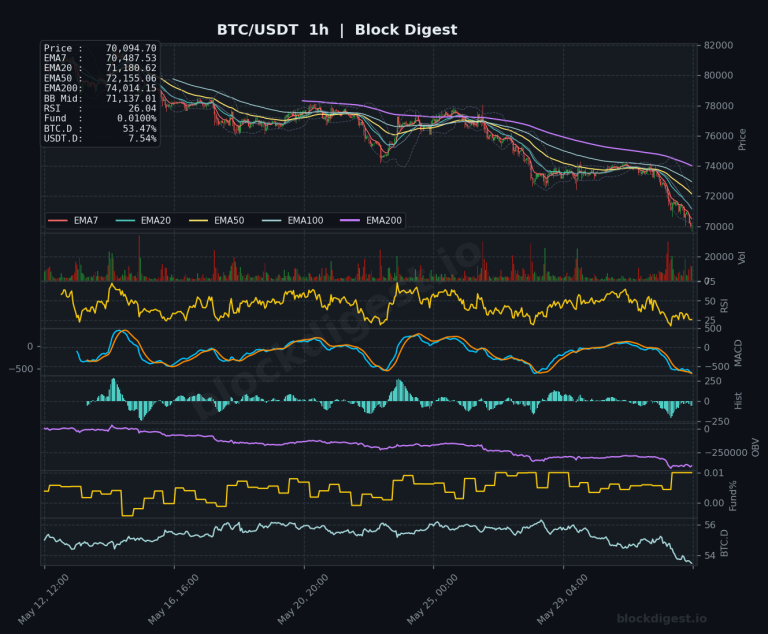
Bitcoin Daily Analysis: Support at $70K as EMAs Break Bearish
Market Overview Bitcoin is trading at approximately $70,094–$70,102, pressing against a critical psychological support zone as sellers maintain firm control of price action. On the daily timeframe, BTC has broken decisively below all major EMAs — with the EMA7 at $72,801, EMA20 at $75,138, EMA50 at $75,766, and the EMA200 sitting far above at $80,978...
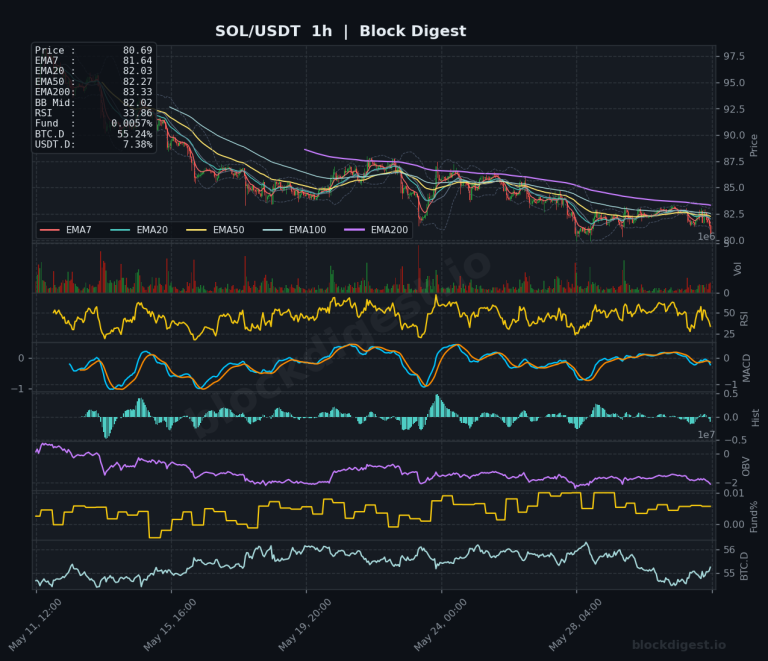
Altcoin Daily Analysis: Bitcoin Dominance at 55.24% Pressures Altcoins
Market Context Bitcoin dominance sits at 55.24% as of June 1, 2026, reflecting continued BTC-led market conditions that have weighed heavily on altcoin performance across the board. USDT dominance at 7.38% signals a meaningful degree of risk aversion still present in the market, with capital parked in stablecoins rather than rotating aggressively into alts. The...
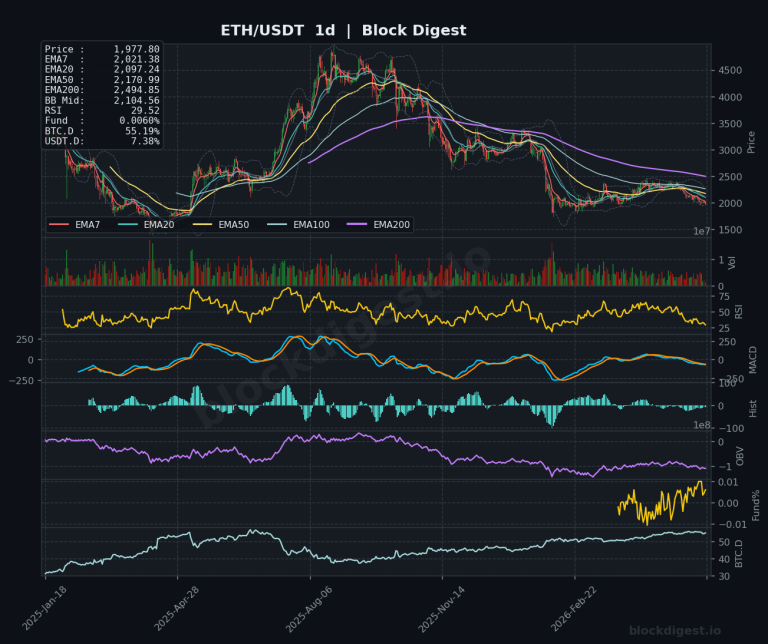
Ethereum Monthly Analysis: Ethereum Breaks Below $2,000 Monthly Close
Macro Market Overview Ethereum enters June 2026 trading near $1,977, printing what amounts to a sobering sub-$2,000 close on the monthly candle — a psychologically significant breakdown that underscores the severity of the ongoing correction from the cycle highs near $4,000 reached in late 2024. The monthly candle structure over the past several months has...
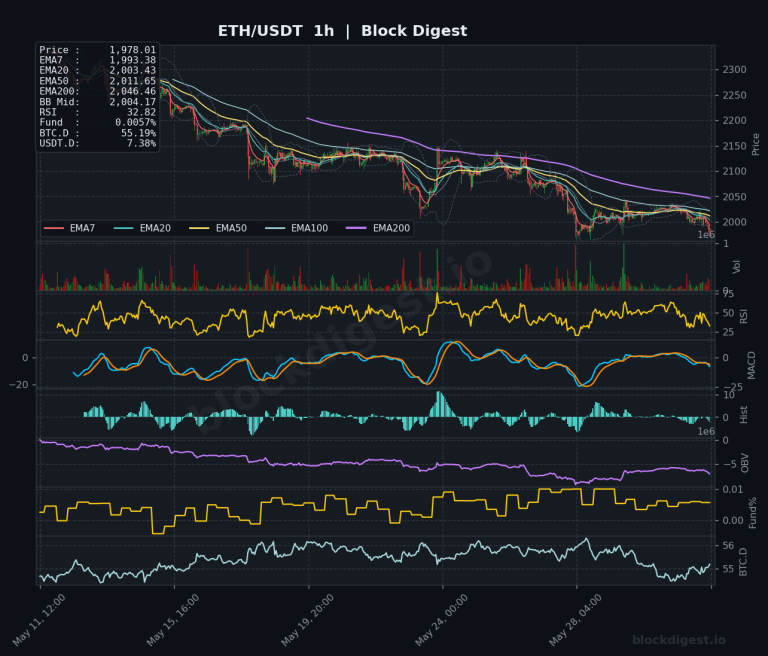
Ethereum Daily Analysis: ETH Tests $2,000 Level Below EMA Stack
Market Overview ETH/USDT is trading at $1,977.80–$1,978.01, sitting firmly below all major EMAs across every timeframe — a structurally bearish configuration. On the daily chart, price has been in a pronounced downtrend since the highs above $4,000, and is currently testing the psychologically significant $2,000 level from below, with the Bollinger Band midline at $2,104.56...
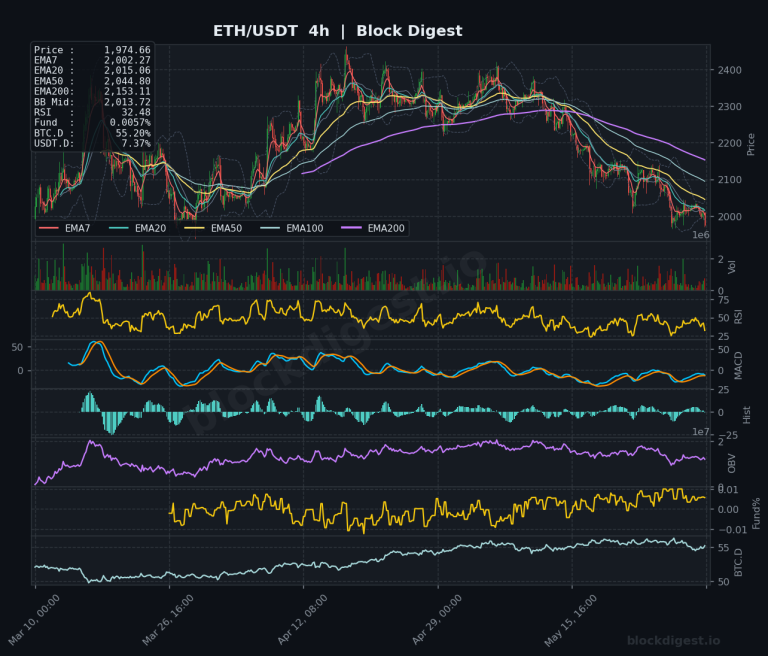
Ethereum Weekly Analysis: Ethereum Breaks Below $2,000 Resistance Level
Weekly Market Overview Ethereum closed the week trading just below the psychologically critical $2,000 level, with price printing at approximately $1,975 on the weekly chart — a level that has served as a pivotal macro reference point across multiple market cycles. The weekly candle reflects continued distribution pressure, extending a downtrend that began following the...
Bitcoin Monthly Analysis: Bitcoin at $72,783 amid sustained distribution phase
Macro Market Overview Bitcoin closes May 2026 trading around $72,783, a price level that carries significant historical weight as it previously represented the all-time high from the 2021 cycle peak before being comprehensively surpassed during the 2024-2025 bull run. The monthly candle structure over the past several months reveals a sustained distribution and markdown phase...
Bitcoin Weekly Analysis: Bitcoin Tests Critical Zone Below $75K
Weekly Market Overview Bitcoin enters the first week of June 2026 in a notably vulnerable technical position, with price trading at approximately $72,783 — well below the key psychological $75,000 level and sitting beneath all major short-term EMAs on the weekly chart. The weekly candle structure reflects continued distribution pressure following a prolonged decline from...
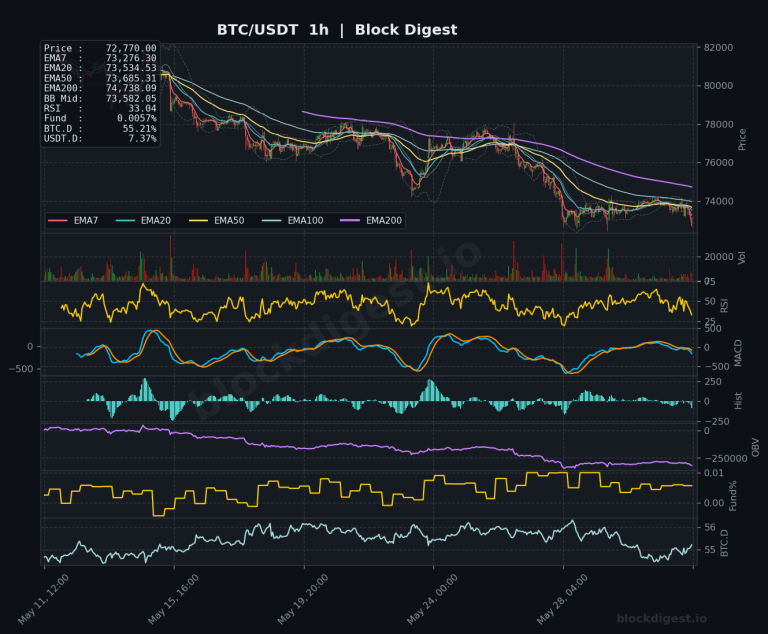
Bitcoin Daily Analysis: Bitcoin Below All EMAs at $72,770
Market Overview Bitcoin is currently trading at approximately $72,770, sitting beneath every major EMA across all timeframes — a structurally bearish configuration that has persisted for several weeks. On the daily chart, price is printing below the EMA7 ($74,045), EMA20 ($75,800), EMA50 ($76,051), and the EMA200 ($81,123), confirming a well-established downtrend from the October 2025...
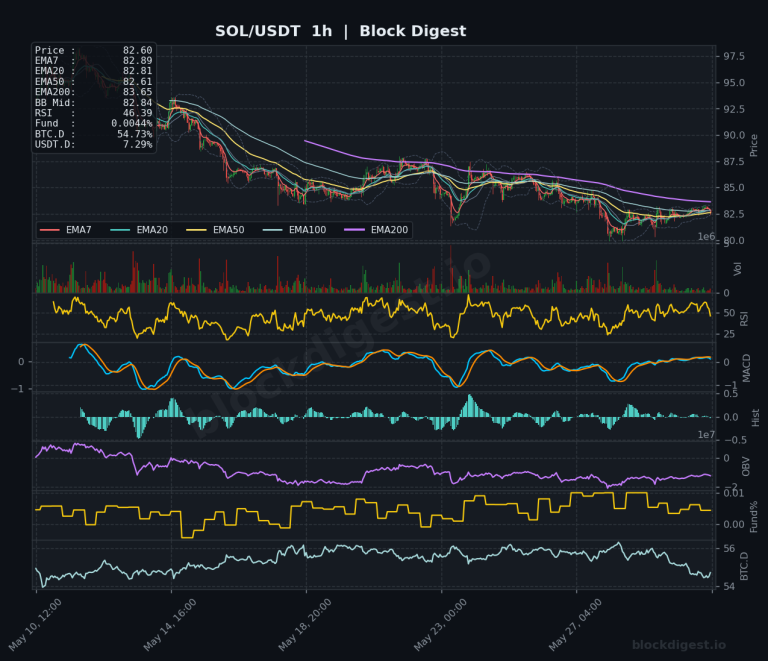
Altcoin Daily Analysis: BTC Dominance 54.73%, Altcoin Rotation Stalled
Market Context The broader altcoin market is navigating a challenging environment as BTC dominance holds firm at 54.73%, continuing to absorb capital that might otherwise rotate into majors and mid-caps. USDT.D at 7.29% reflects a modest but persistent defensive posture among participants, suggesting risk appetite remains selectively cautious rather than broadly expansive. The divergence between...