
Author: BD Research Desk
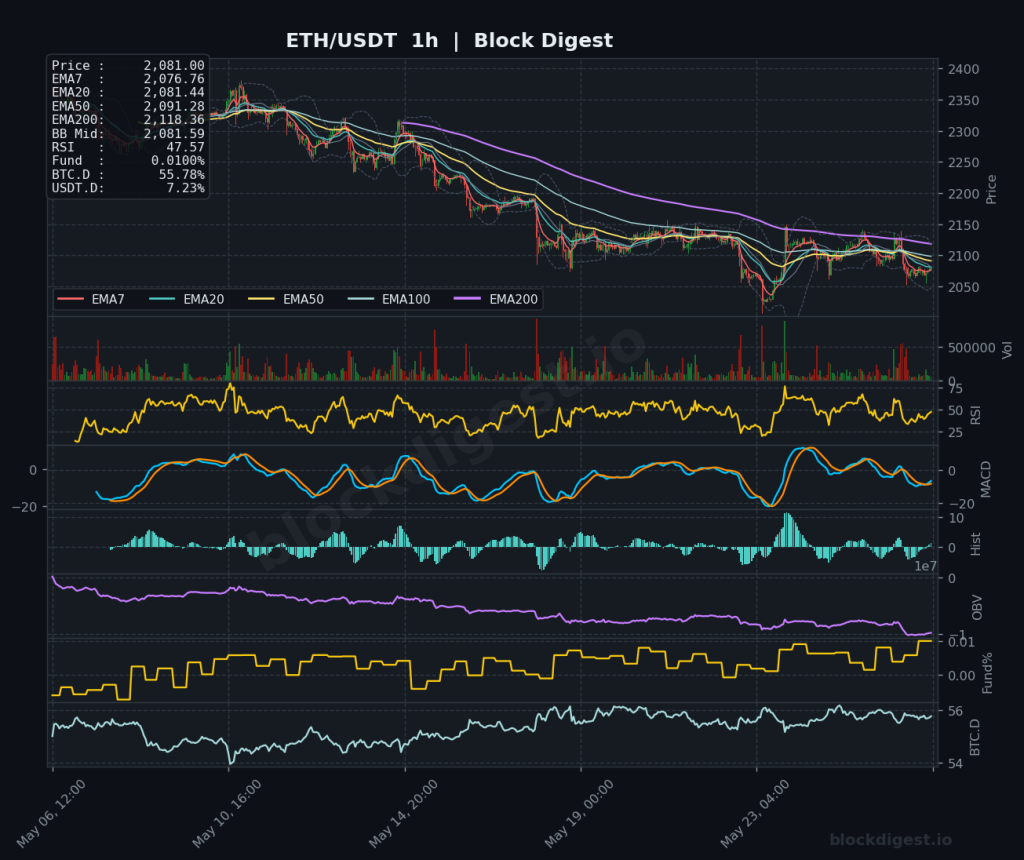
Ethereum Daily Analysis: ETH Below All Daily EMAs at $2,080
Market Overview ETH/USDT is trading at $2,080.56 as of May 27, 2026, sitting in a structurally weakened position across all major timeframes. Price is trading below every significant daily EMA — the EMA7 at $2,101.04, EMA20 at $2,163.12, EMA50 at $2,209.97, and the EMA200 at $2,519.36 — confirming a well-established bearish trend on the daily...
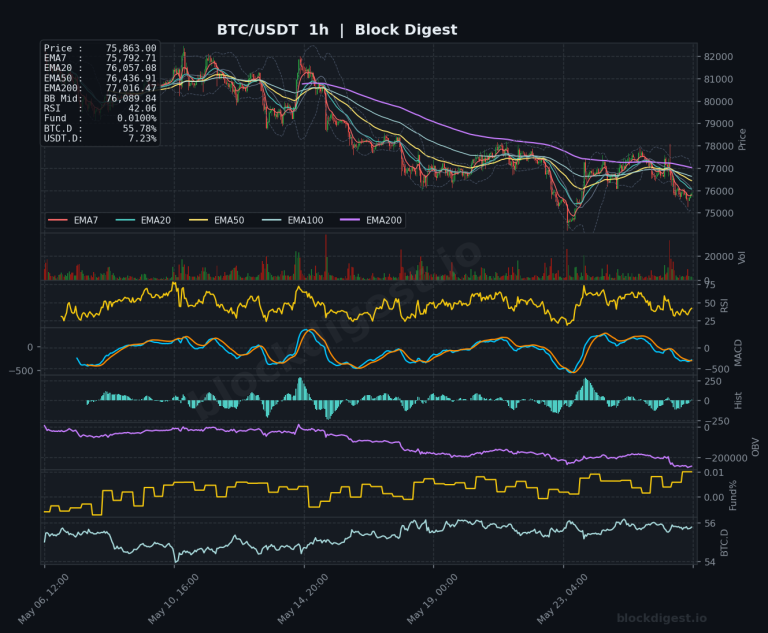
Bitcoin Daily Analysis: BTC at $75.8K Below Bearish EMA Stack
Market Overview Bitcoin is trading at $75,863 as of May 27, 2026, sitting in a technically precarious position well below its all-time high of $126,272 reached in October 2025. Price action on the daily timeframe reflects a prolonged corrective structure, with BTC trading beneath its EMA7 ($76,598), EMA20 ($77,477), EMA50 ($76,684), and significantly below the...
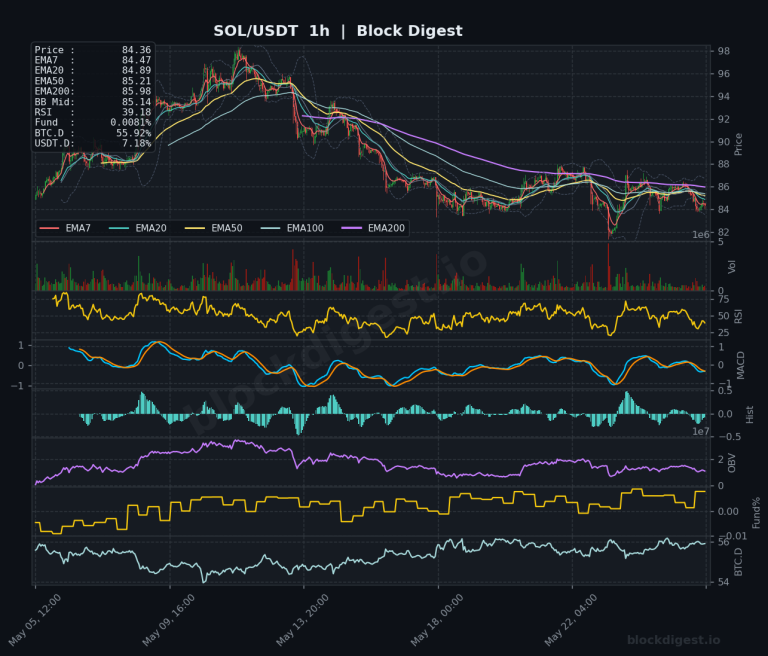
Altcoin Daily Analysis: Bitcoin Dominance at 55.96%, Altcoins Struggle
Market Context Bitcoin dominance sits at 55.92–55.96% across the tracked pairs, reflecting continued capital concentration in BTC and a challenging environment for altcoin outperformance. USDT dominance at 7.18% remains elevated, signaling that a meaningful portion of market participants are sitting on the sidelines in stablecoins rather than rotating into risk assets. The overall altcoin risk...

Ethereum Daily Analysis: ETH at $2,098 Below Key EMAs, Bearish Trend
Market Overview ETH/USDT is trading at $2,098.38, sitting in a structurally weak position across all timeframes. On the daily chart, price remains firmly below all major EMAs — the EMA7 at $2,114.21, EMA20 at $2,174.23, EMA50 at $2,216.25, and the EMA200 at $2,524.91 — confirming a sustained bearish trend that has been in place since...
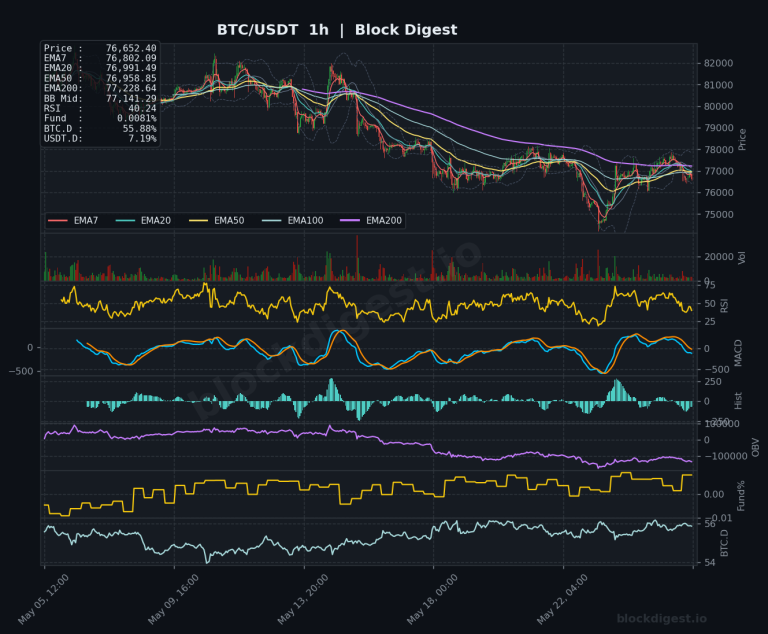
Bitcoin Daily Analysis: Bitcoin below key EMAs at $76,657
Market Overview Bitcoin is trading at approximately $76,657 as of May 26, 2026, caught in a technically precarious position across all major timeframes. Price is currently below all key EMAs on the daily chart — the EMA7 at $77,031, EMA20 at $77,718, and EMA50 at $76,747 — with price hovering just marginally above the EMA50,...
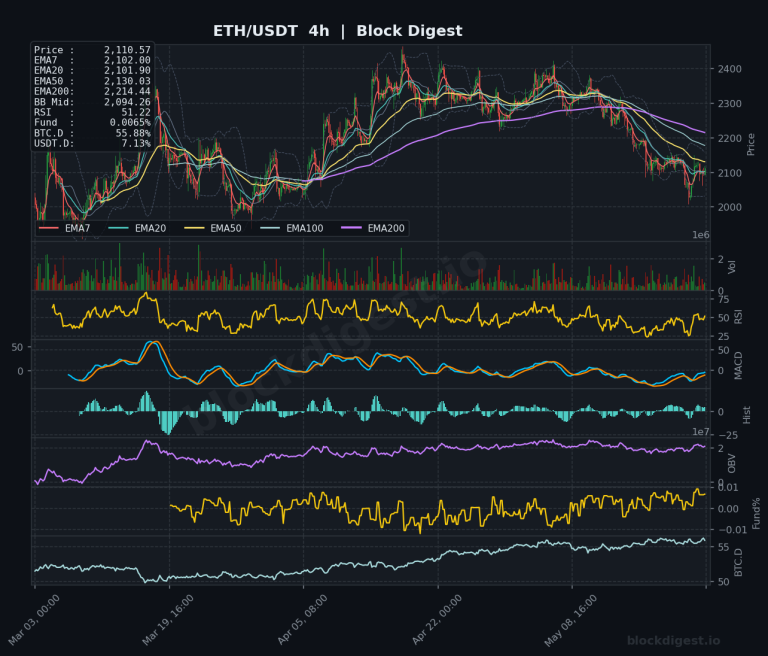
Ethereum Weekly Analysis: ETH Falls to $2,110 Amid 50% Decline From Highs
Weekly Market Overview ETH/USDT closed the week around $2,110, extending a prolonged downtrend that has seen price shed roughly 50% from its 2025 highs near $4,500. The current weekly candle is printing in deeply bearish territory, with price trading well below all major moving averages on both the weekly and daily timeframes. The recent macro...
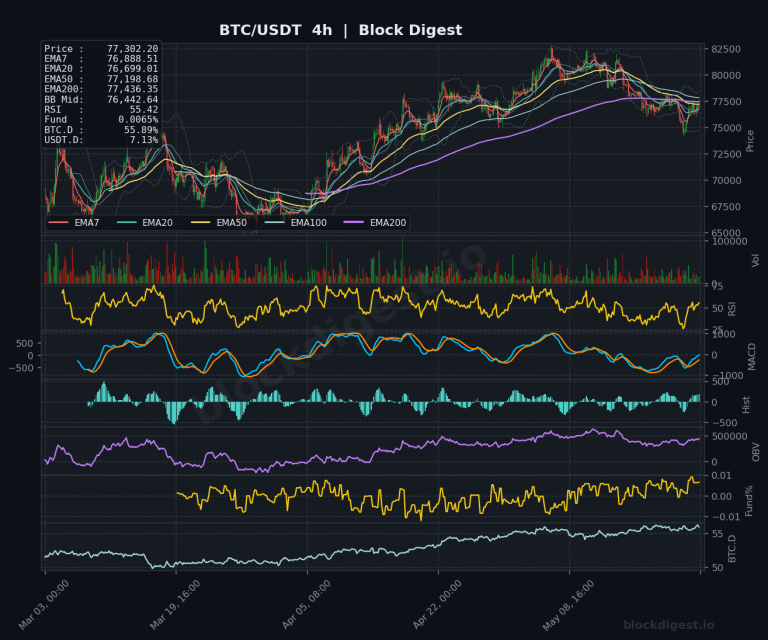
Bitcoin Weekly Analysis: Bitcoin Consolidates Below $126K All-Time High
Weekly Market Overview Bitcoin enters the final week of May 2026 trading at approximately $77,302, caught in a compressed consolidation range following its sharp rejection from the all-time high of $126,198 set in late 2025. The weekly candle structure reflects indecision, with price oscillating in a relatively tight band between $75,000 and $82,000 over recent...
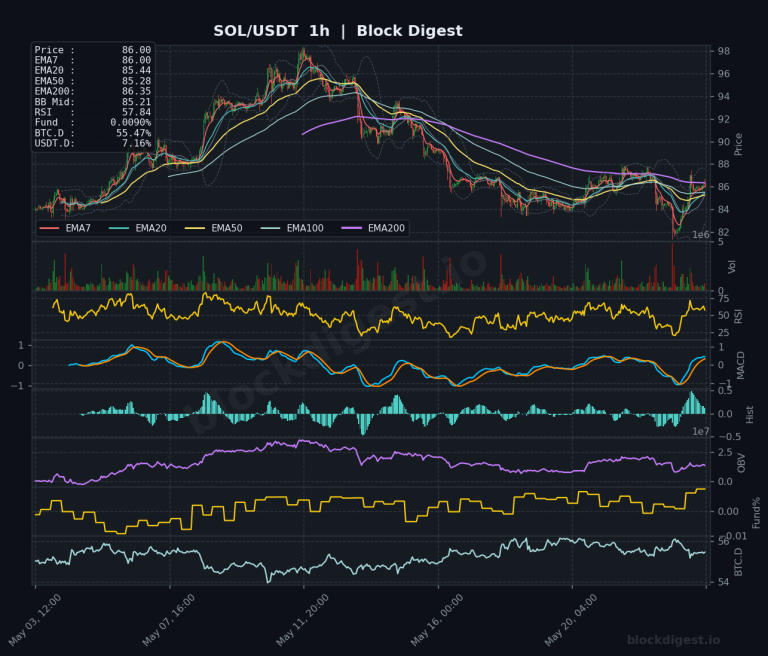
Altcoin Daily Analysis: Bitcoin Dominance Holds at 55.47%, Limits Altcoin Rotation
Market Context The broader altcoin market is navigating a challenging environment as Bitcoin dominance holds firm at 55.47%, continuing to compress altcoin performance and limit meaningful capital rotation. USDT.D sitting at 7.16% reflects a market that remains cautiously positioned, with investors not yet committing aggressively to risk assets — a posture that keeps most altcoins...
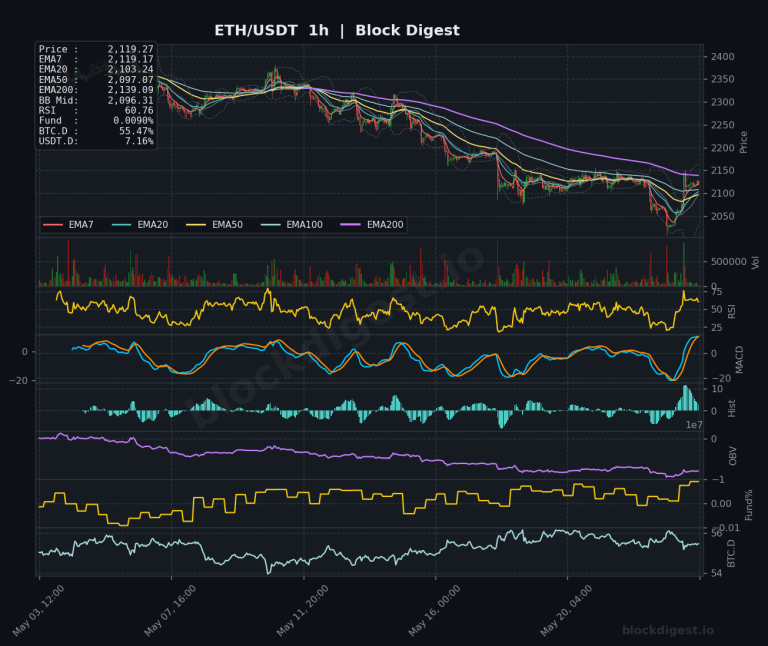
Ethereum Daily Analysis: ETH at $2,119 Below Key EMA Levels
Market Overview ETH/USDT is currently trading at $2,119.27, caught in a structurally weak position on the daily timeframe following a prolonged decline from highs above $4,000. Price sits below all major daily EMAs — the EMA20 at $2,191.55, EMA50 at $2,226.32, and the EMA200 at $2,533.59 — confirming a bearish macro structure. The daily Bollinger...
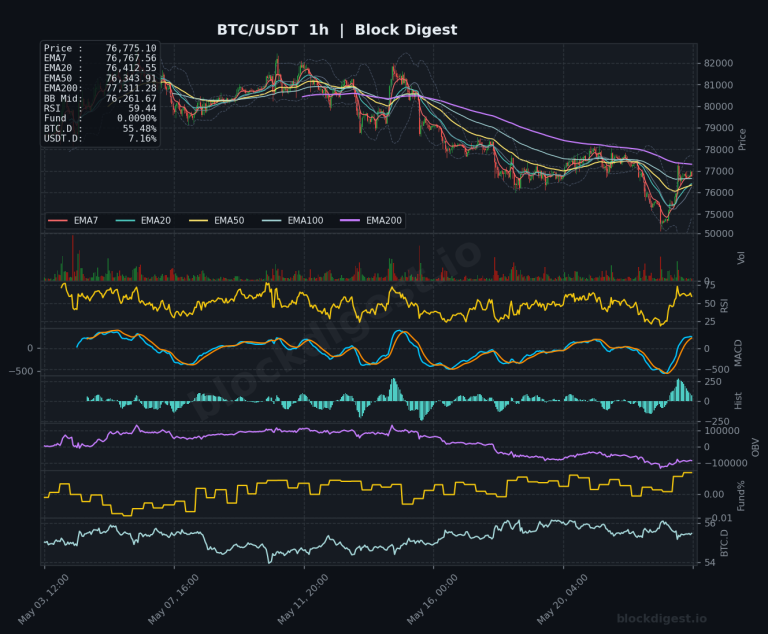
Bitcoin Daily Analysis: Bitcoin at $76,775 Below Major EMAs
Market Overview Bitcoin is currently trading at $76,775, situated in a technically challenged position below all major daily EMAs except the EMA50 ($76,719), which it is barely clinging to. On the daily timeframe, price sits well beneath the EMA7 ($77,050), EMA20 ($77,863), and the formidable EMA200 ($81,615), painting a structurally bearish picture from the higher...
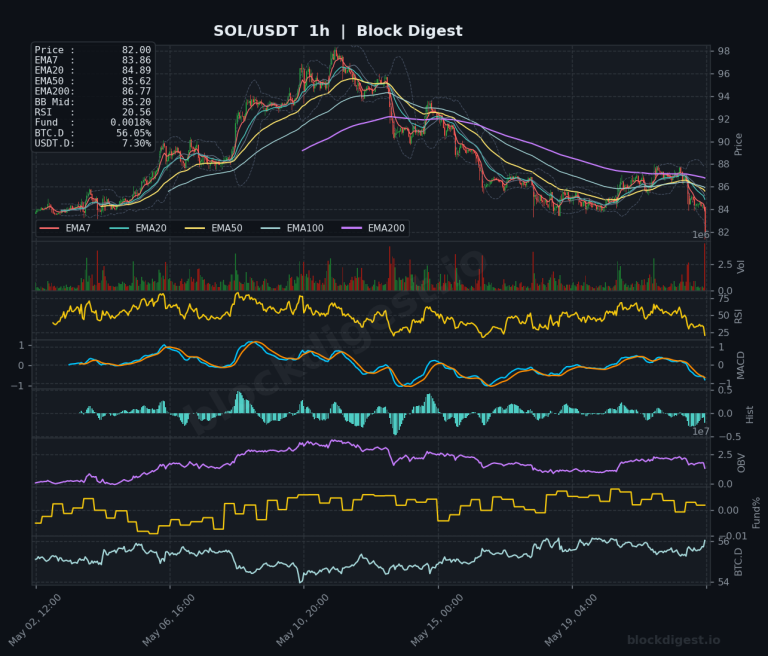
Altcoin Daily Analysis: Bitcoin Dominance Peaks, Stablecoin Holdings Rise
Market Context Bitcoin dominance sits at 56.05%, reflecting a prolonged period of capital concentration in BTC at the expense of the broader altcoin market. USDT dominance at 7.30% remains elevated, signaling that a meaningful portion of market participants are still sitting on the sidelines in stablecoins rather than rotating aggressively into risk assets. The combination...

Ethereum Daily Analysis: ETH breaks below $2,100 as bearish structure deepens
Market Overview ETH/USDT is currently trading at approximately $2,022–2,023, having broken decisively below the psychologically significant $2,100 level. Price sits well beneath all key EMAs on the daily timeframe — EMA7 at $2,106, EMA20 at $2,190, EMA50 at $2,227, and the EMA200 at $2,536 — confirming a deeply bearish market structure. The Bollinger Band midline...