Bitcoin Monthly Analysis: Bitcoin at $72,783 amid sustained distribution phase
Macro Market Overview
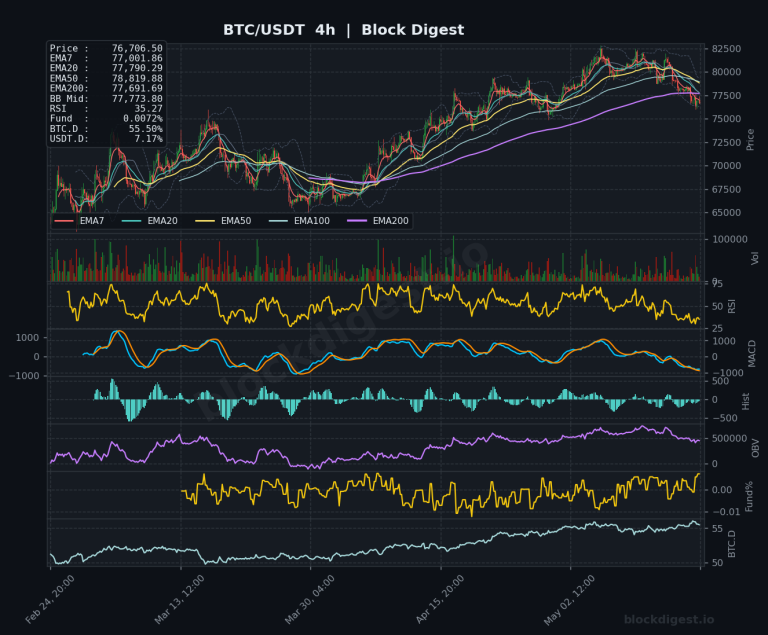
Bitcoin closes May 2026 trading around $72,783, a price level that carries significant historical weight as it previously represented the all-time high from the 2021 cycle peak before being comprehensively surpassed during the 2024-2025 bull run. The monthly candle structure over the past several months reveals a sustained distribution and markdown phase following the cycle peak near $120,000, with price now trading roughly 40% below those highs. The broader market cycle context is unambiguous: BTC has transitioned out of the euphoric markup phase that characterized late 2024 and into what increasingly resembles a mid-cycle correction or early bear phase, depending on how the coming months resolve. The monthly EMA structure has turned decidedly bearish, with the EMA7 at $77,437 having crossed below the EMA20 at $81,154 — a bearish signal that on the monthly timeframe carries substantial weight given its rarity and historical implications. This EMA death cross on the monthly chart mirrors the structure seen entering the 2022 bear market, demanding respect from even the most bullish market participants.
Long-Term Trend Structure
On the monthly chart, the EMA7 ($77,437) has decisively broken below the EMA20 ($81,154), and price itself at $72,783 is now trading beneath both long-term moving averages — a configuration that historically has preceded extended drawdowns rather than swift recoveries. The monthly RSI reads 46.88, having declined from deeply overbought territory above 75 seen at the cycle peak; it is now approaching the mid-line and risks a bearish breakdown below 50, which during the 2022 cycle confirmed the transition into a sustained bear market. The Bollinger Band structure on the monthly timeframe shows bands beginning to expand to the downside following a prolonged squeeze near the highs, suggesting volatility is likely to remain elevated with a bearish directional bias. Critical historical support exists at the $69,000–$73,000 zone, which acted as the former 2021 all-time high resistance and more recently as a floor during mid-2024 consolidation before the parabolic final leg higher. The cycle phase must be characterised as transitioning from distribution into early markdown, with the burden of proof firmly on bulls to reclaim monthly EMAs and reverse the current structural deterioration.
Weekly Timeframe Context
The weekly chart reinforces the bearish monthly thesis with near-textbook clarity: price at $72,783 sits below all key short- and medium-term EMAs, with EMA7 at $75,116, EMA20 at $77,250, and EMA50 at $84,231 all stacked in a bearish order above current price. The weekly EMA200 at $69,143 is the critical long-term support that bulls must defend — historically this level has marked the floor of major bull market corrections and the line between cyclical correction and full bear market. The weekly RSI at 41.67 is trending lower toward oversold territory but has not yet reached the extreme sub-30 readings that have historically coincided with capitulation lows, suggesting further downside pressure may persist before a meaningful structural low is established. The weekly Bollinger Band midline near $73,110 is acting as immediate overhead resistance, and failure to reclaim this level on a weekly closing basis would confirm continued bearish momentum into June.
Key Macro Levels
- Major Resistance: $77,000–$77,500 (monthly EMA7 and weekly EMA20 confluence); $81,000–$81,500 (monthly EMA20, significant structural pivot); $84,000–$85,000 (weekly EMA50, former major support-turned-resistance); $95,000–$100,000 (psychological round number and previous consolidation zone from the distribution phase)
- Major Support: $69,000–$70,000 (weekly EMA200 and former 2021 all-time high — the most critical macro support level on the chart); $60,000–$62,000 (major structural support from mid-2024 pre-rally consolidation base); $52,000–$55,000 (deep macro support zone corresponding to the 2024 post-halving correction low); $40,000–$43,000 (catastrophic support failure level that would signal full multi-year bear market resumption)
Momentum & Accumulation Analysis
The monthly RSI at 46.88 has now surrendered the 50 midline, a level that during the 2022 bear market served as a reliable inflection point — once lost, RSI remained suppressed for over 12 months before recovering meaningfully. The daily RSI reading of 34.10 is approaching oversold territory, which could generate short-term relief bounces, but on the higher timeframes the momentum deterioration is structural rather than tactical. Monthly OBV tells a particularly cautionary tale: after making new highs during the cycle peak, OBV has turned lower and is now declining, indicating net distribution pressure from larger market participants over recent months. On the weekly chart, the MACD has crossed into bearish territory with the signal line below zero and histogram bars confirming negative momentum expansion — this mirrors the 2021-to-2022 weekly MACD configuration that preceded months of continued price decline. Comparing current readings to the 2022 cycle, the RSI and MACD setups are structurally similar but not yet at the extreme oversold levels that marked the generational bottom near $15,500.
BTC Dominance – Cycle Context
BTC dominance at 55.21% remains historically elevated and has been in a sustained uptrend since the 2021-2022 cycle low near 35-40%, reflecting BTC’s continued structural outperformance relative to the broader altcoin market. This level of dominance suggests we have not yet entered a classic altcoin season rotation — capital has remained concentrated in Bitcoin rather than flowing aggressively into smaller caps, which is characteristic of either early bull phases or risk-off environments within a bear market. The dominance chart on the monthly timeframe shows a minor rollover from recent highs near 60%, which could be an early signal of capital beginning to rotate, but the trend remains fundamentally bullish for BTC dominance until a more decisive breakdown below 50% is observed. USDT dominance at 7.37% remains elevated, signaling that a meaningful portion of crypto market participants remain in stablecoins — this wall of dry powder could act as powerful fuel for the next leg up if macro conditions improve, but its current persistence also reflects genuine risk aversion and uncertainty about near-term direction.
Risk Scenarios
- Bull case: A decisive reclaim of the $77,000–$78,000 zone on the monthly close, coinciding with a bullish reversal in global macro conditions (Federal Reserve rate cuts, risk-on equity environment), would invalidate the current bearish EMA structure and could trigger a rapid retest of $85,000–$90,000 resistance; sustained monthly closes above $81,500 (monthly EMA20) would restore the macro uptrend and open the path toward the $100,000 psychological target and ultimately new all-time highs above $120,000 in a cycle extension scenario.
- Bear case: Failure to hold the $69,000–$70,000 weekly EMA200 support on a closing basis would represent a catastrophic macro breakdown, structurally similar to the 2022 loss of the $30,000 key support, and would likely accelerate selling toward $60,000 then $52,000; a confirmed monthly close below $65,000 combined with continued OBV deterioration and RSI sub-40 on the monthly timeframe would validate a full bear market thesis with potential downside targets in the $40,000–$45,000 range over a 6-12 month horizon.
Monthly Outlook
Entering June 2026, the macro setup for Bitcoin is decisively cautious — the monthly EMA structure is bearish, price is below all major moving averages on both weekly and monthly timeframes, and momentum indicators across all timeframes point to continued distribution pressure without yet reaching the capitulation extremes that have historically marked cycle bottoms. The most critical level to monitor throughout June is the $69,000–$70,000 zone, which represents the confluence of the weekly EMA200 and the former 2021 all-time high — this is the line in the sand between a corrective phase within an intact long-term bull market and the onset of a deeper structural bear market. Any meaningful recovery attempt will need to clear $77,000–$78,000 with conviction and sustained weekly closes to shift the near-term bias from bearish to neutral. The cycle thesis leans toward this being a post-peak correction rather than a generational bear market given the
Disclaimer: This analysis is for informational purposes only and does not constitute financial advice. Cryptocurrency markets are highly volatile and unpredictable. All trading decisions should be made based on your own research and risk tolerance. Block Digest is not responsible for any financial losses incurred as a result of acting on this content.