Altcoin Daily Analysis — May 02, 2026
Altcoin Daily Roundup – May 02, 2026
Market Context
The altcoin market is displaying mixed signals as Bitcoin dominance hovers around 55.20%, suggesting a relatively stable equilibrium between BTC and altcoin performance. With USDT.D at 7.08%, capital appears moderately distributed across risk assets, indicating neither extreme risk-on nor risk-off sentiment. The overall environment remains cautiously constructive, with several major altcoins testing key technical levels that will determine near-term direction.
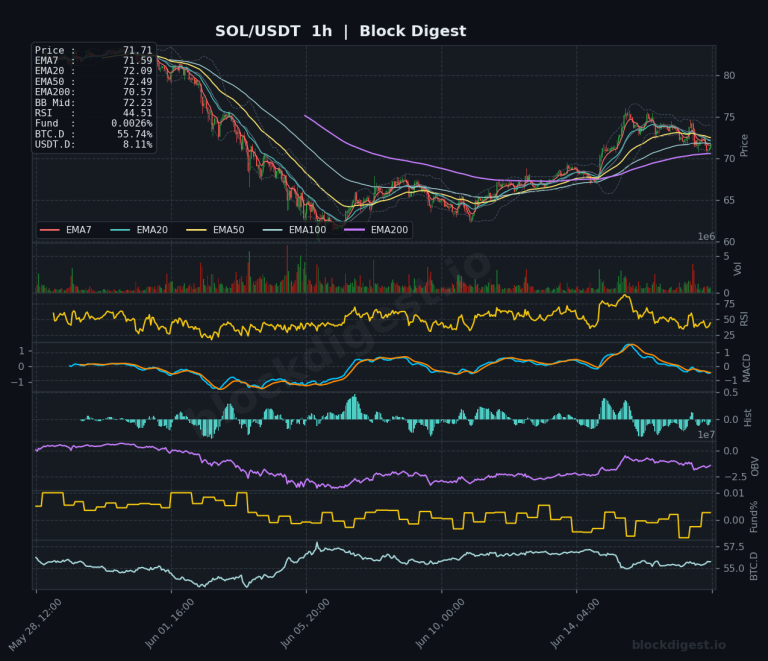
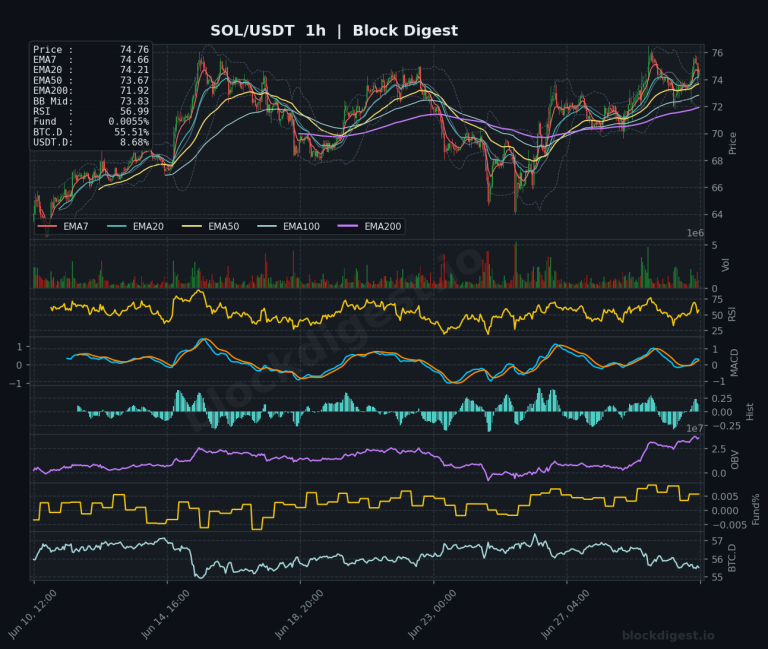
Solana (SOL)
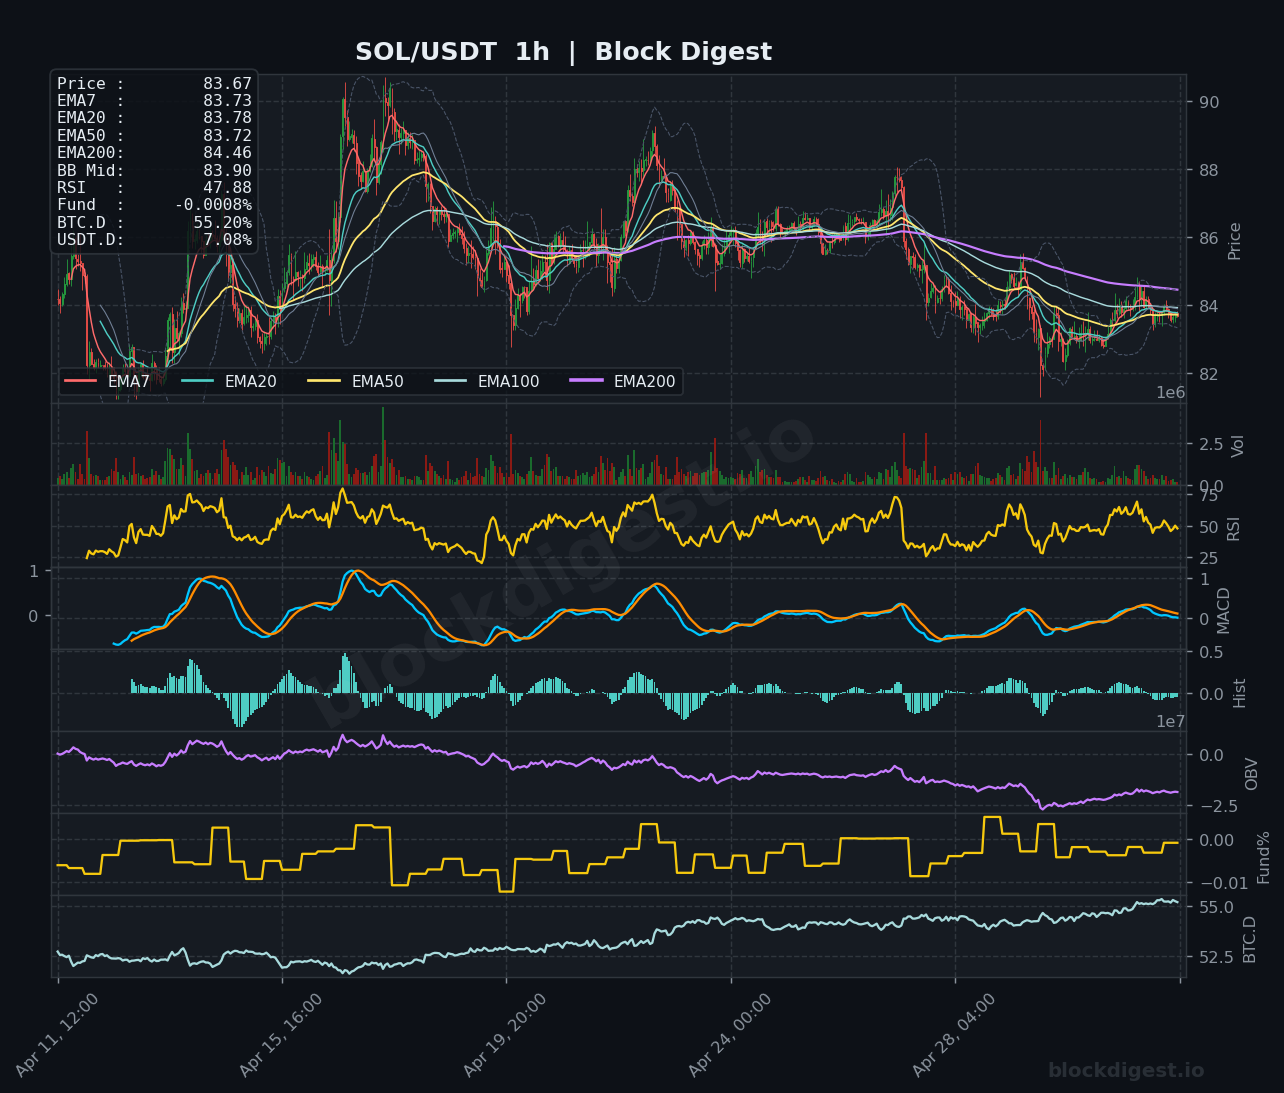
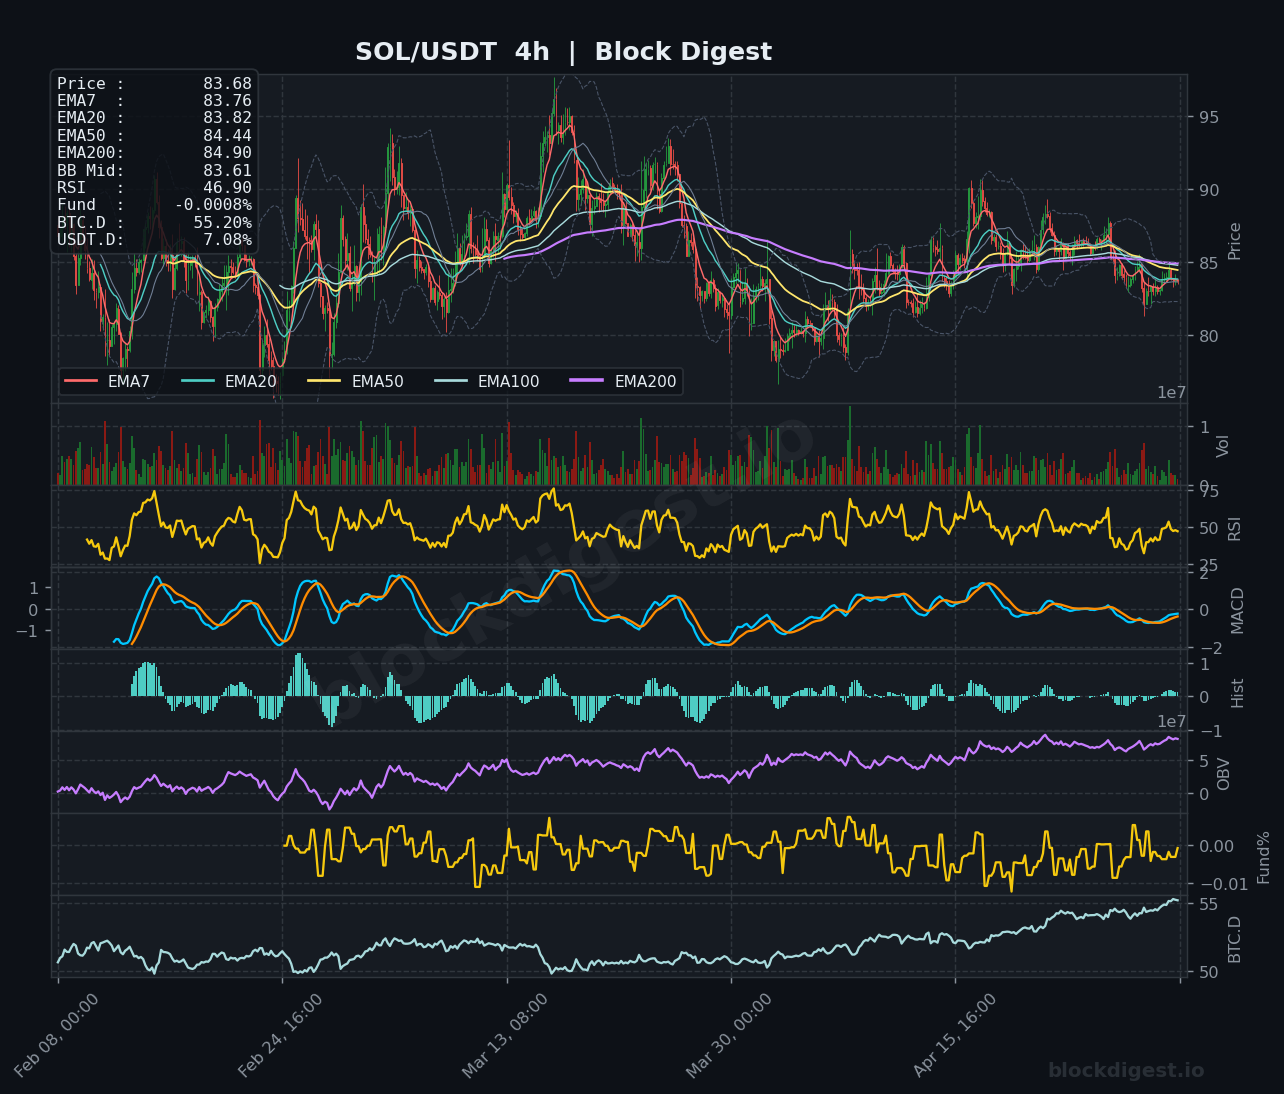
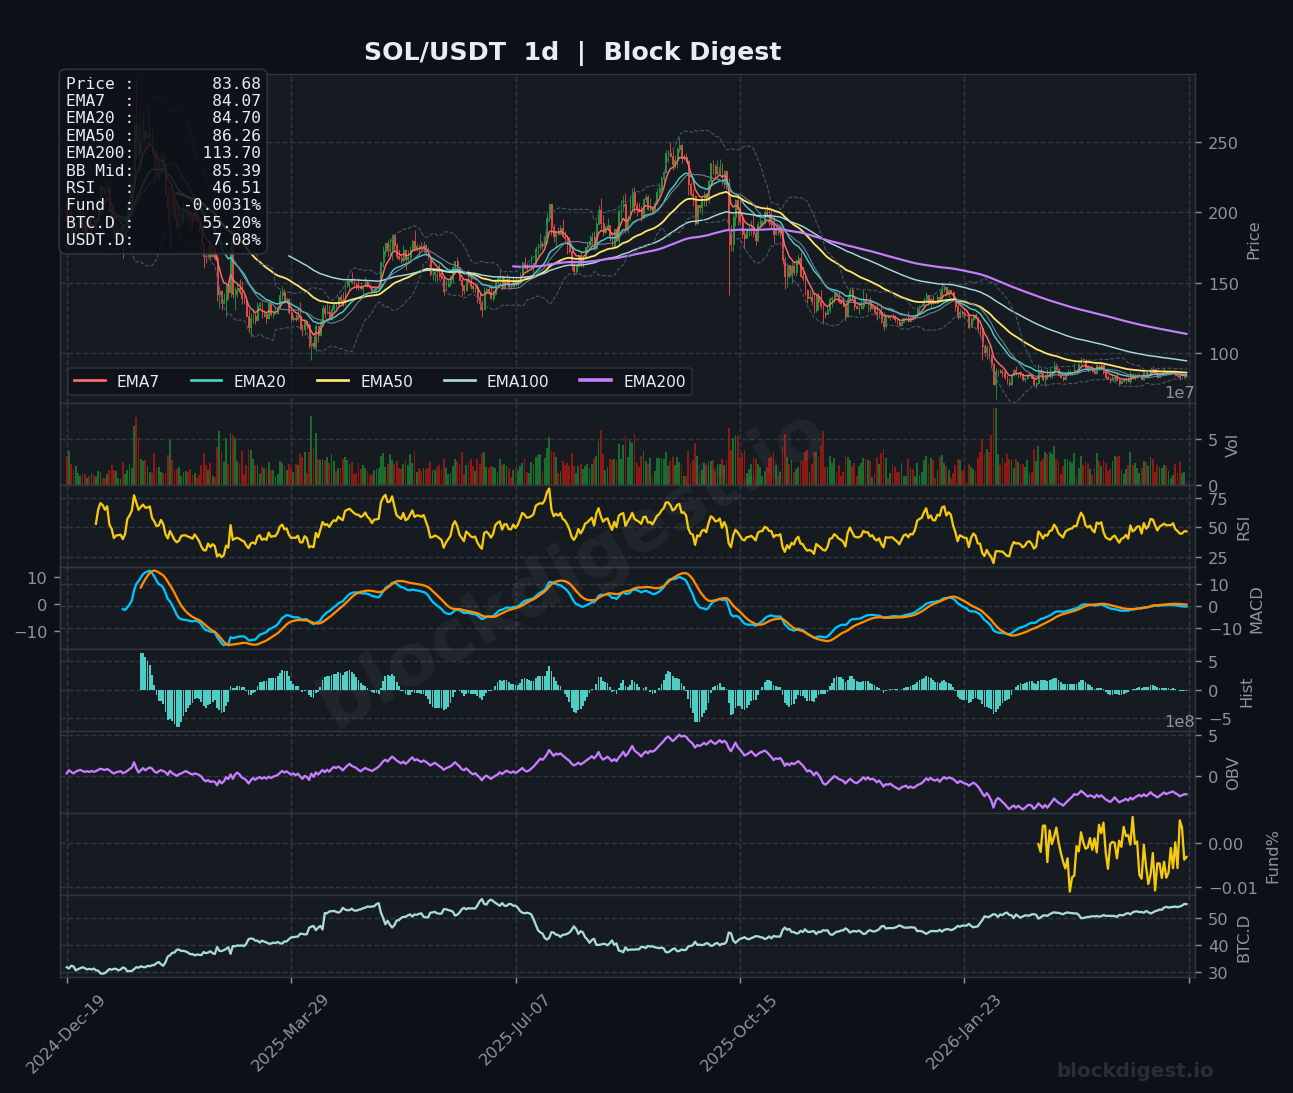
Solana is trading at $83.67, trapped in a tight consolidation below its key moving averages with price pinned beneath the EMA50 at $83.72. The RSI at 47.88 indicates neutral momentum, while the MACD remains flat near the zero line, suggesting indecision following recent weakness. On the daily timeframe, SOL continues to trade well below its EMA200 at $113.70, reflecting persistent bearish pressure from higher levels. The immediate resistance cluster between $84.00-$84.50 must be reclaimed for bulls to gain traction, while support sits near $82.00. Short-term bias remains neutral-to-bearish unless price can decisively break above the $85.00 zone.
XRP (XRP)
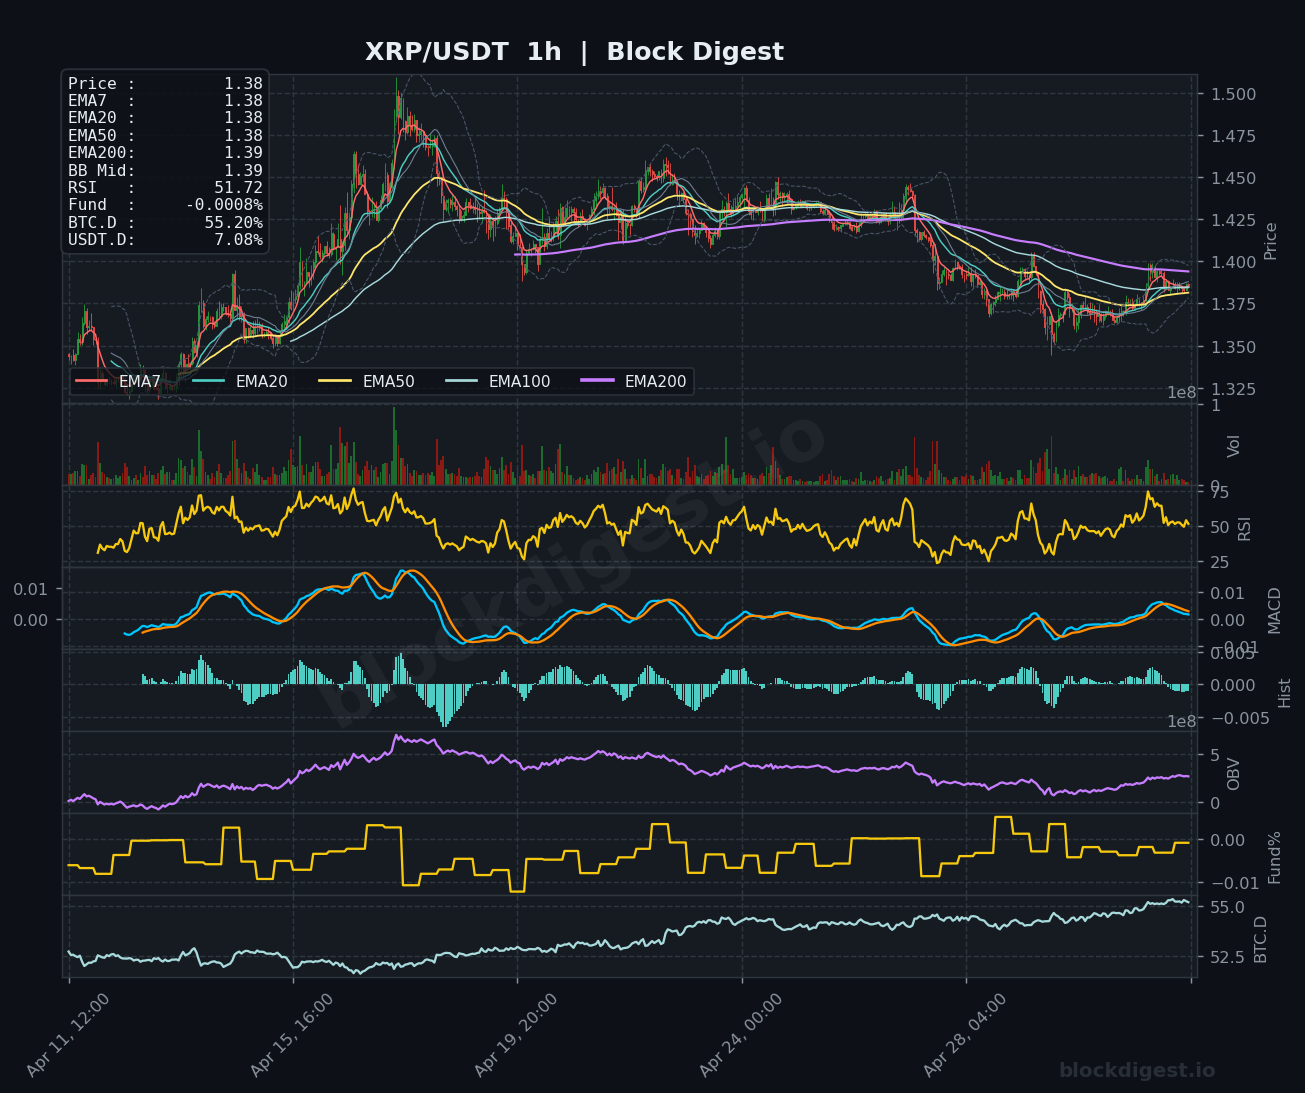
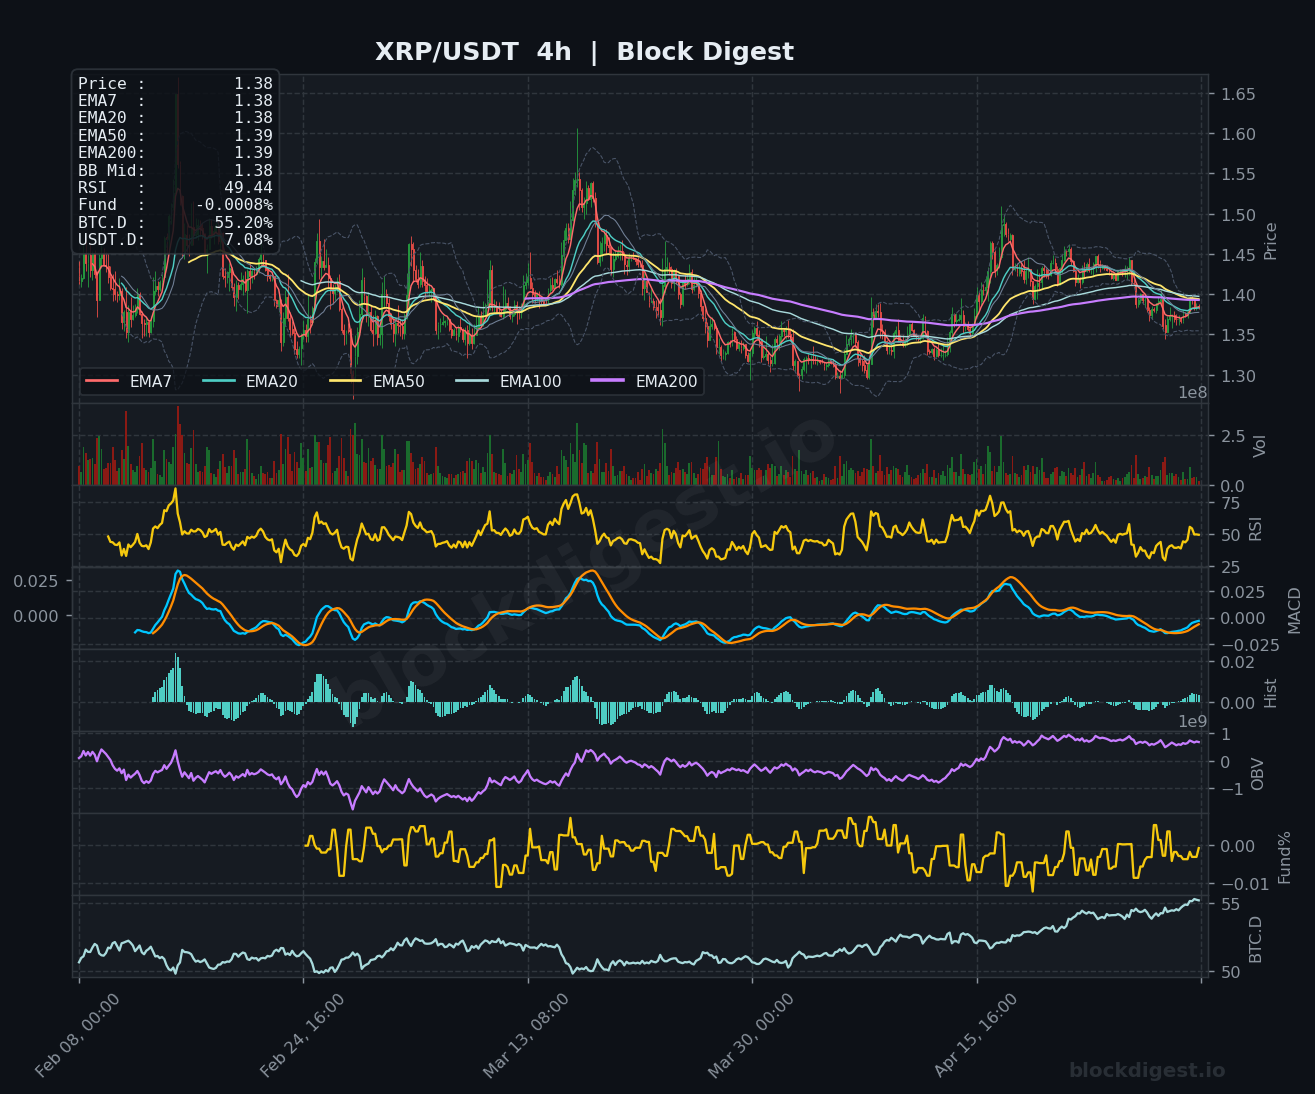
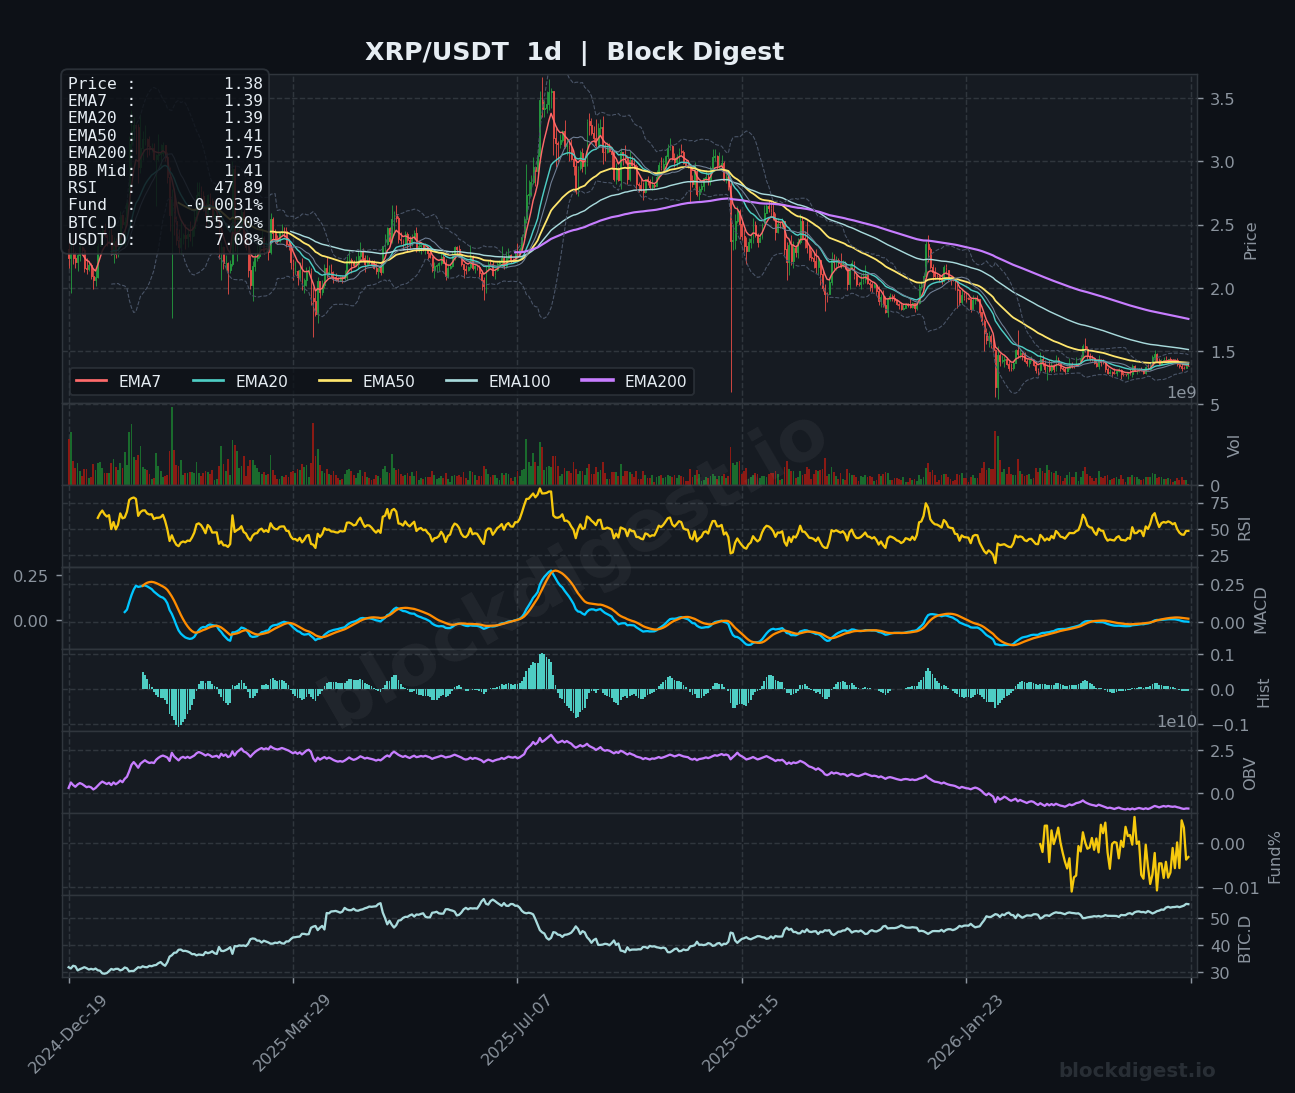
XRP is trading at $1.38, consolidating tightly around its short-term moving averages with price aligned with the EMA7/20/50 cluster near $1.38-$1.39. The RSI reads 51.72, suggesting balanced momentum, while the MACD shows minimal divergence, indicating choppy, range-bound conditions. On the daily chart, XRP remains significantly below its EMA200 at $1.75, highlighting the longer-term downtrend that continues to weigh on sentiment. Key resistance lies at $1.40-$1.42, with a break above potentially targeting $1.45, while support is found near $1.35-$1.36. The overall bias remains neutral within this tight range, awaiting a catalyst for directional movement.
BNB (BNB)
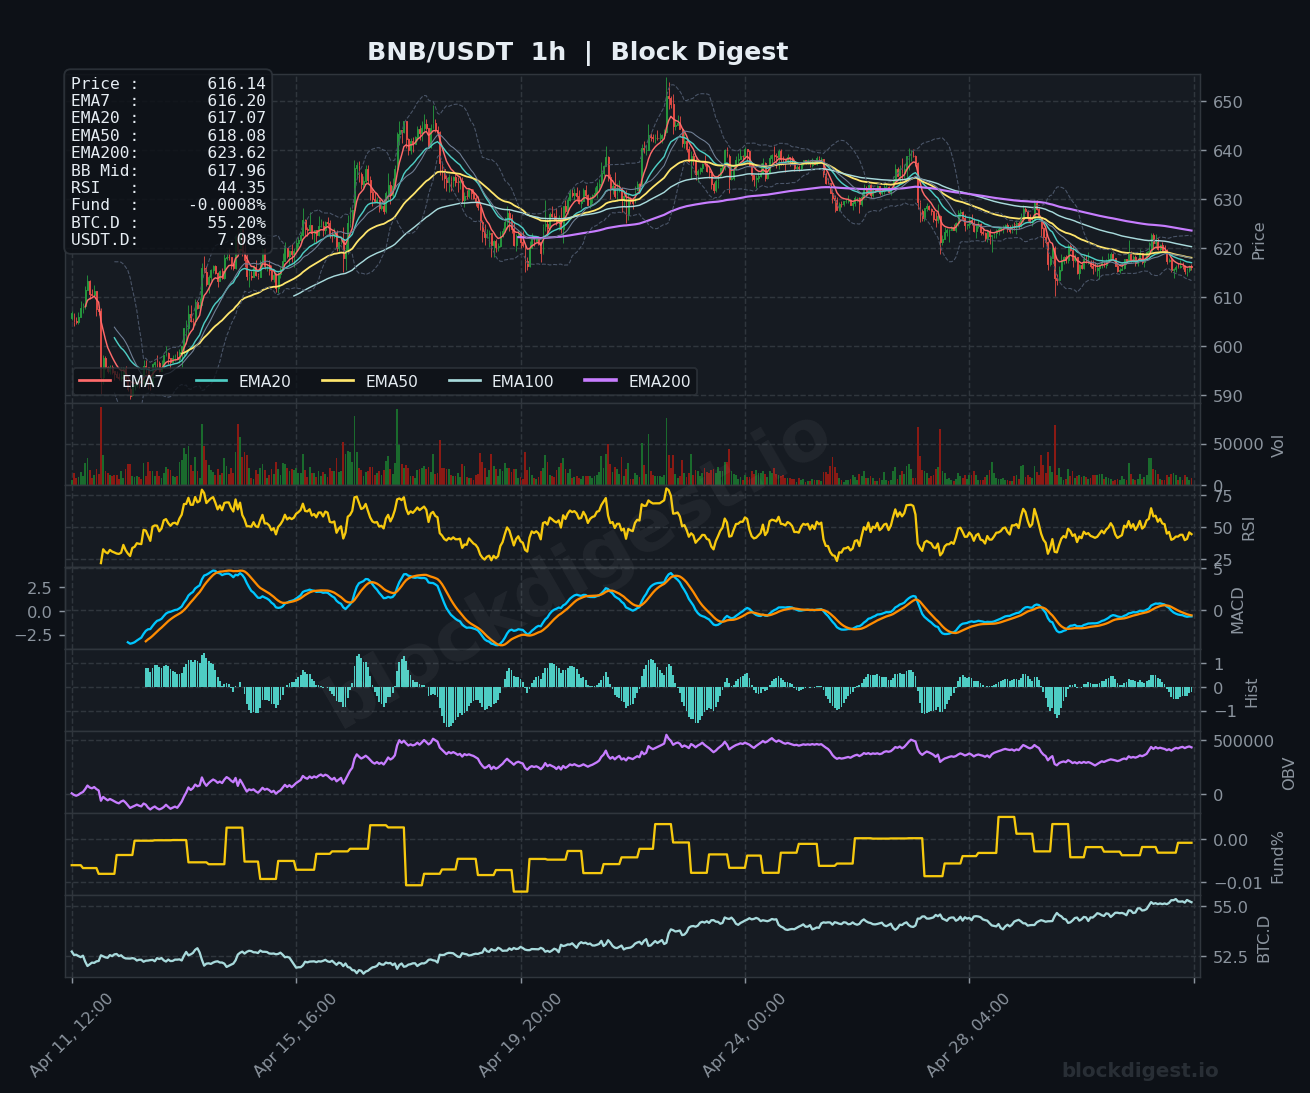
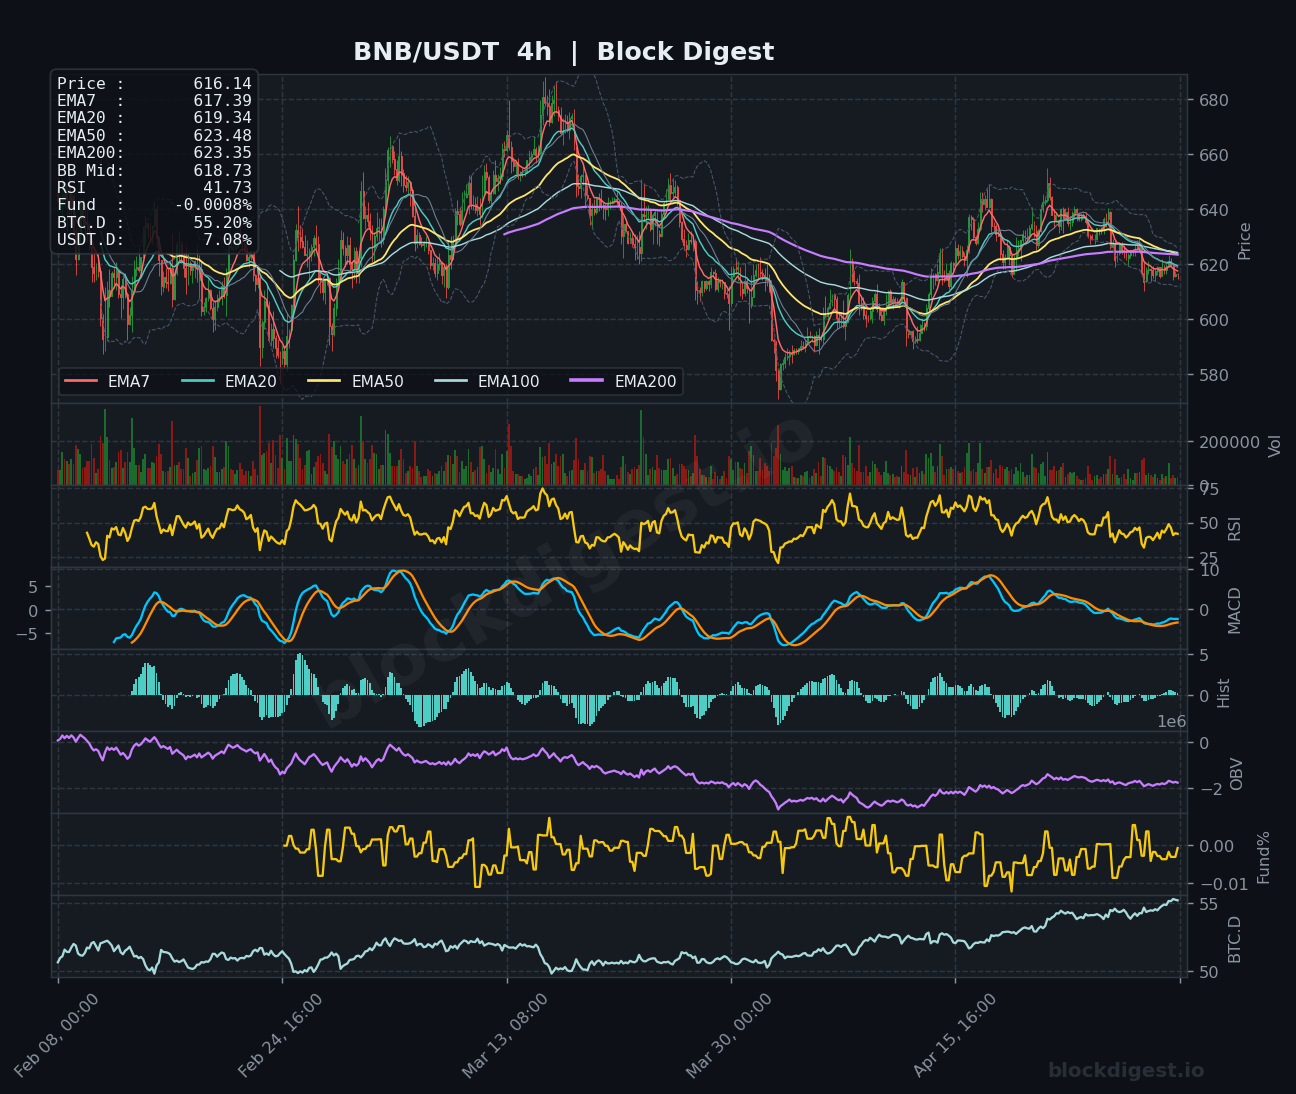
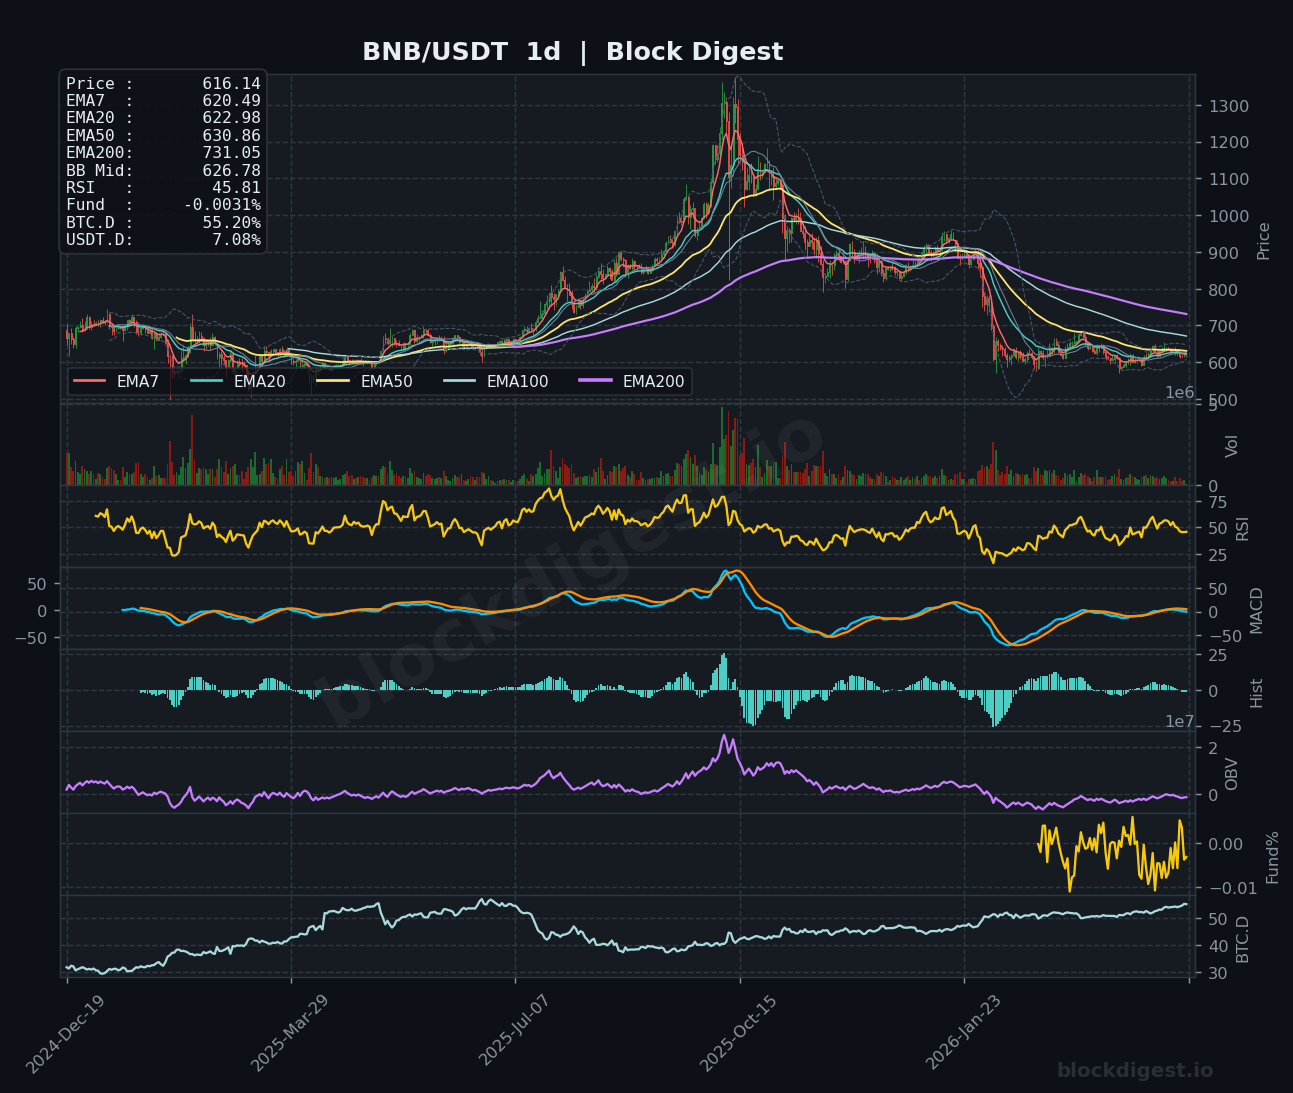
BNB is trading at $616.14, compressed beneath resistance at $620.00 with price hovering below the EMA20 at $617.07. The RSI at 44.35 reflects weakening momentum, while the MACD is flatlining near neutral territory, confirming the lack of directional conviction. On the daily timeframe, BNB trades far below its EMA200 at $731.05, underscoring the substantial distance from prior highs and ongoing consolidation phase. Immediate resistance sits at $620-$625, with a break above potentially opening the door to $640, while support is located near $610-$612. Short-term bias leans slightly bearish within this range unless buyers can reclaim the $625 level decisively.
Dogecoin (DOGE)
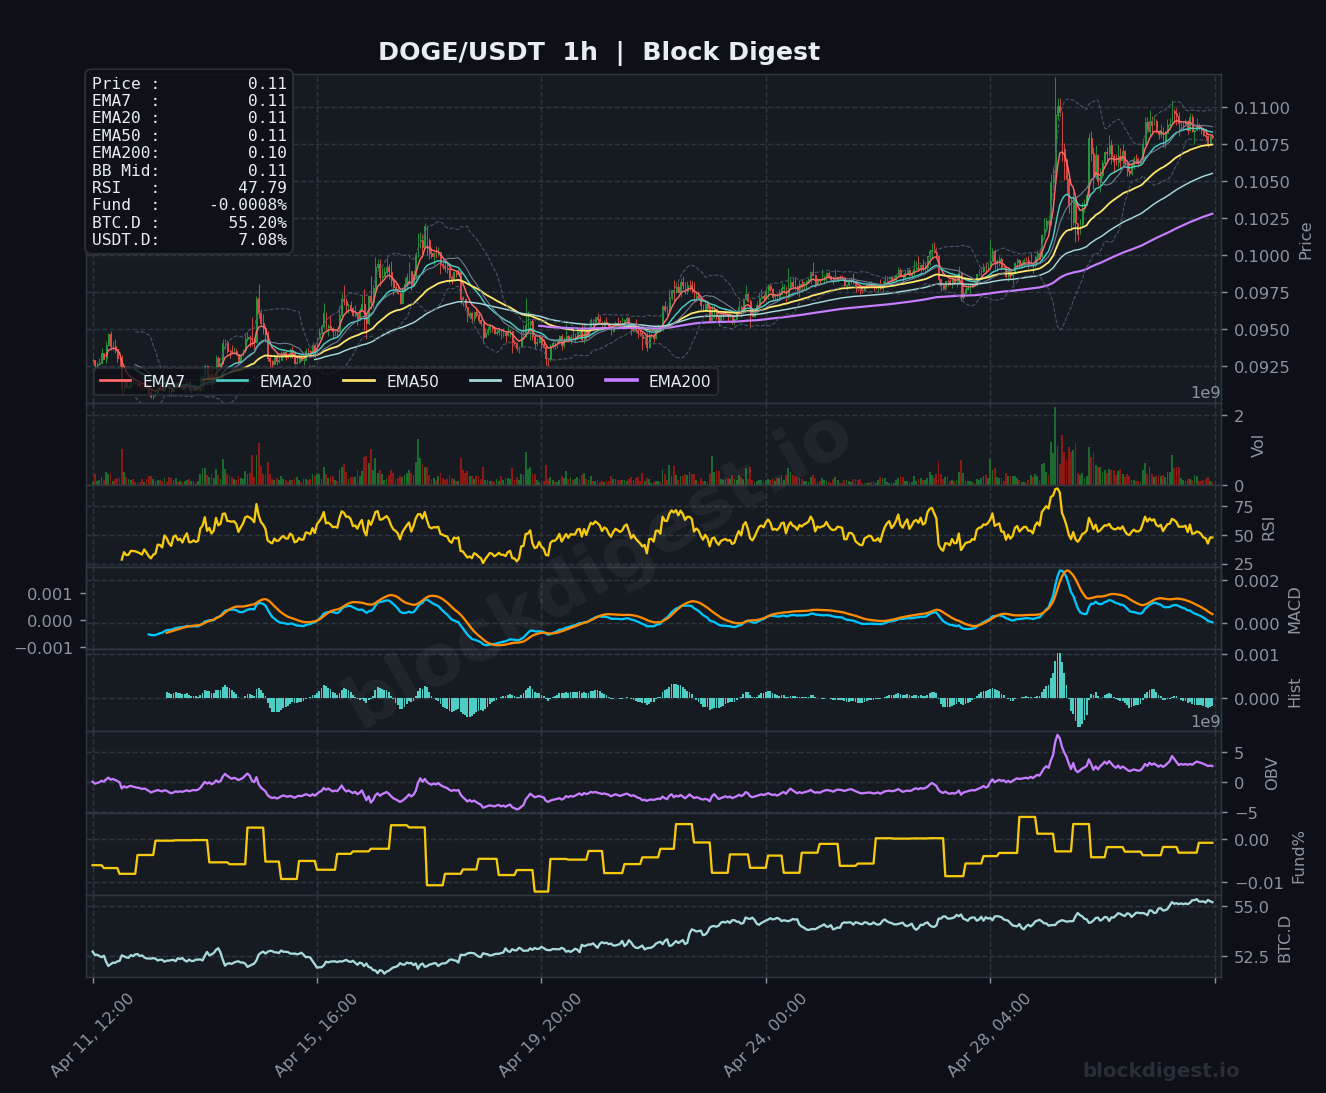
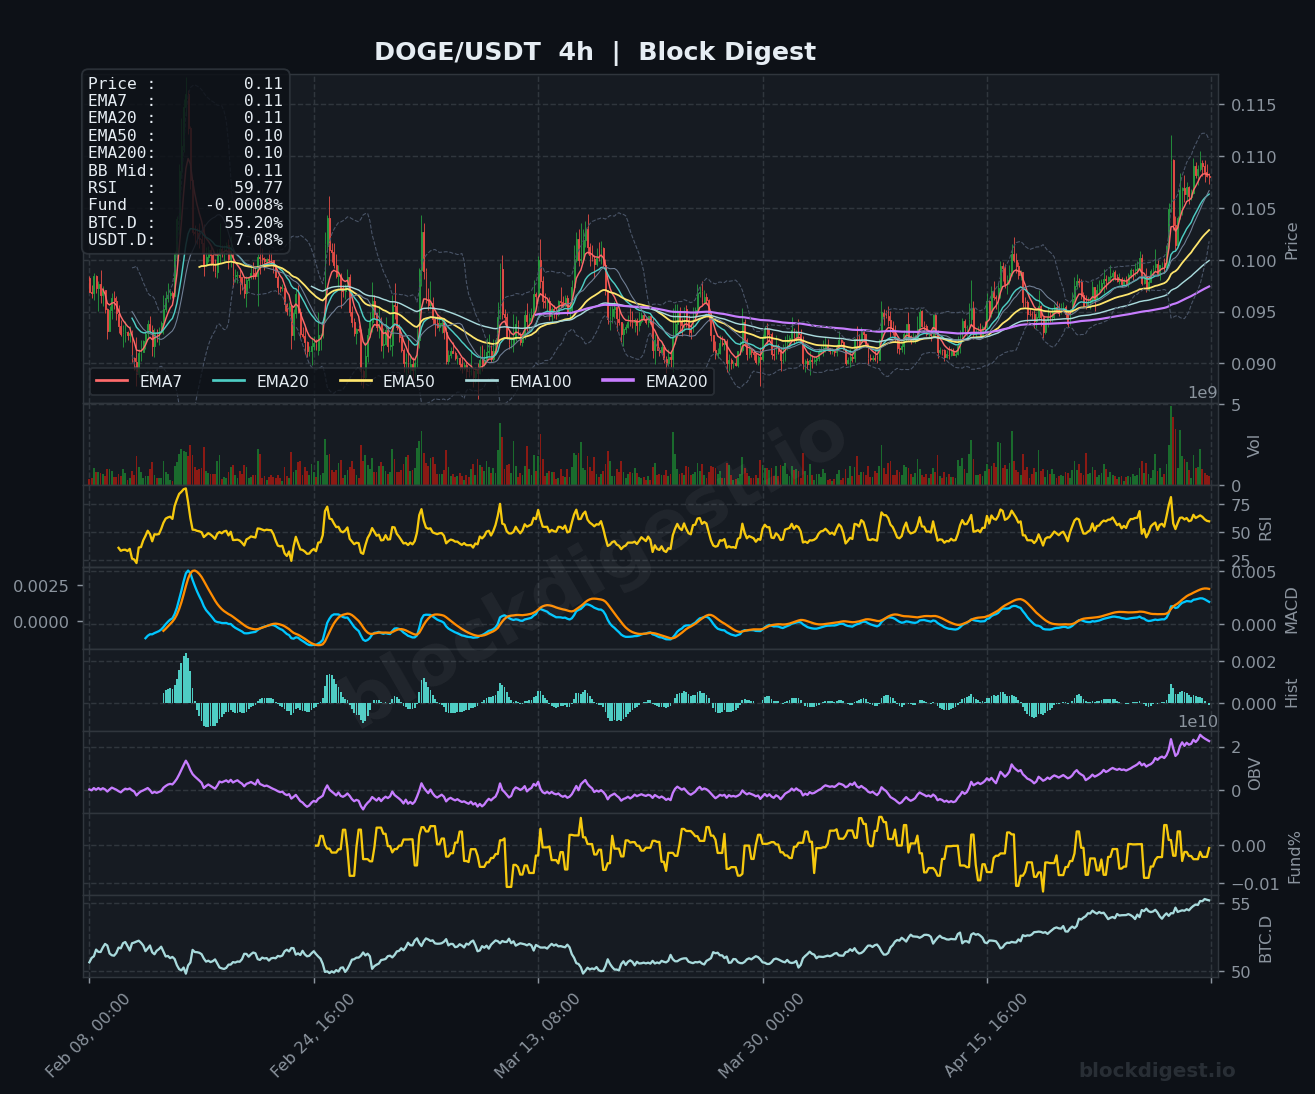
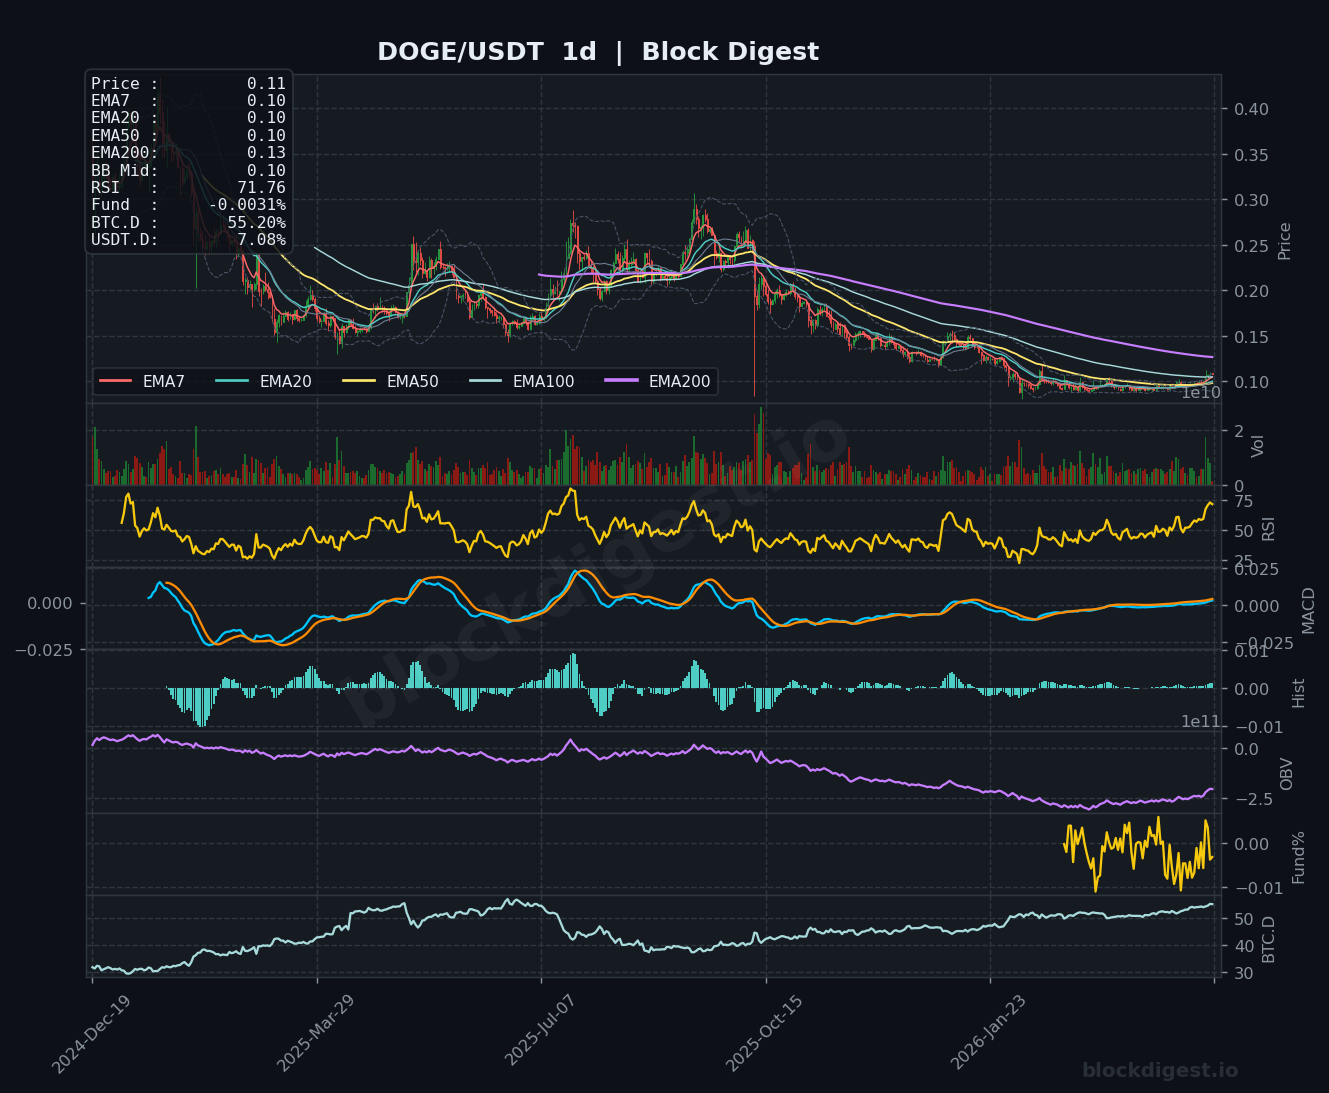
Dogecoin is trading at $0.1100, exhibiting relative strength with price positioned above its short-term moving averages following a recent spike. The RSI at 47.79 suggests neutral momentum after cooling from overbought levels, while the MACD shows a potential bullish crossover forming. On the 4-hour chart, DOGE has broken above the EMA50/100 cluster, demonstrating improved technical structure, while the daily chart shows an RSI of 71.76, indicating strong bullish momentum but potential for consolidation. Key resistance lies at $0.1120-$0.1150, with support at $0.1050-$0.1075. Short-term bias is bullish as long as DOGE holds above $0.1050, with further upside potential if it clears $0.1150.
Litecoin (LTC)
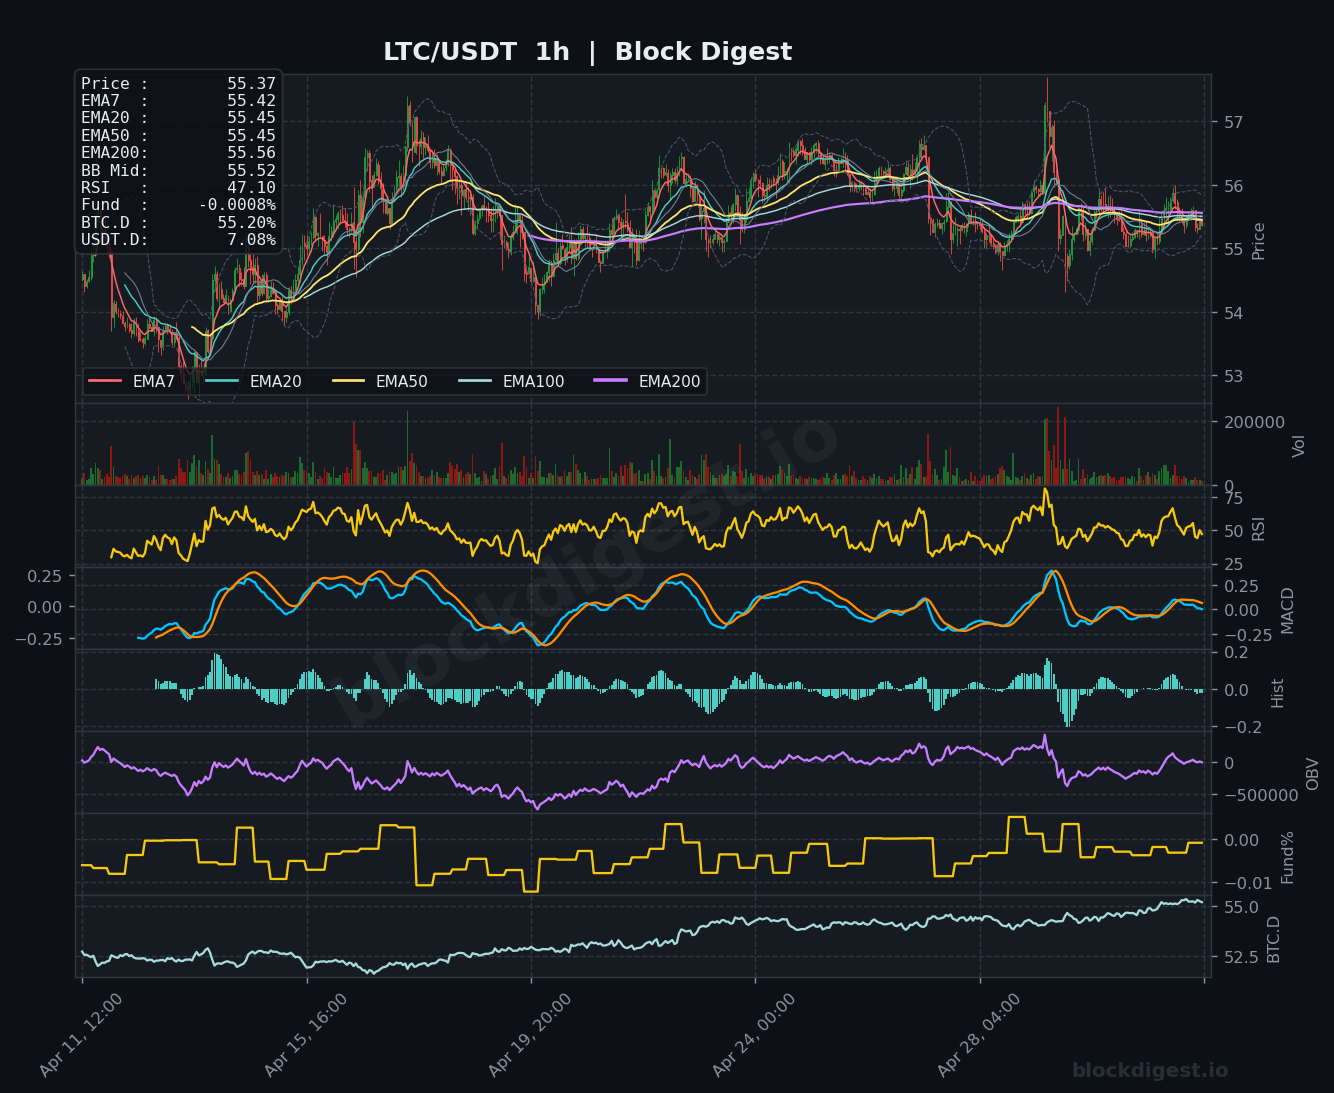
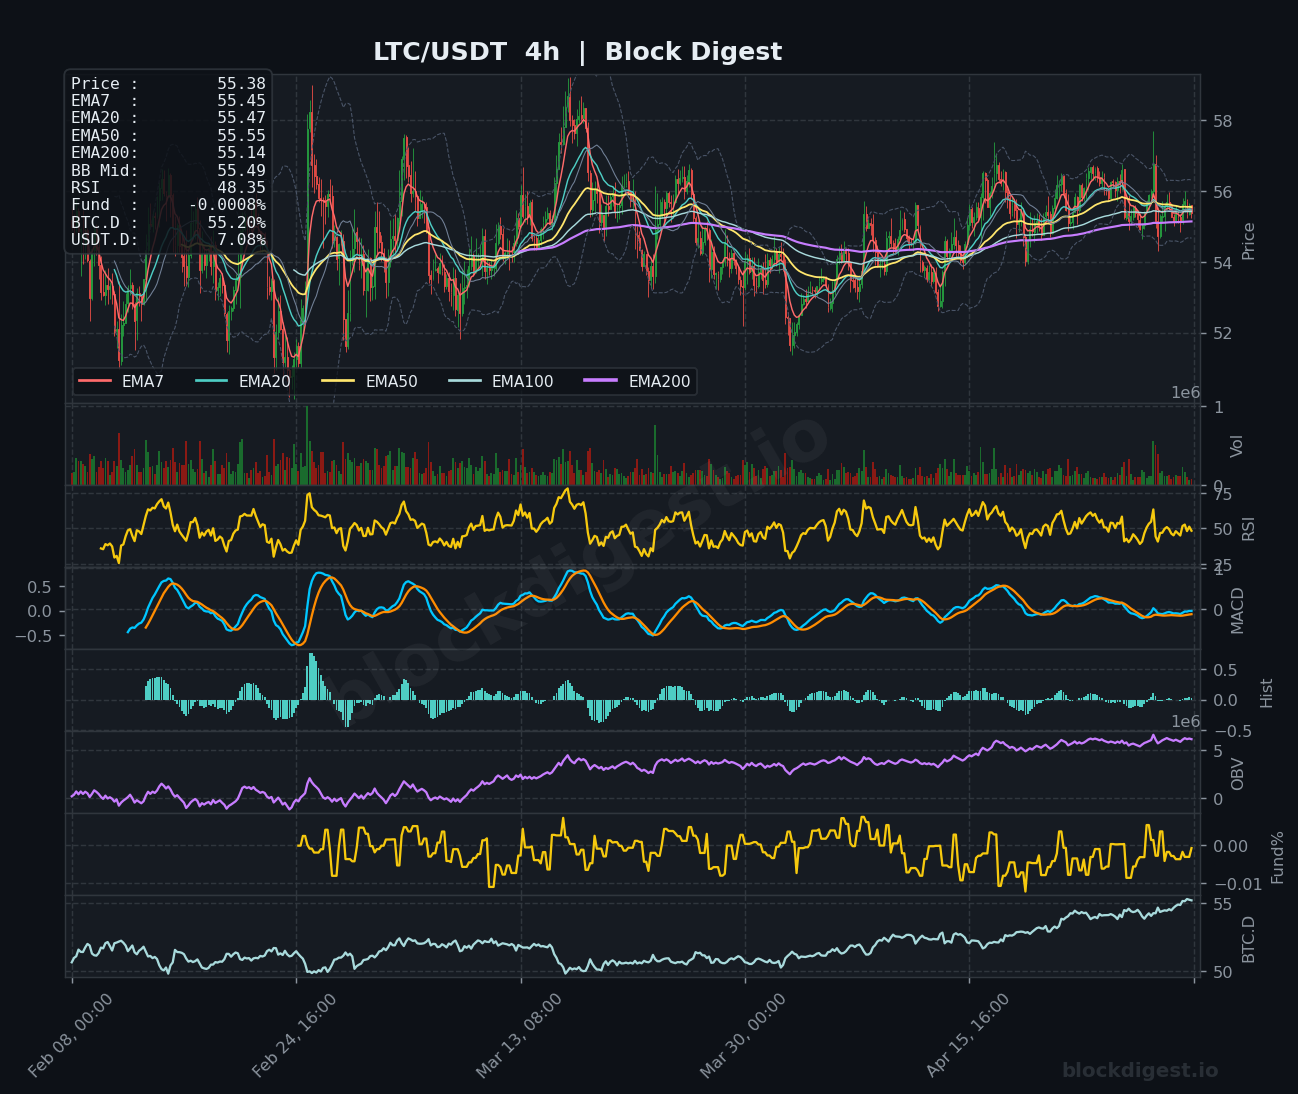
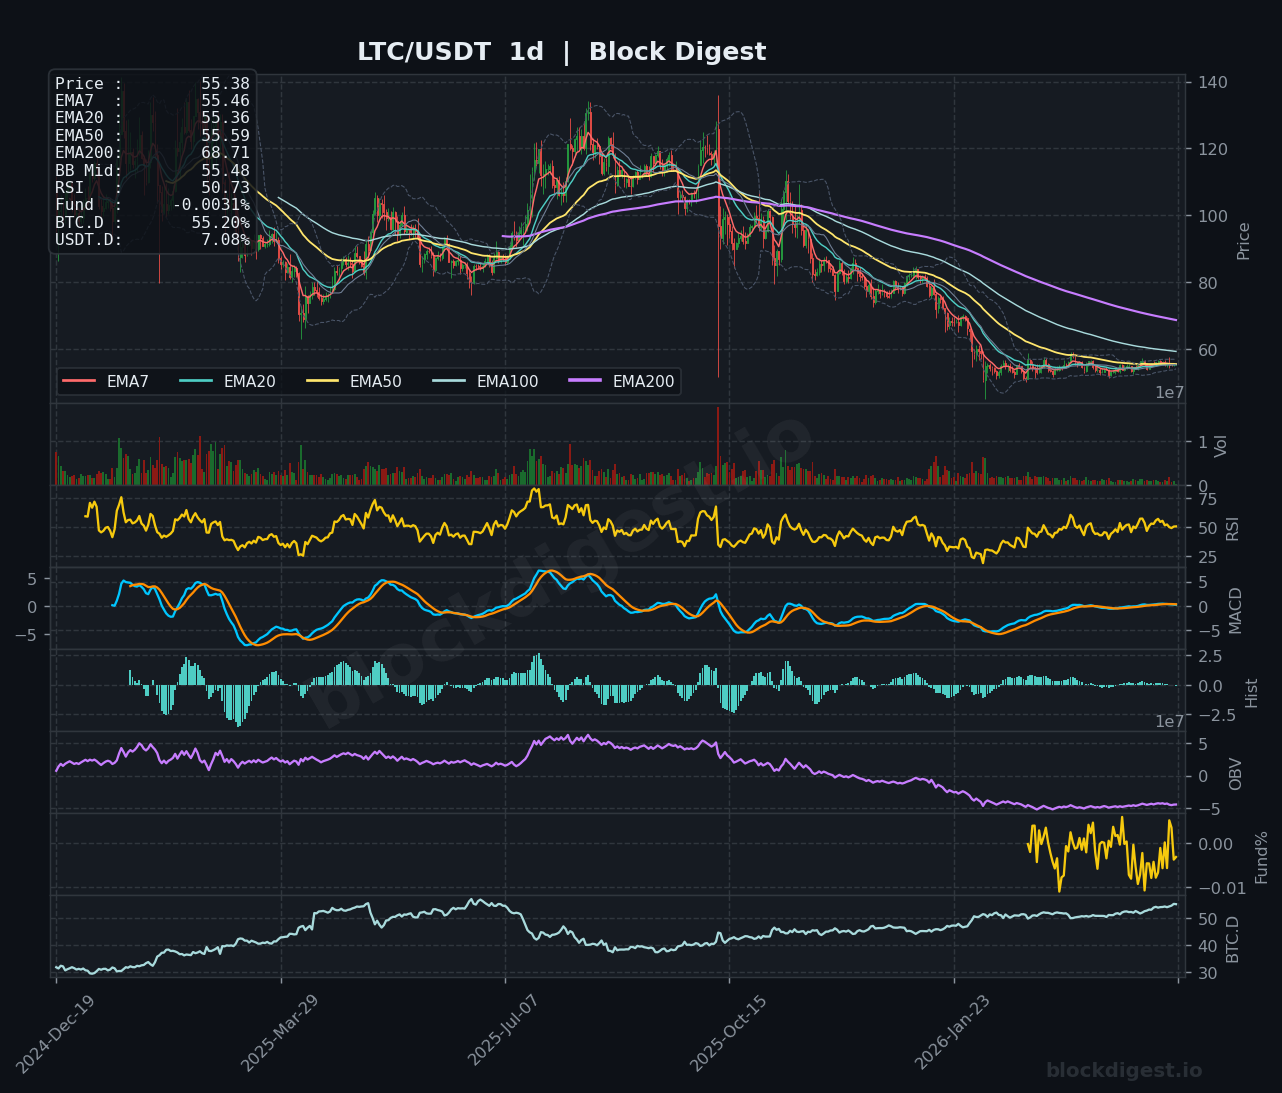
Litecoin is trading at $55.37, locked in a tight range with price clustering around all major moving averages between $55.37-$55.56. The RSI at 47.10 indicates neutral momentum, while the MACD remains flat, reflecting consolidation and indecision. On the daily chart, LTC trades significantly below its EMA200 at $68.71, highlighting the extended downtrend and distance from recovery levels. Immediate resistance sits at $56.00-$56.50, with a breakout potentially targeting $58.00, while support is found near $54.50-$55.00. The short-term bias remains neutral-to-bearish, with bulls needing to reclaim $56.50 to shift sentiment positively.
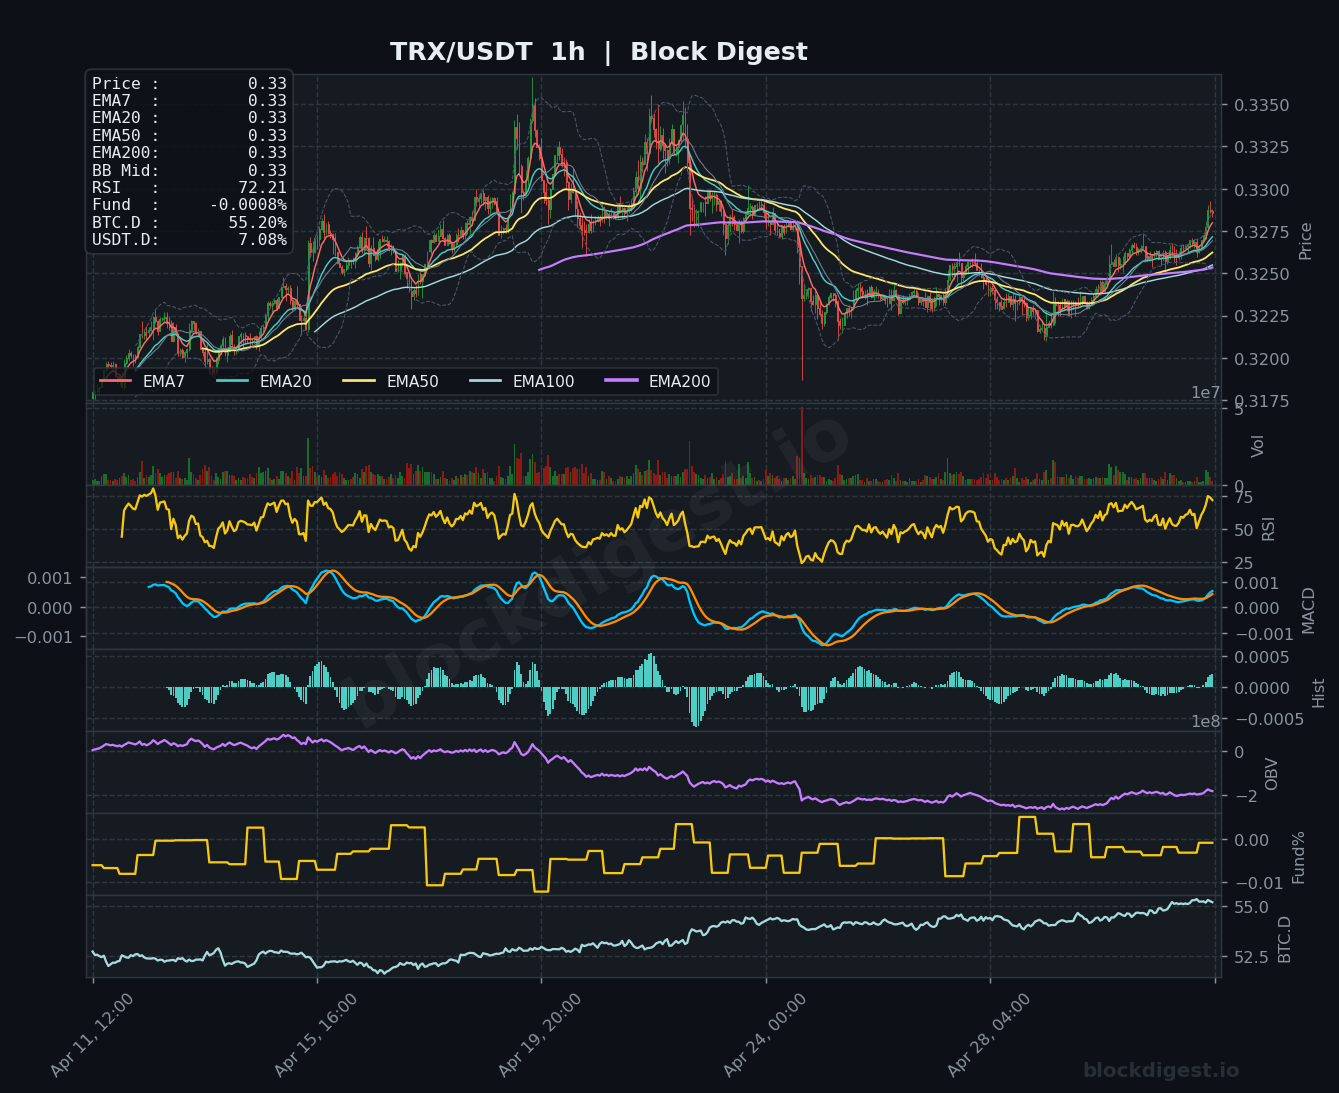
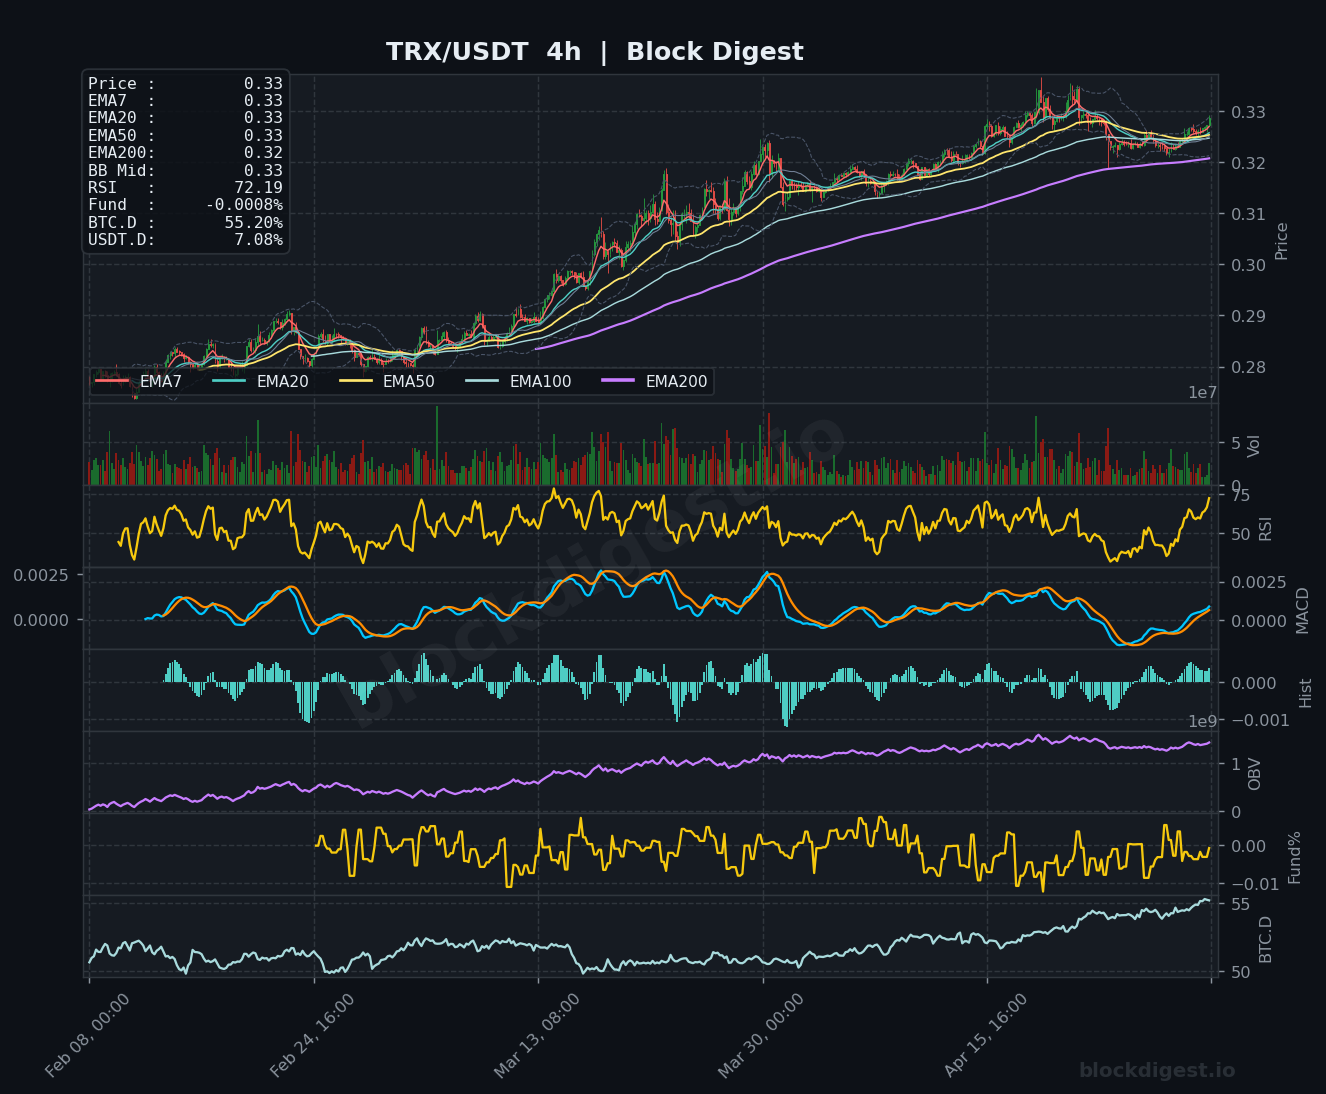
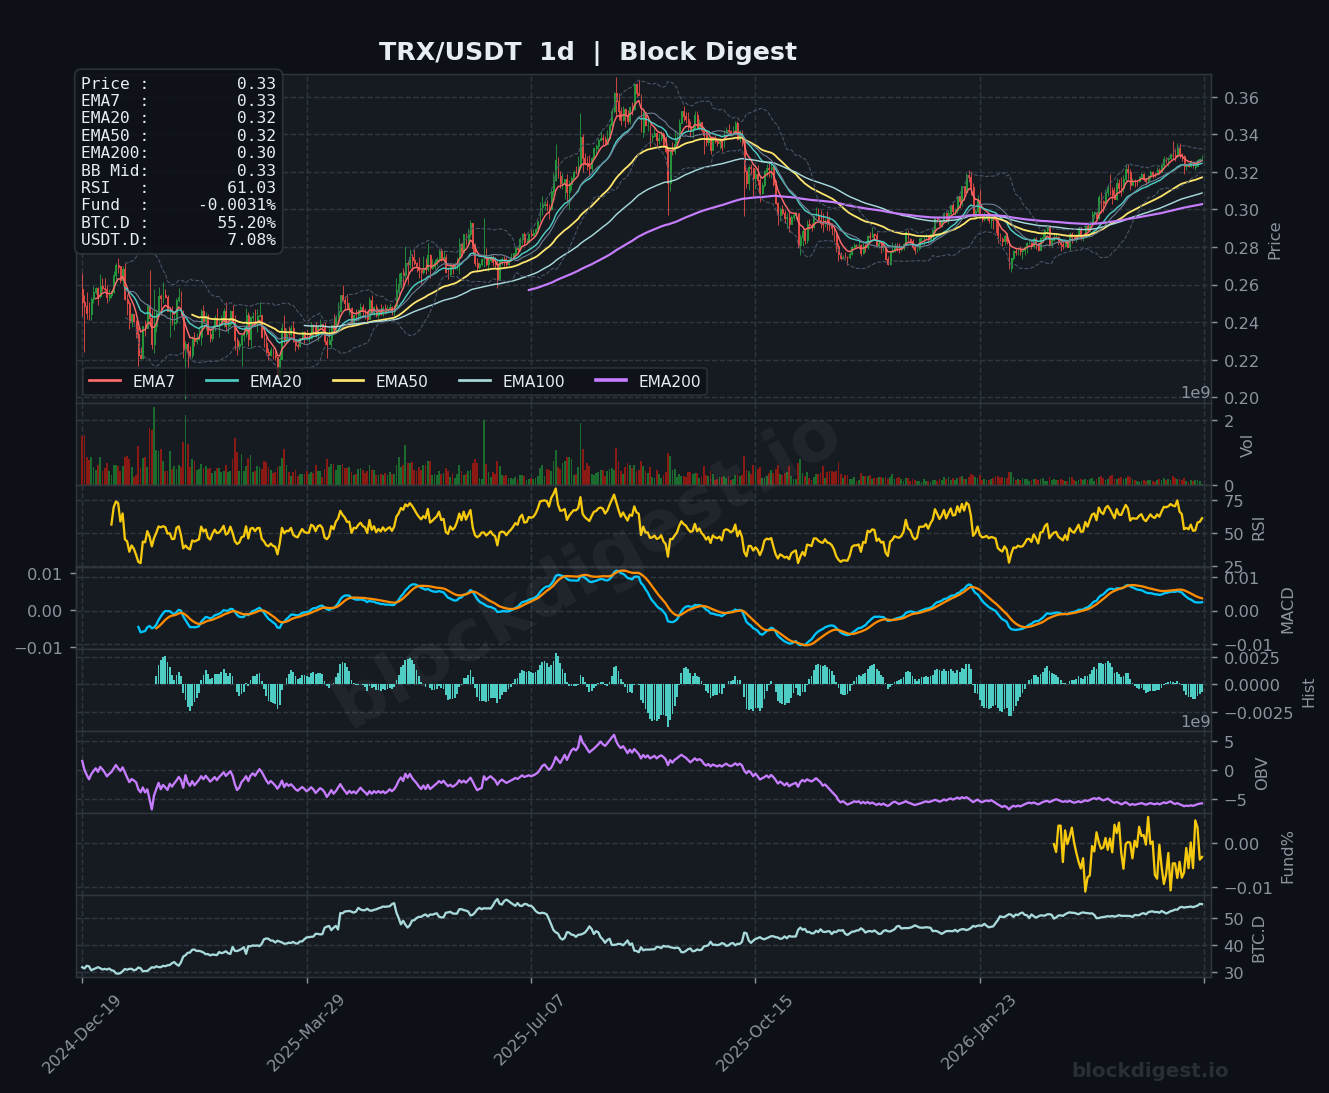
TRON (TRX)
TRON is trading at $0.3300, demonstrating notable relative strength with price trading above its short-term EMAs and showing bullish structure. The RSI at 72.21 indicates overbought conditions, suggesting potential for near-term consolidation, while the MACD remains positively diverged with continued bullish momentum. On the daily chart, TRX shows an RSI of 61.03 with price consolidating near recent highs around $0.33, supported by a rising EMA structure. Key resistance lies at $0.3350-$0.3370, with support at $0.3250-$0.3280. Short-term bias remains bullish, though the elevated RSI suggests caution for new entries, with a pullback to support offering better risk/reward opportunities.
Altcoin Outlook
The altcoin space presents a bifurcated picture, with meme coins like DOGE and utility tokens like TRX showing relative strength, while larger-cap assets like SOL, XRP, BNB, and LTC remain range-bound or under pressure. DOGE and TRX exhibit the strongest technical setups with bullish momentum and favorable risk/reward profiles above key support levels, while SOL and BNB appear weakest with compressed ranges beneath critical resistance. Market participants should monitor Bitcoin dominance closely, as a decline below 54% could trigger broader altcoin strength, while USDT.D below 7% would signal increased risk appetite. The overall environment favors selective positioning rather than broad exposure, with focus on assets demonstrating relative strength and clean technical breakouts.
Disclaimer: This analysis is for informational purposes only and does not constitute financial advice. Cryptocurrency markets are highly volatile and unpredictable. All trading decisions should be made based on your own research and risk tolerance. Block Digest is not responsible for any financial losses incurred as a result of acting on this content.