
Market Context
Bitcoin dominance sits at approximately 55.74–55.77% across the surveyed pairs, reflecting a market environment where capital remains anchored in BTC rather than rotating aggressively into altcoins. USDT dominance at 8.11% signals that a meaningful portion of sidelined capital has yet to re-enter risk assets, suppressing broader altcoin momentum. The overall risk appetite remains cautious, with most major altcoins trading below key short and medium-term EMAs following a prolonged corrective phase from earlier cycle highs.
Solana (SOL)
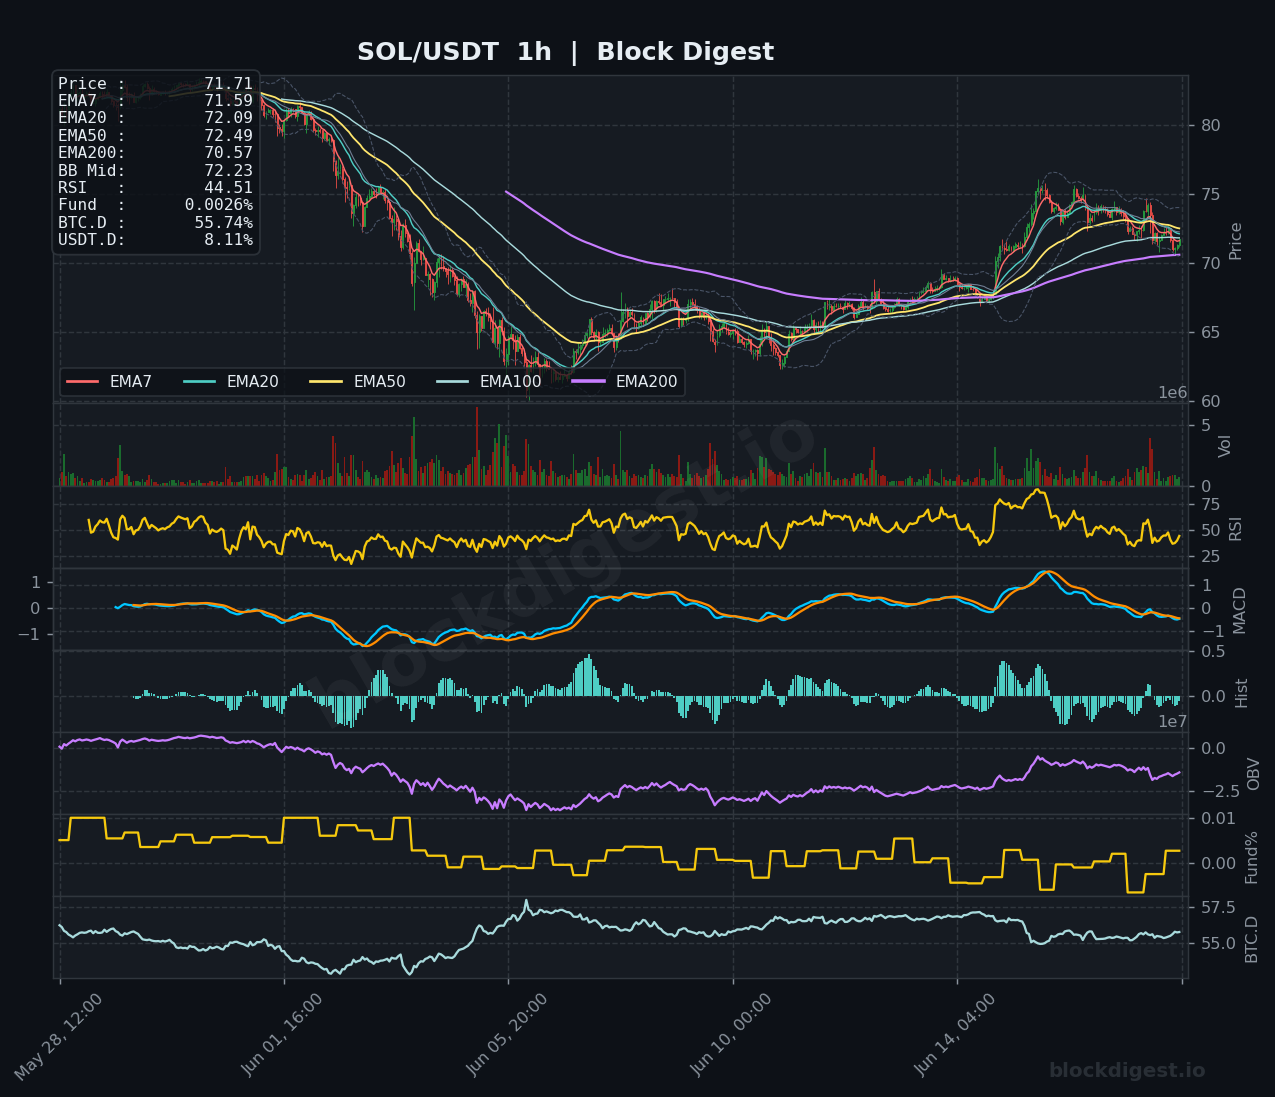
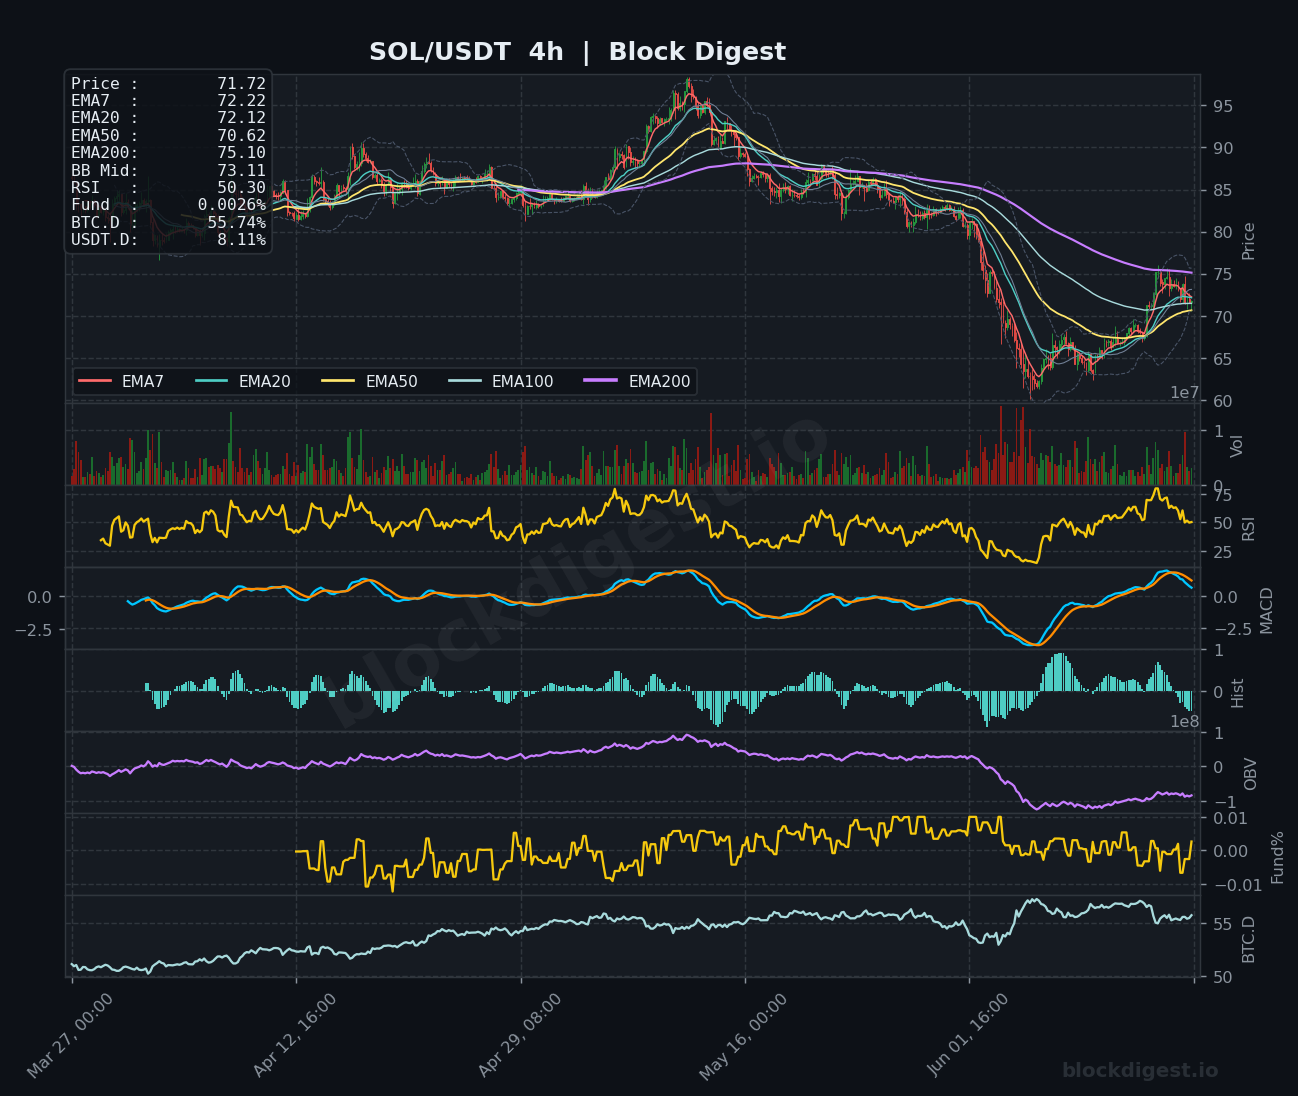
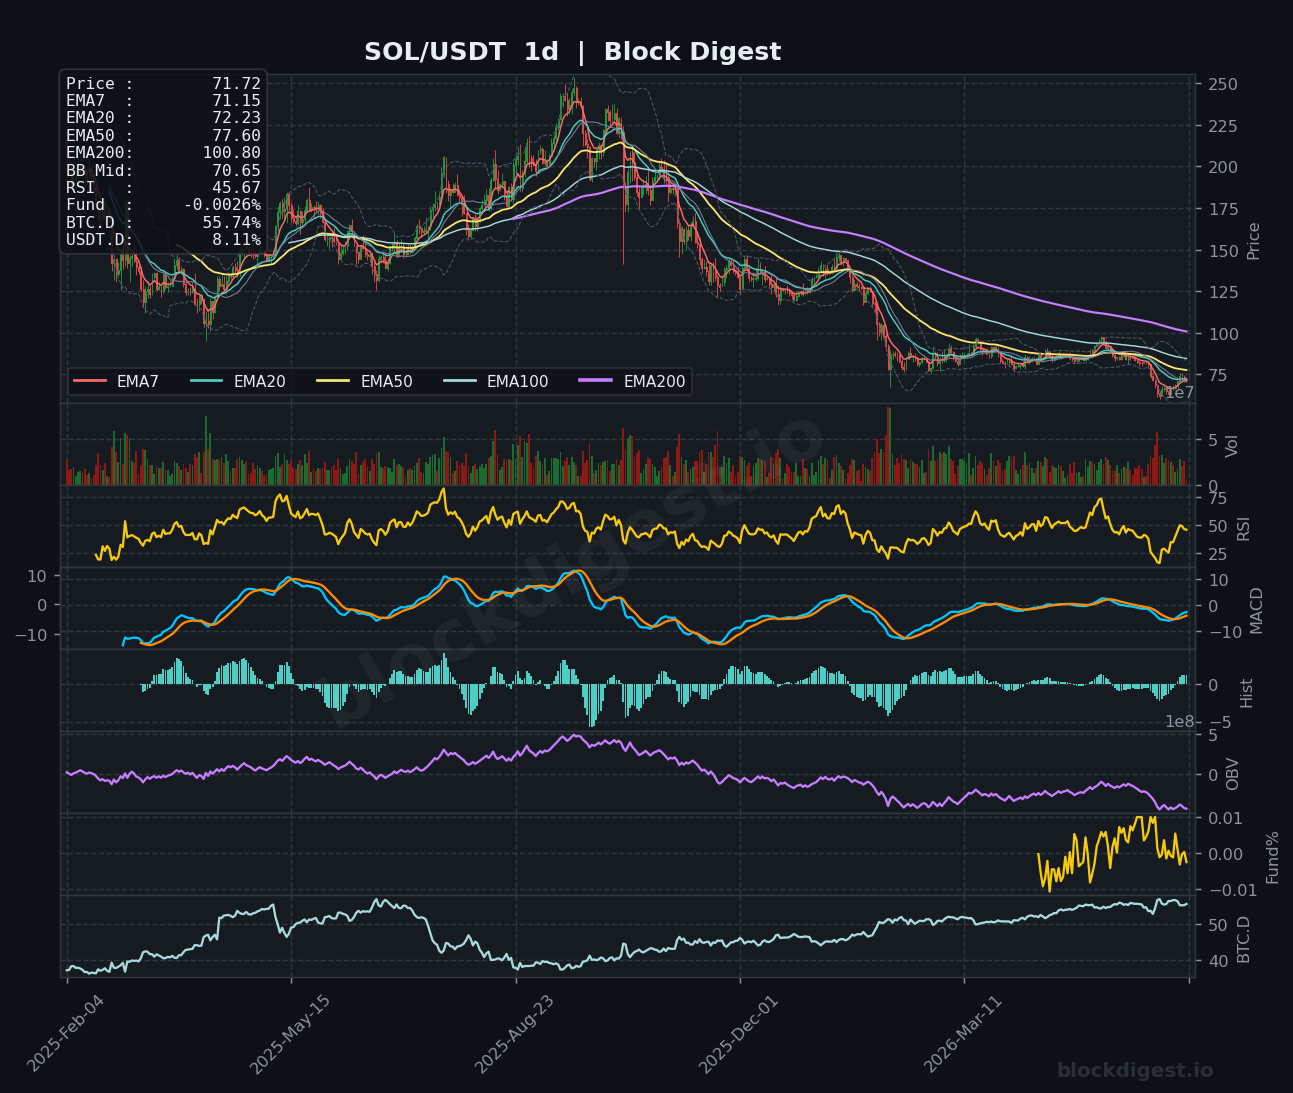
SOL is trading at $71.72, caught beneath a bearish EMA stack on the 4h and daily charts, with the EMA200 on the daily sitting far overhead at $100.80 — underscoring the structural damage sustained since the cycle peak. The 1h RSI at 44.51 and the 4h RSI at 50.30 suggest a tentative stabilization attempt, though the 4h MACD remains in marginally negative territory, and OBV on multiple timeframes continues to trend downward, indicating persistent distribution. Immediate resistance clusters around the $72–$72.50 zone (EMA7/EMA20 on the 1h), with firmer resistance at $77.60 (daily EMA50); near-term support is seen at the $68–$70 area. Short-term bias is neutral-to-bearish until SOL can decisively reclaim the $74–$75 range with volume confirmation.
XRP (XRP)
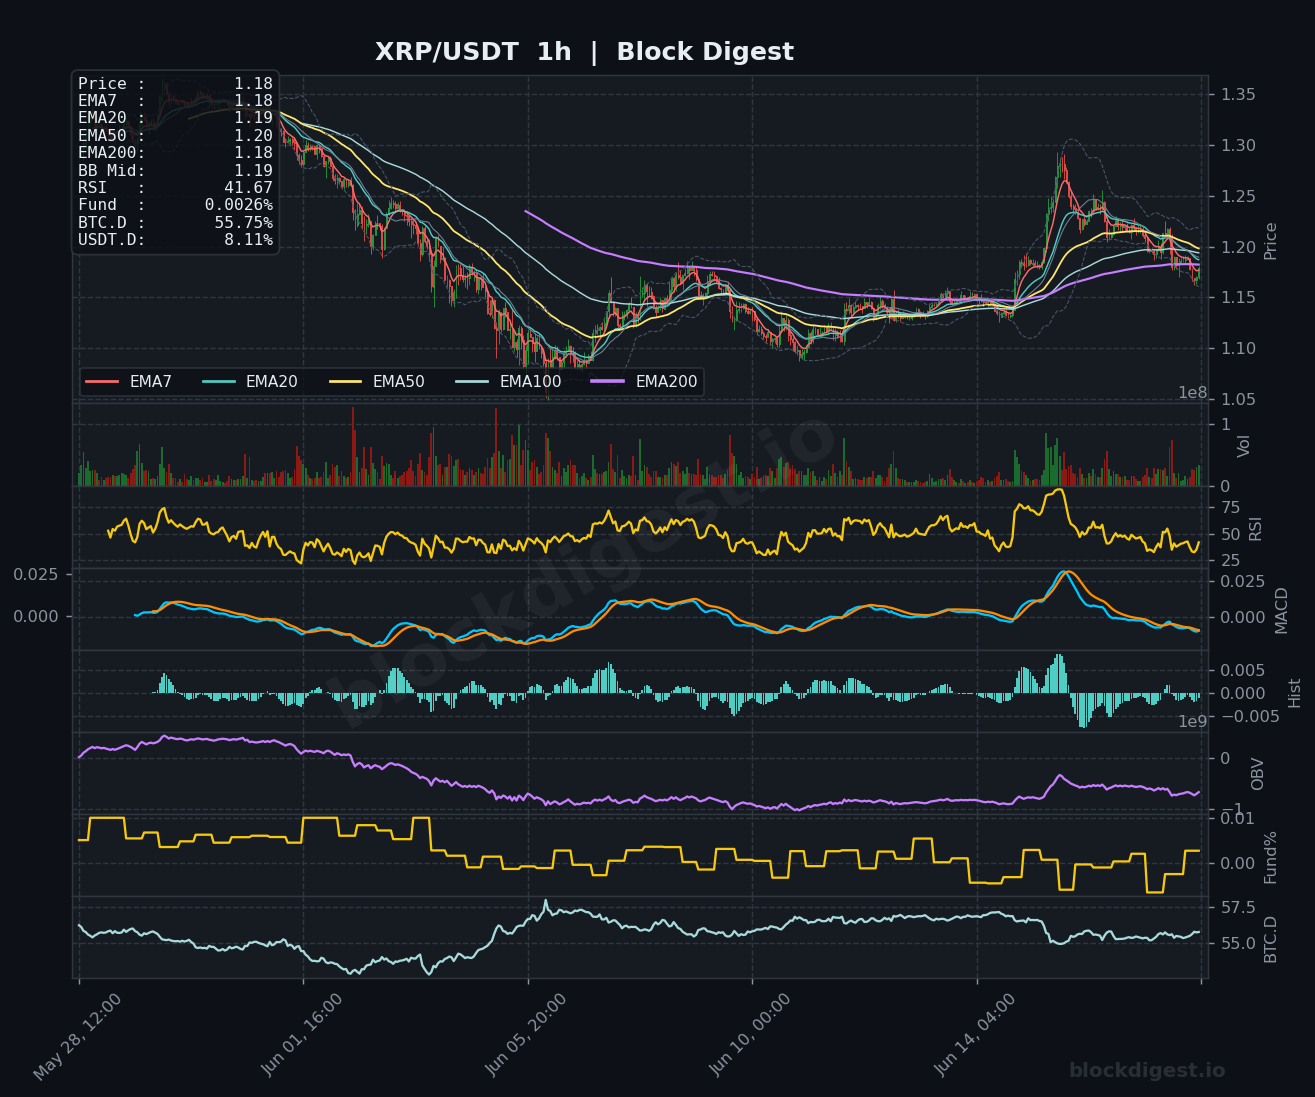
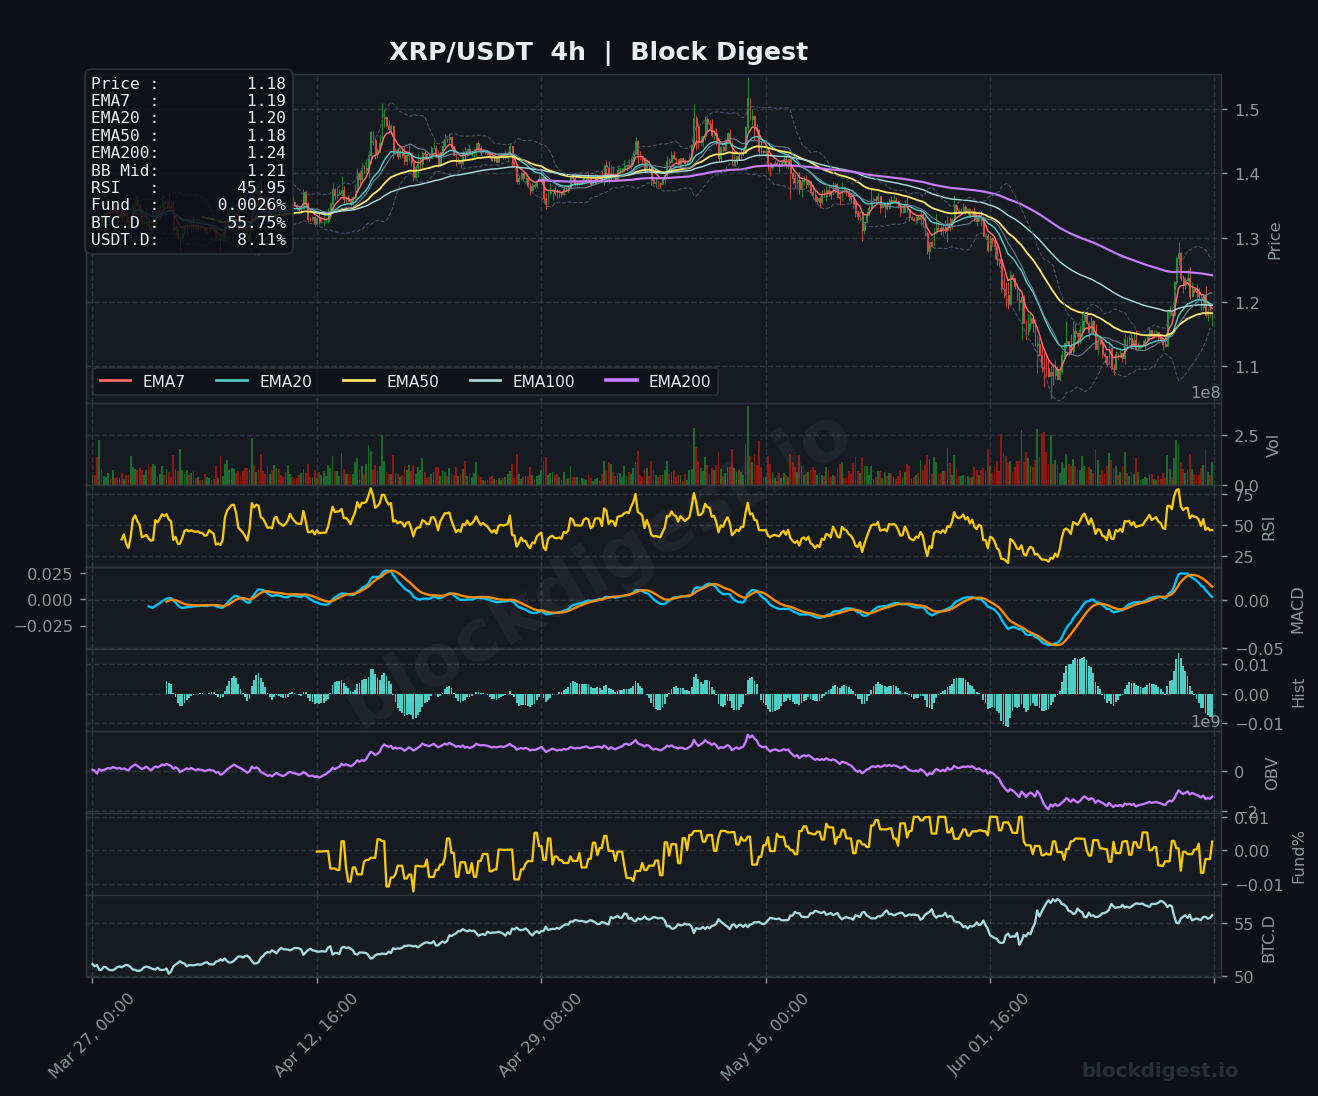
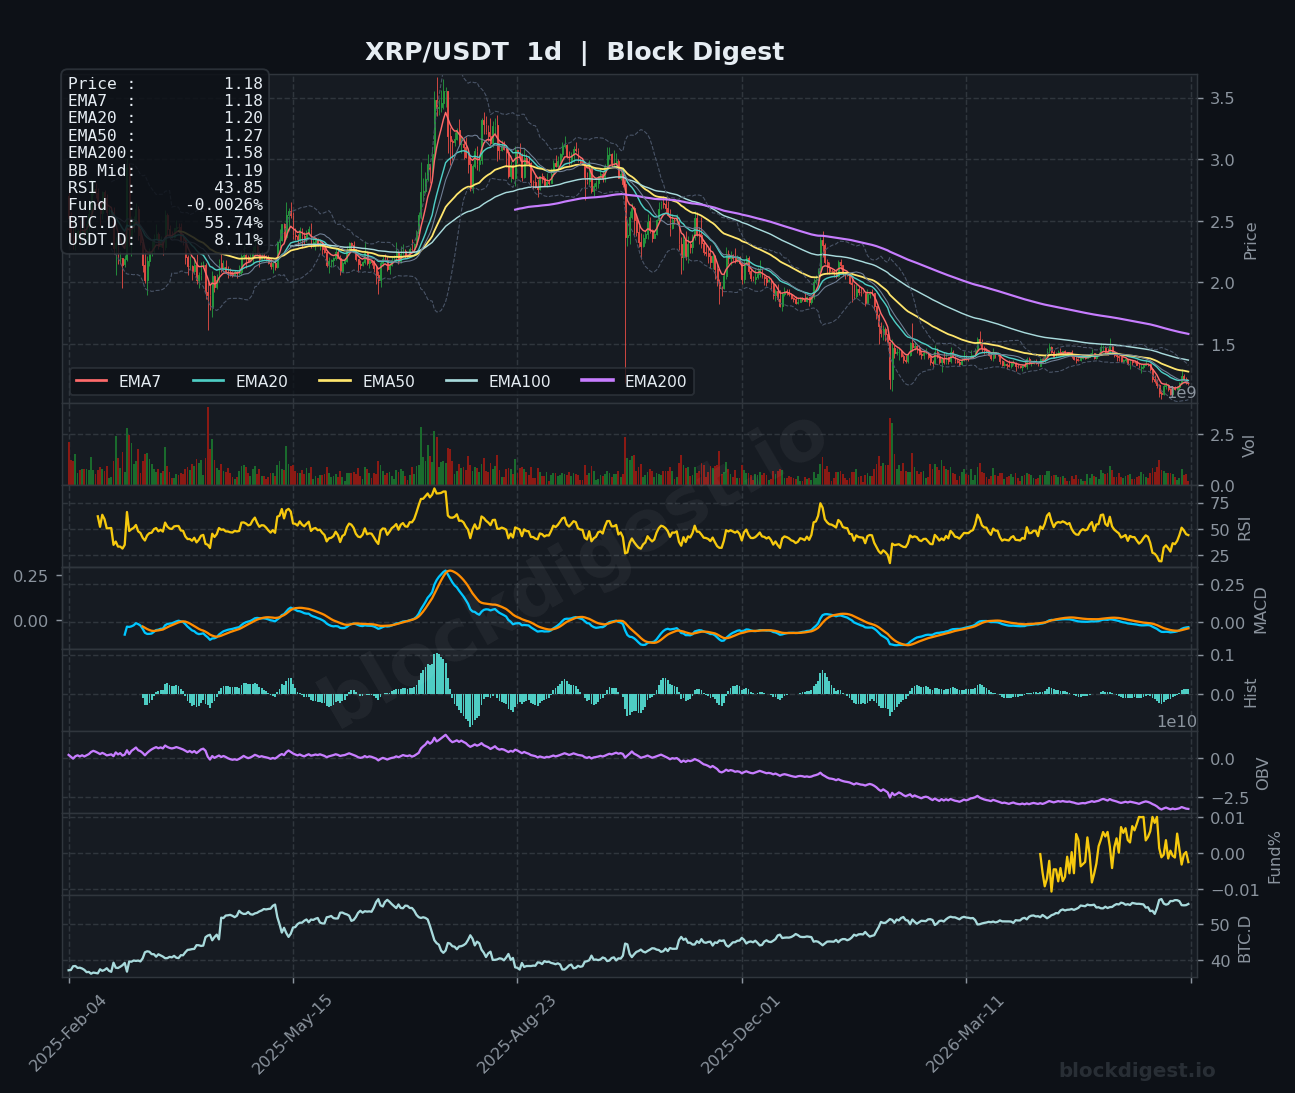
XRP is trading at $1.18, sitting below its 1h EMA20 ($1.19) and EMA50 ($1.20), with the daily EMA200 at $1.58 acting as a distant structural ceiling. The 1h RSI at 41.67 and the daily RSI at 43.85 both reflect subdued momentum without yet triggering oversold conditions that might attract strong buying interest. The 4h MACD has been attempting a bullish crossover from deeply negative levels, but OBV on the daily chart continues to slope lower, confirming that accumulation has not yet meaningfully materialized. Key support lies at the $1.10–$1.12 region, while a recovery above $1.25–$1.27 (4h EMA200 and daily EMA50) would be needed to shift the bias to neutral; near-term outlook remains bearish.
BNB (BNB)
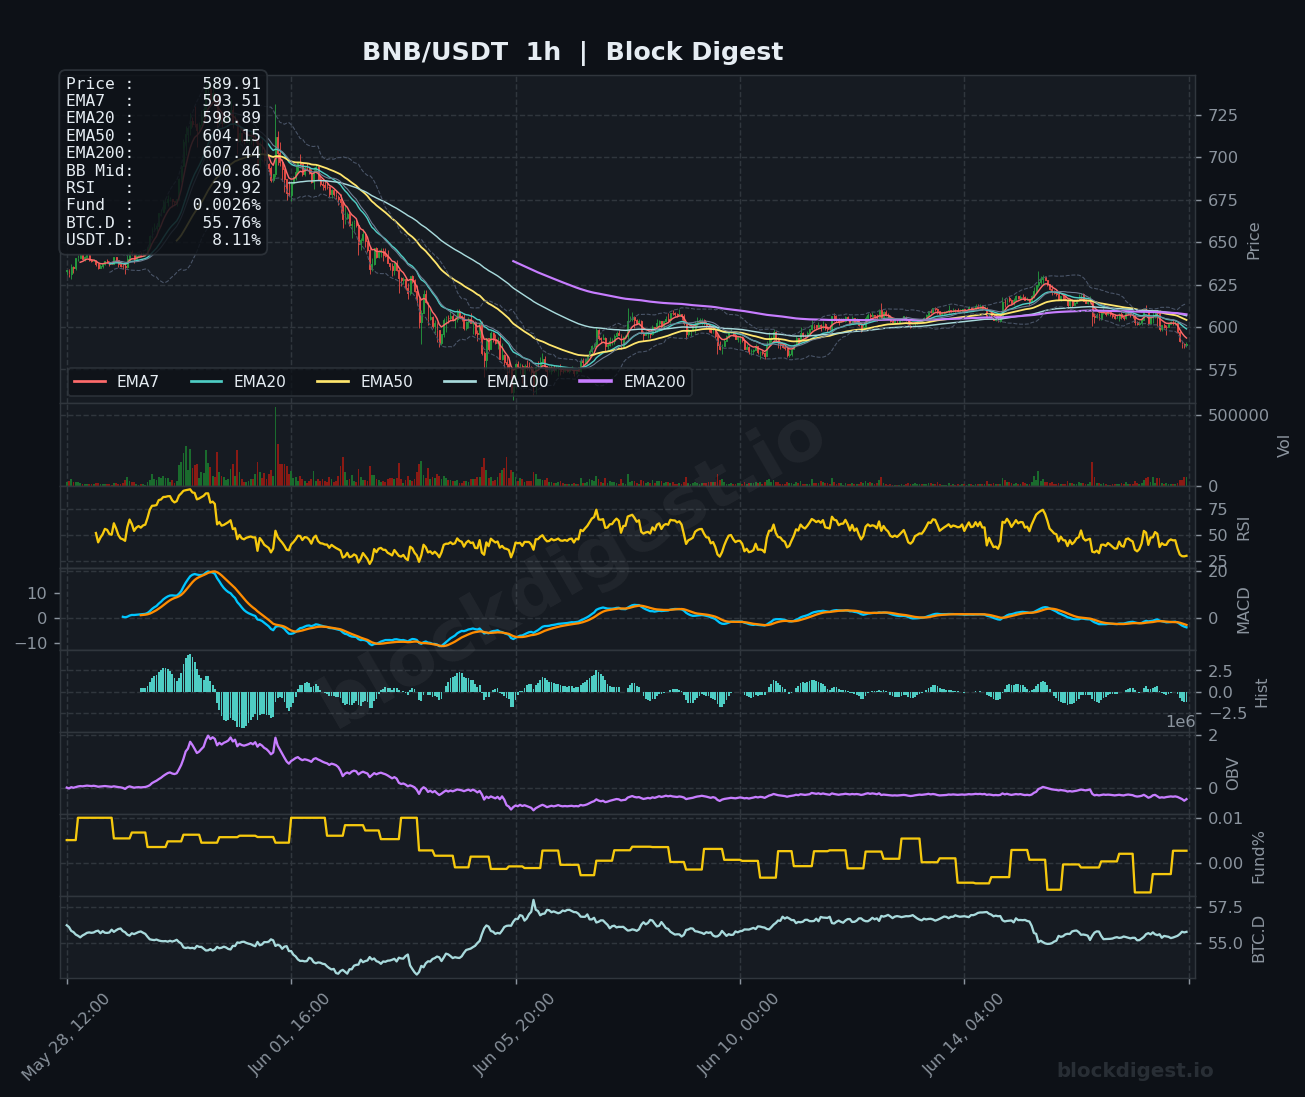
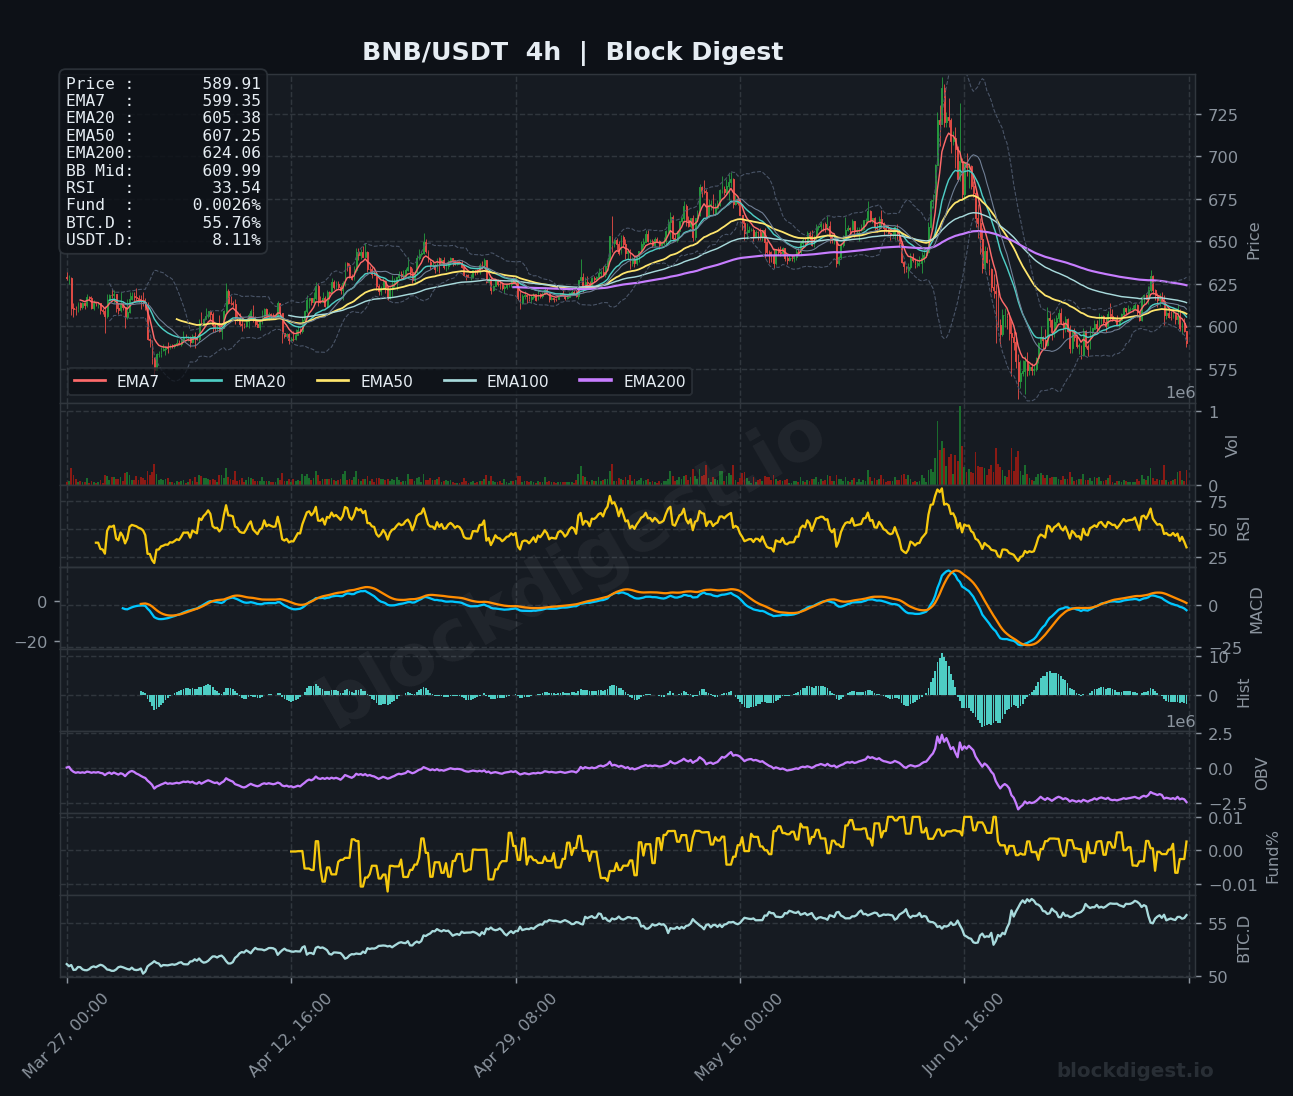
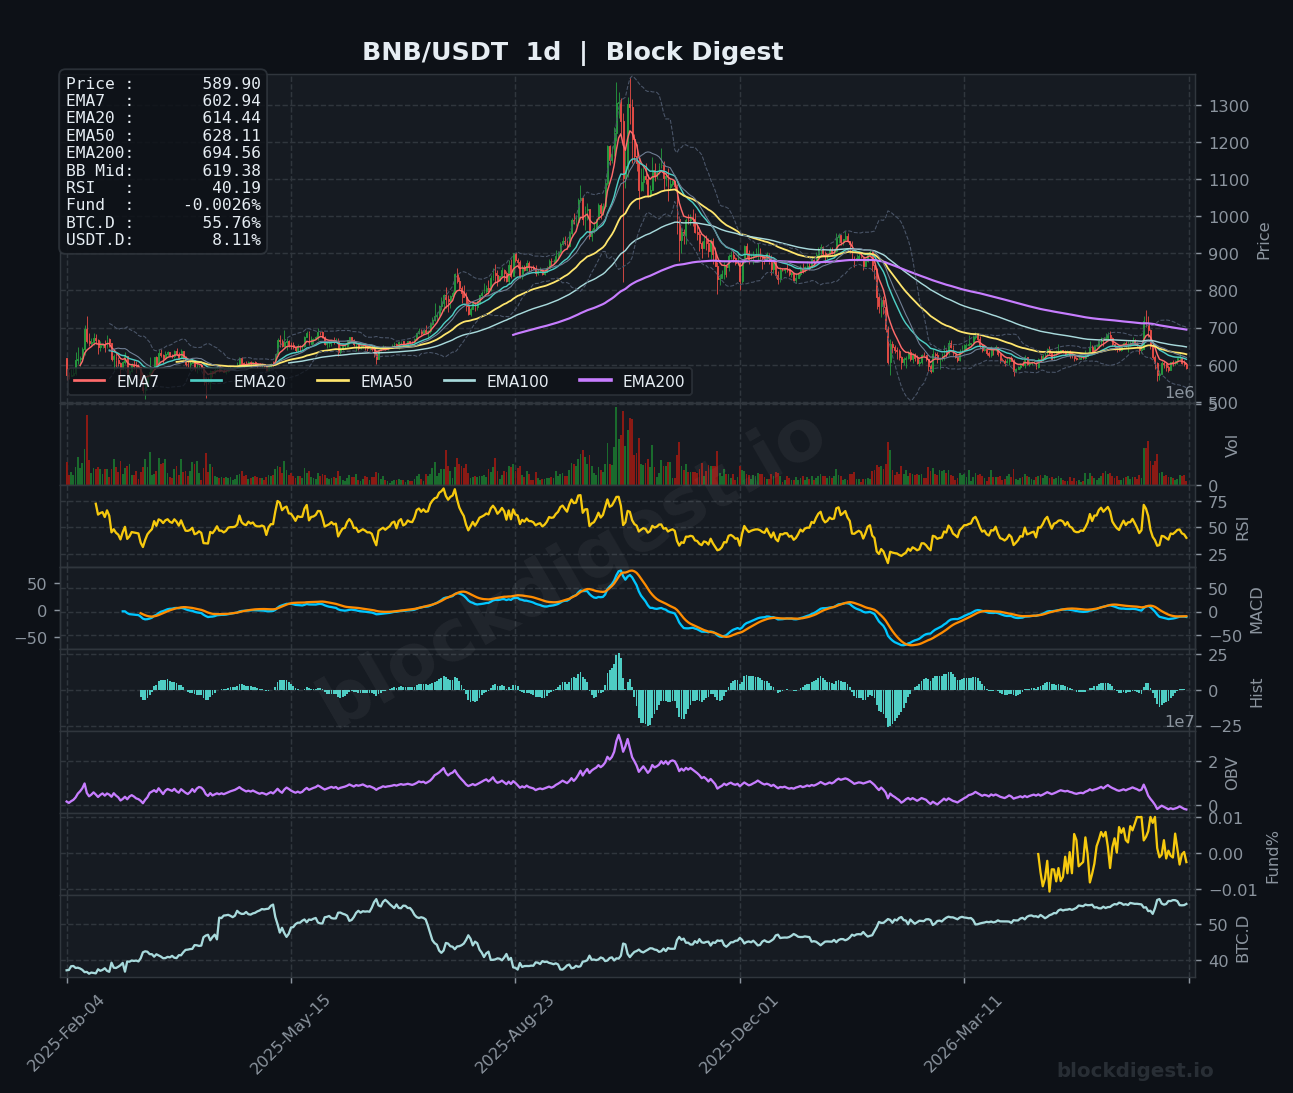
BNB is trading at $589.90, with the 1h RSI printing a notable 29.92 — approaching oversold territory and suggesting short-term selling pressure may be nearing exhaustion. The 4h chart shows price trading well beneath all major EMAs following a sharp post-peak decline from $725+, with the 4h RSI at 33.54 confirming the ongoing bearish momentum on the intermediate timeframe. The daily chart RSI at 40.19 and a bearish EMA stack (daily EMA200 at $694.56) paint a structurally weak picture, and the daily OBV remains in steep decline. Immediate support is at the $575–$580 zone; a sustained reclaim of $610–$625 would be required to suggest any meaningful recovery, leaving the short-term bias cautiously bearish with a watch for oversold bounces.
Dogecoin (DOGE)
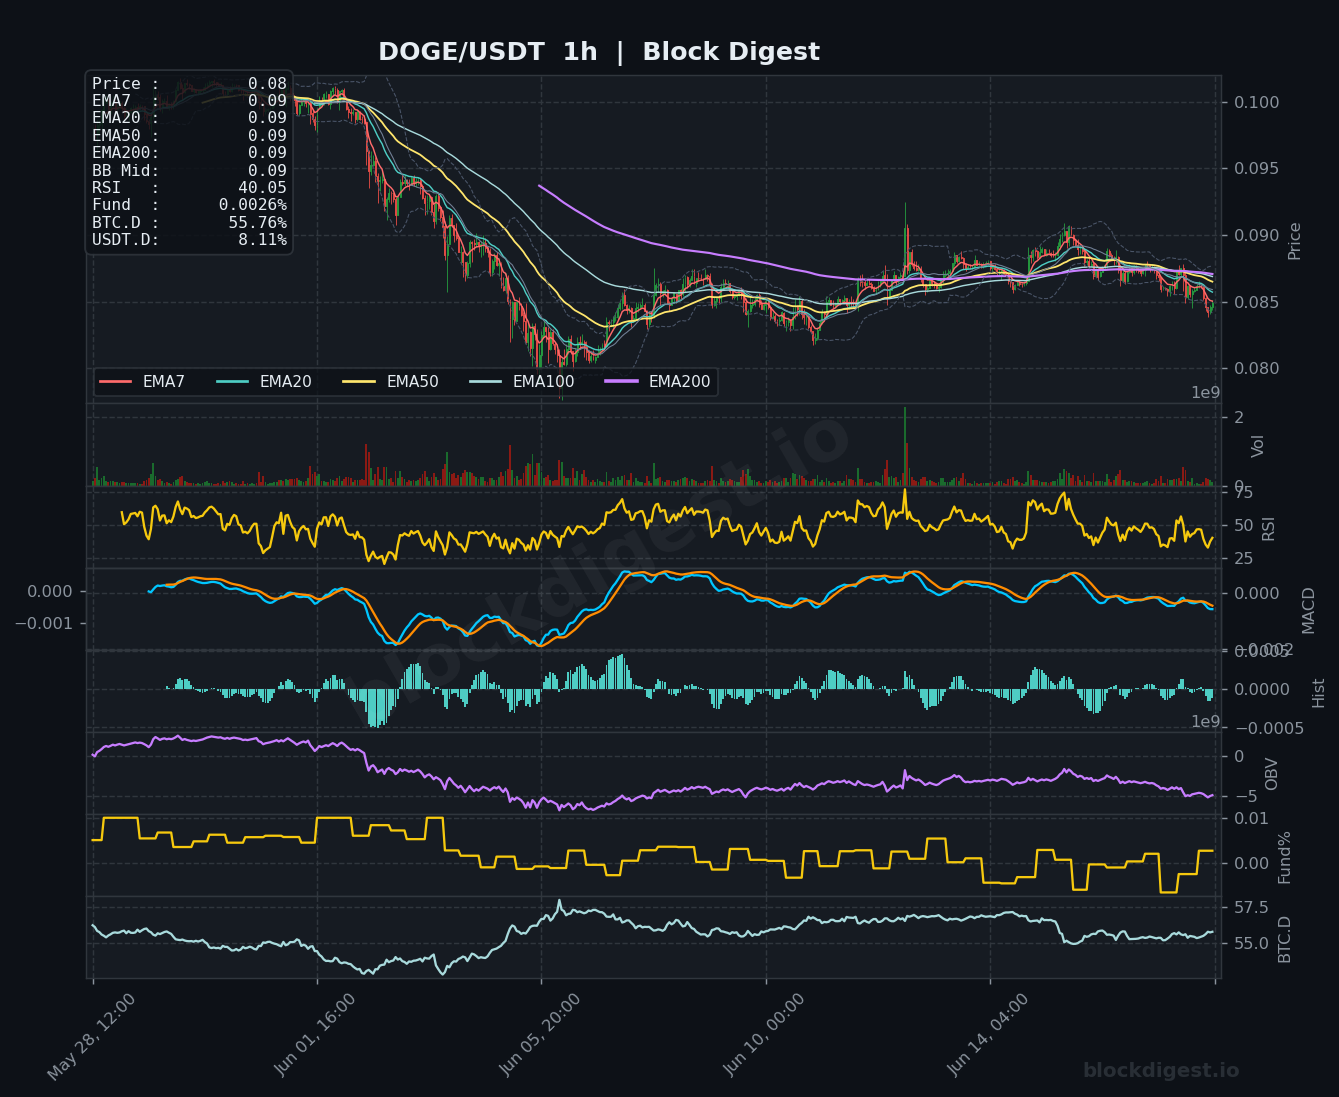
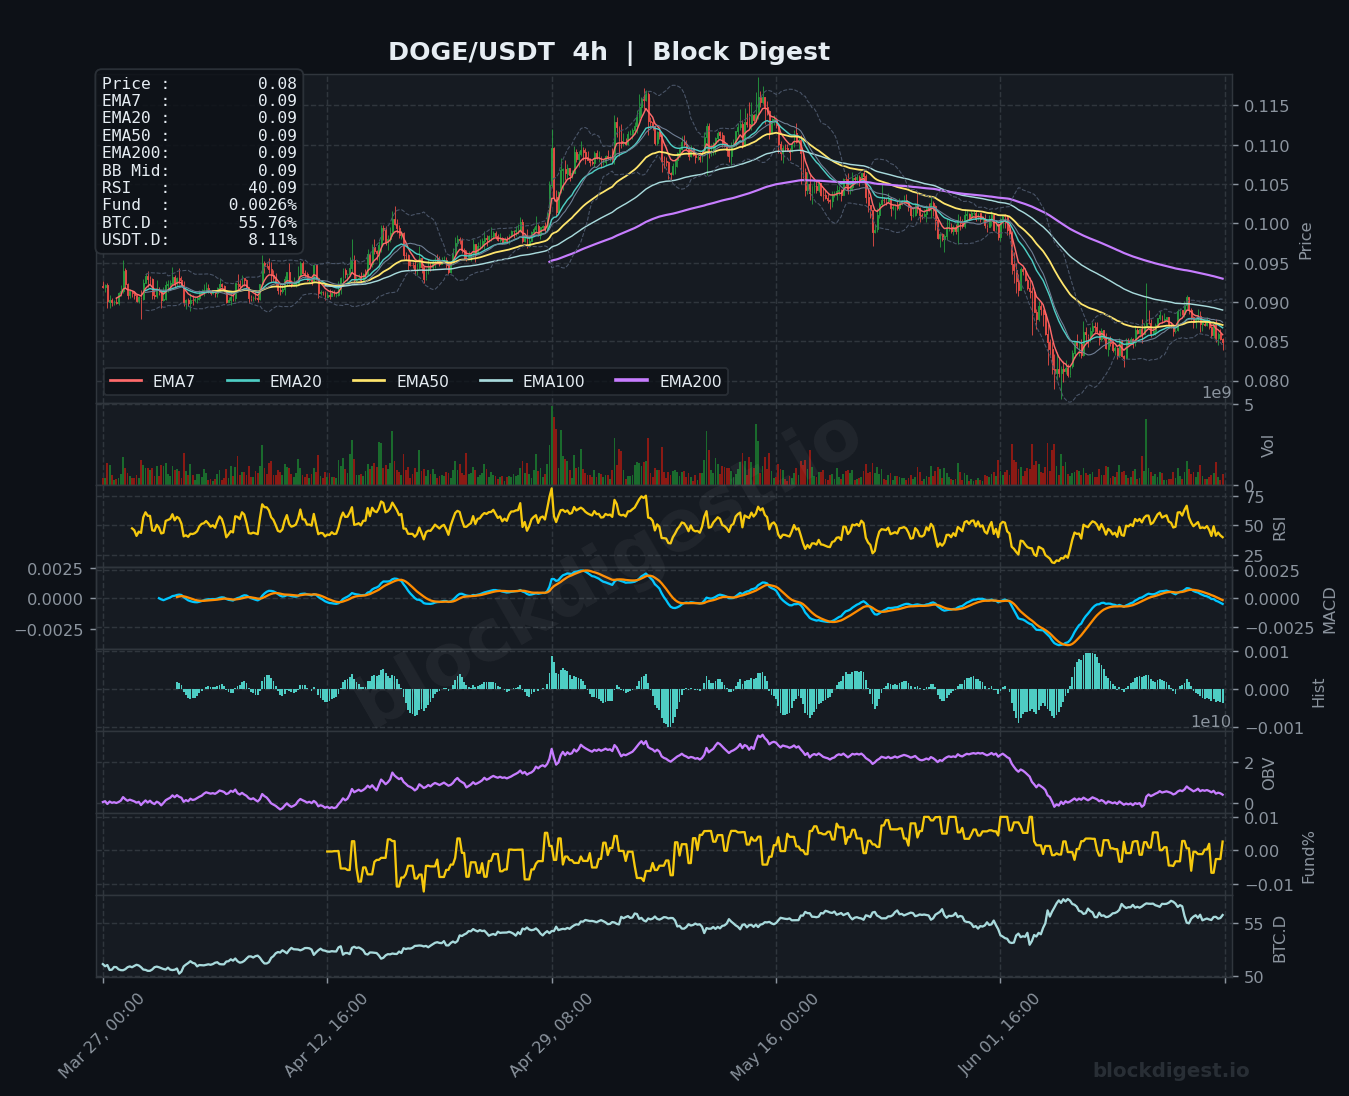
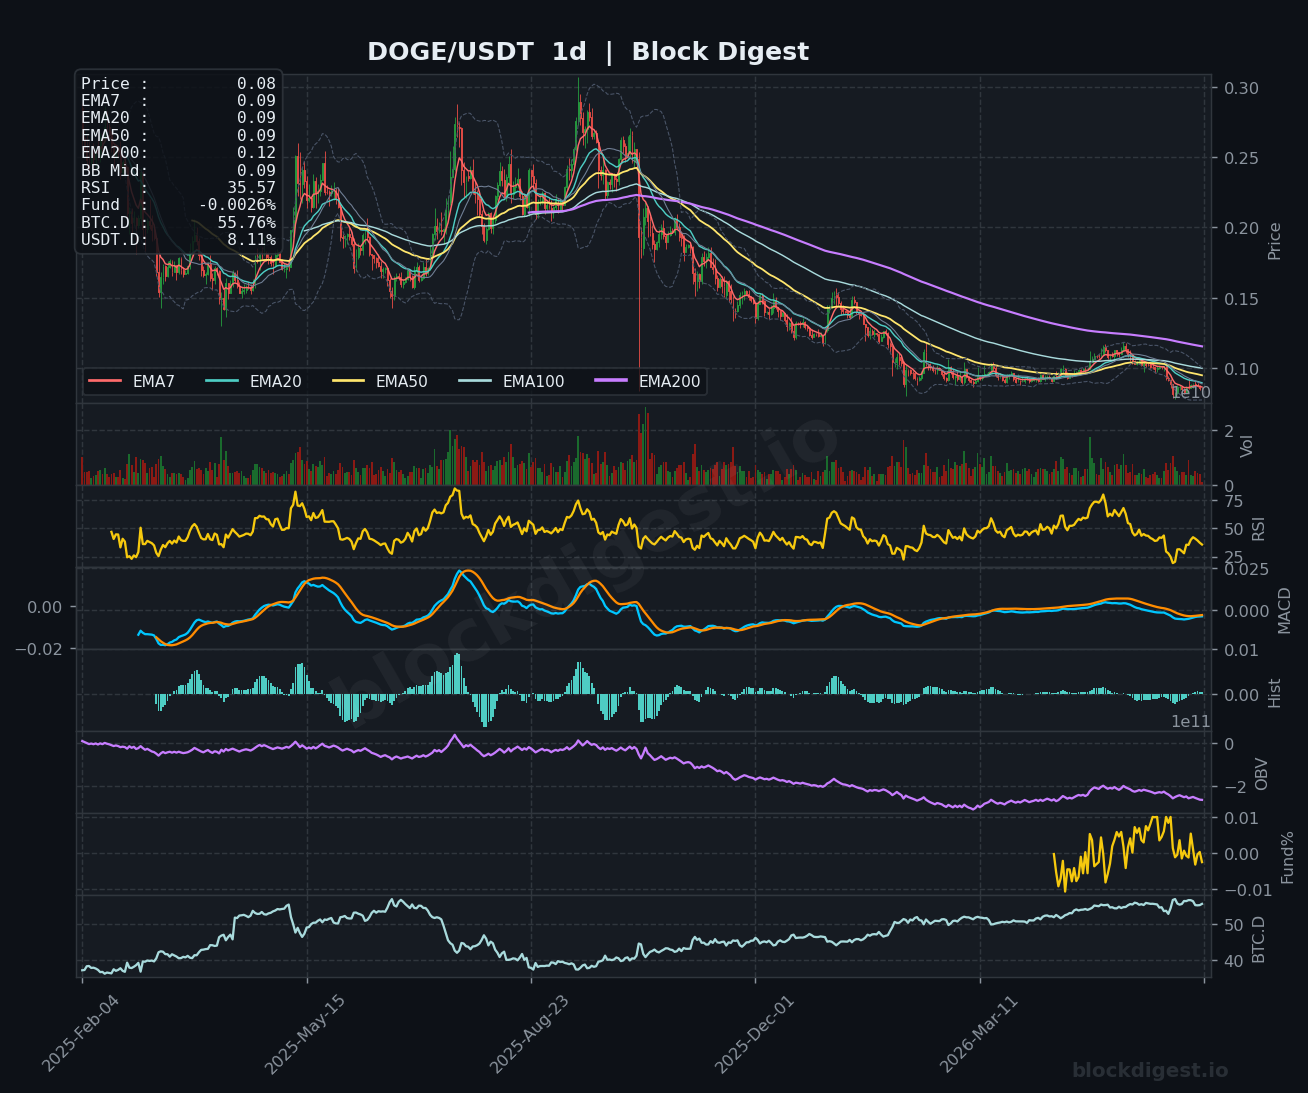
DOGE is trading at $0.0845, pressured beneath a tightly clustered EMA stack on the 1h that sits around $0.088–$0.09, indicating overhead supply across all near-term averages. The 1h RSI at 40.05 and 4h RSI at 40.09 are both in bearish territory without being technically oversold, while the daily RSI at 35.57 shows the daily chart approaching levels where bounces have historically occurred. The daily MACD remains in negative territory with a slight bearish histogram, and OBV on both the 4h and daily timeframes has been in consistent decline, pointing to ongoing distribution. Critical support sits at the $0.080 level; a reclaim of $0.092–$0.095 would be necessary to neutralize the current bearish bias.
Litecoin (LTC)
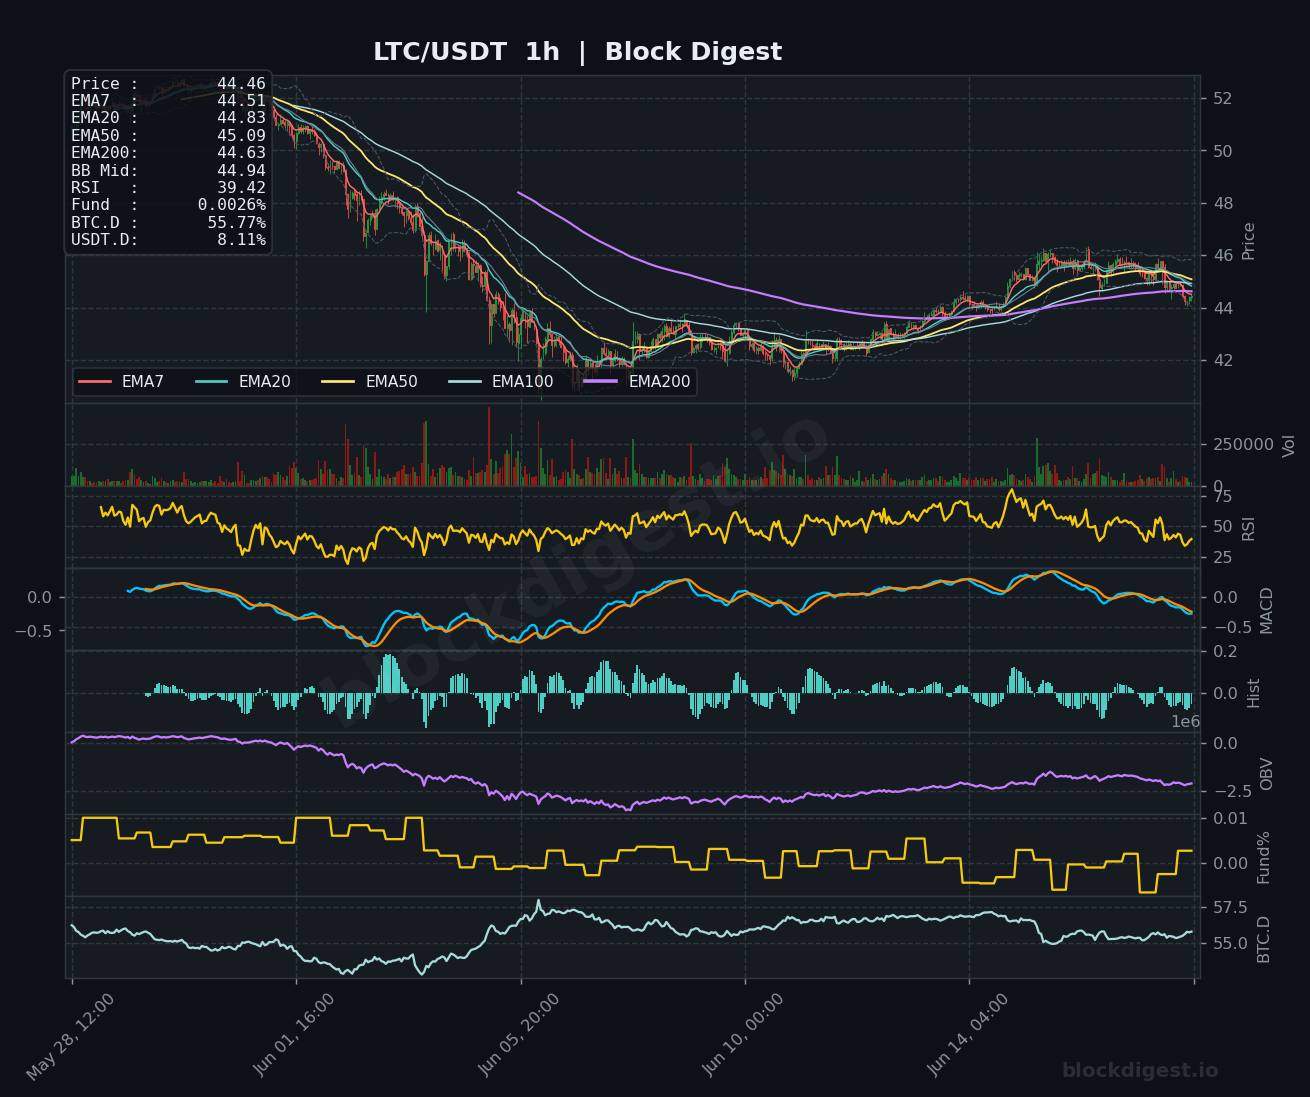
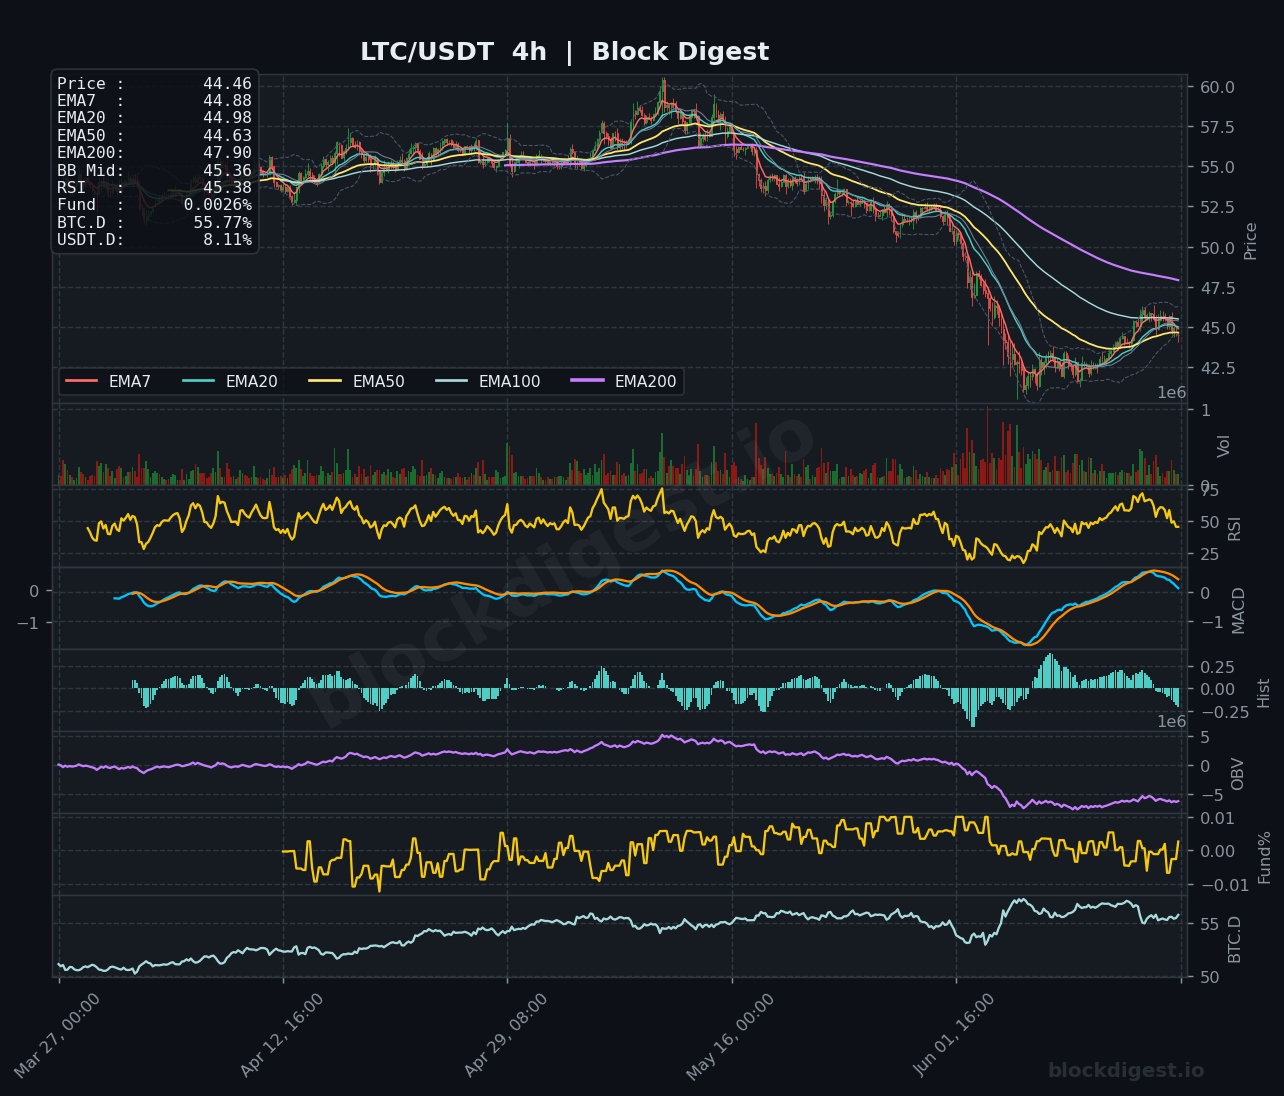
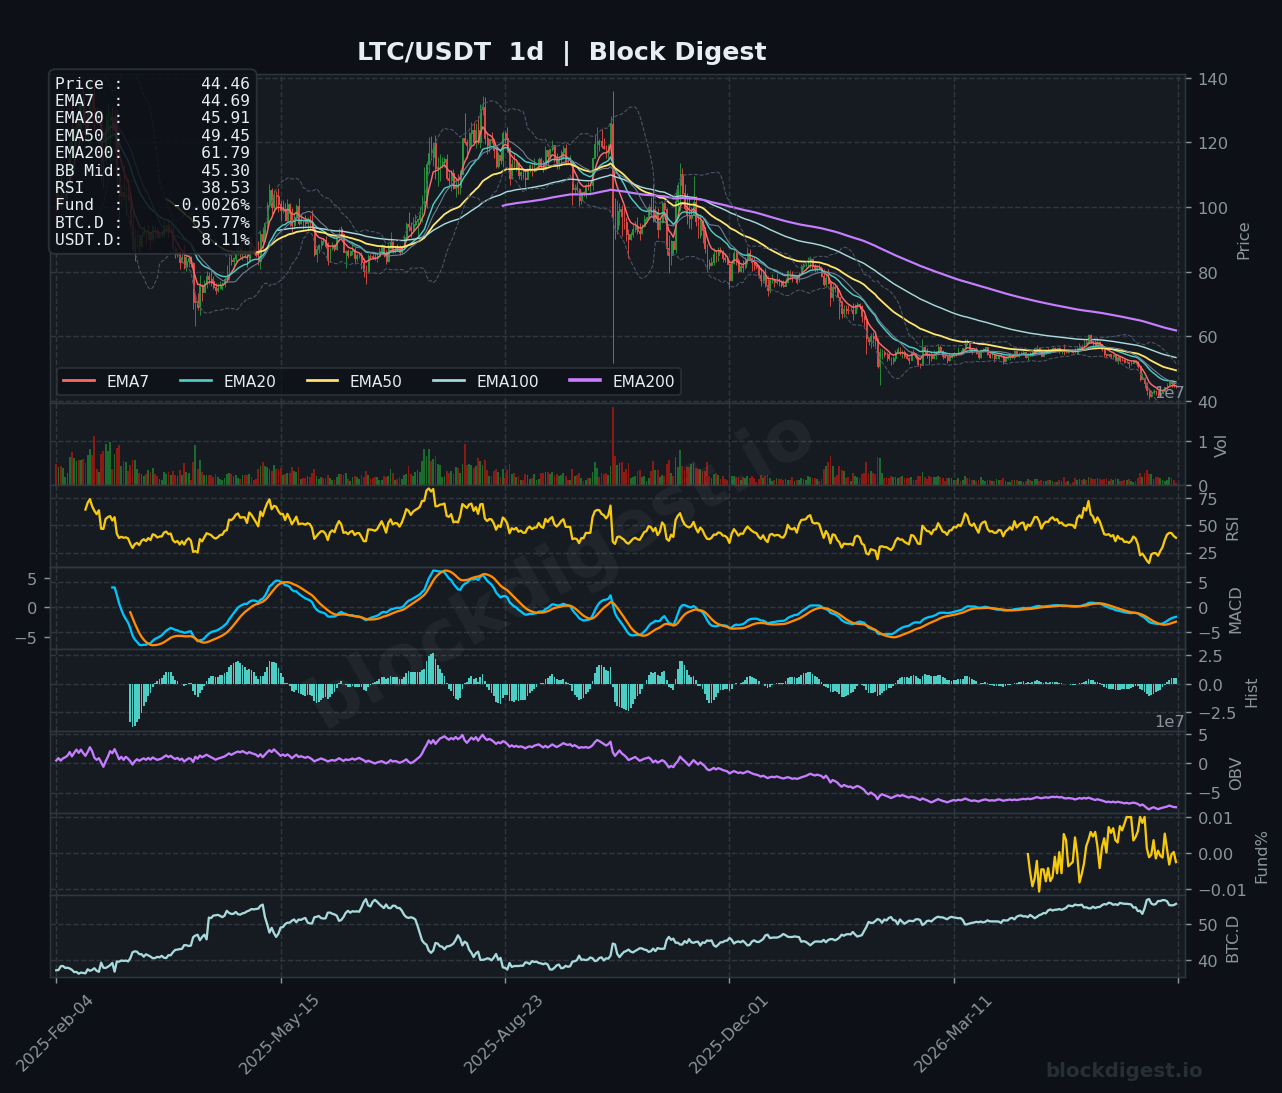
LTC is trading at $44.46, continuing its multi-month downtrend with price sitting beneath all major EMAs on the 1h, 4h, and daily charts — the daily EMA200 at $61.79 highlights just how severe the structural deterioration has been. The 1h RSI at 39.42 and daily RSI at 38.53 are hovering near oversold thresholds, with the 4h RSI at 45.38 marginally better but still pointing to weak momentum. The 4h MACD is attempting a slight recovery from deeply negative levels, but the daily OBV shows a relentless downtrend in volume-weighted selling pressure. Support is seen at the $42.00–$43.00 zone; resistance is stacked from $45.50 through $49.45 (daily EMA50), keeping the short-term bias firmly bearish.
TRON (TRX)
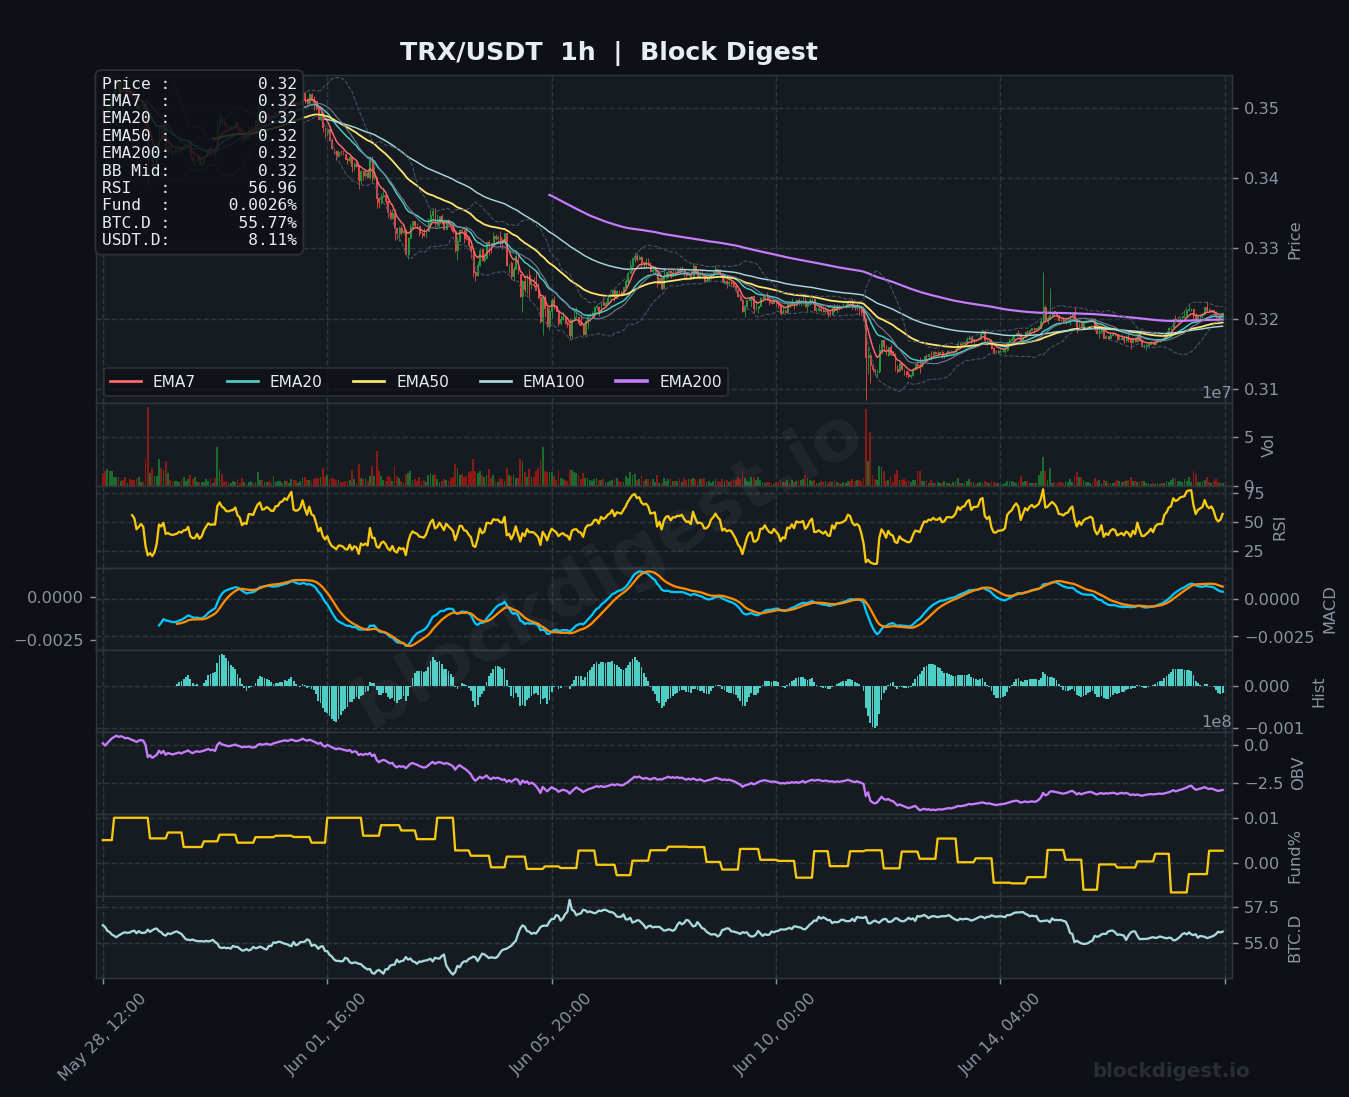
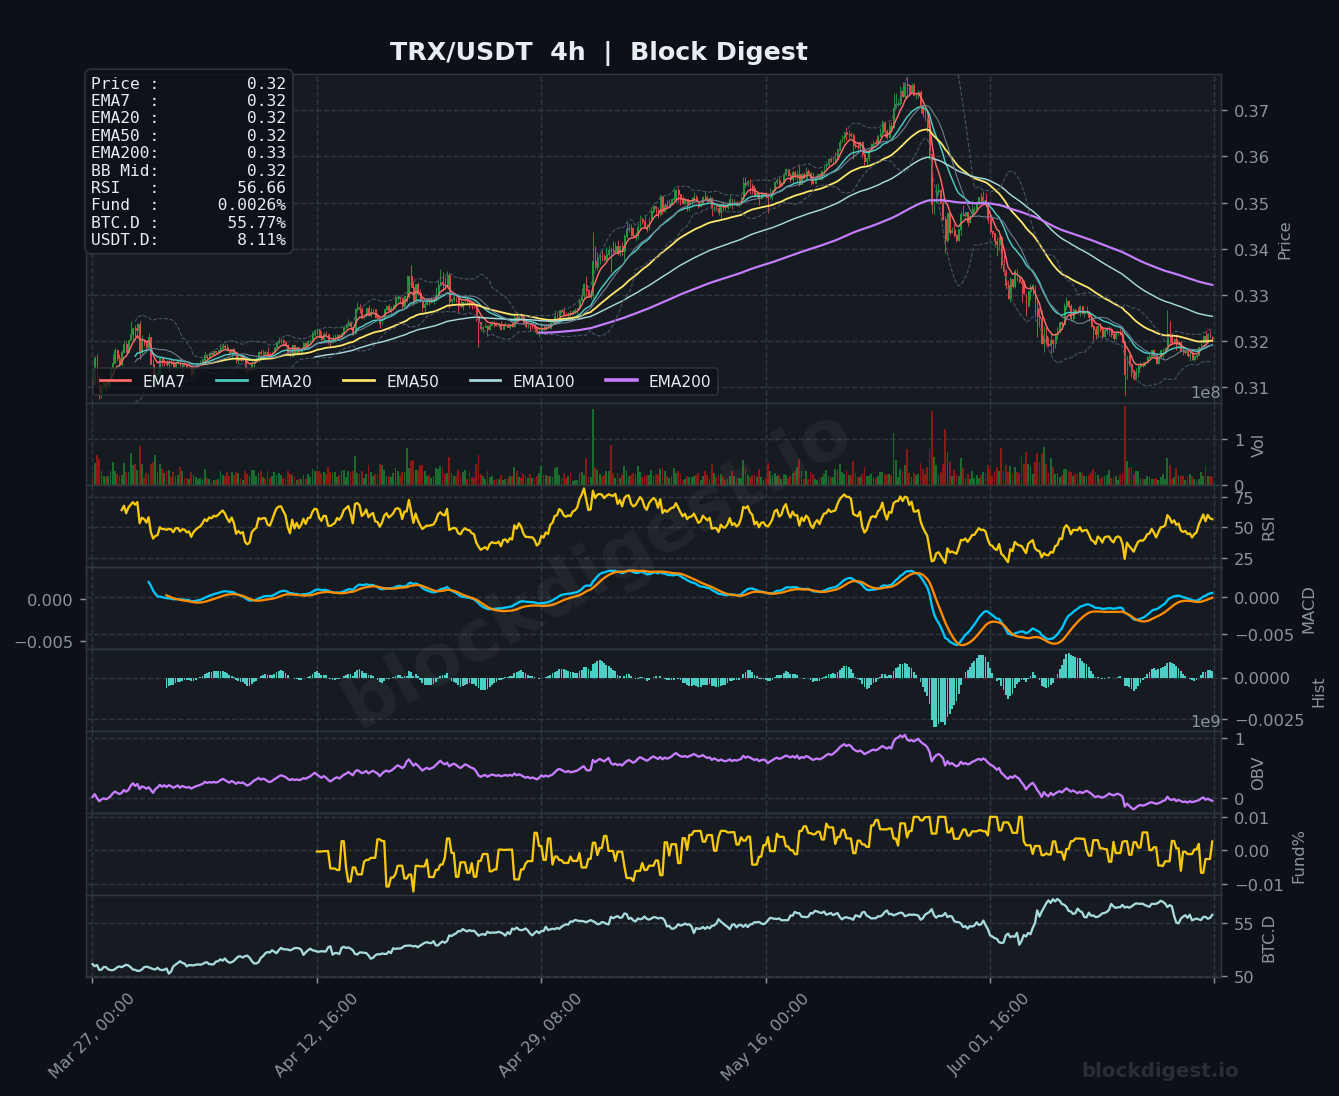
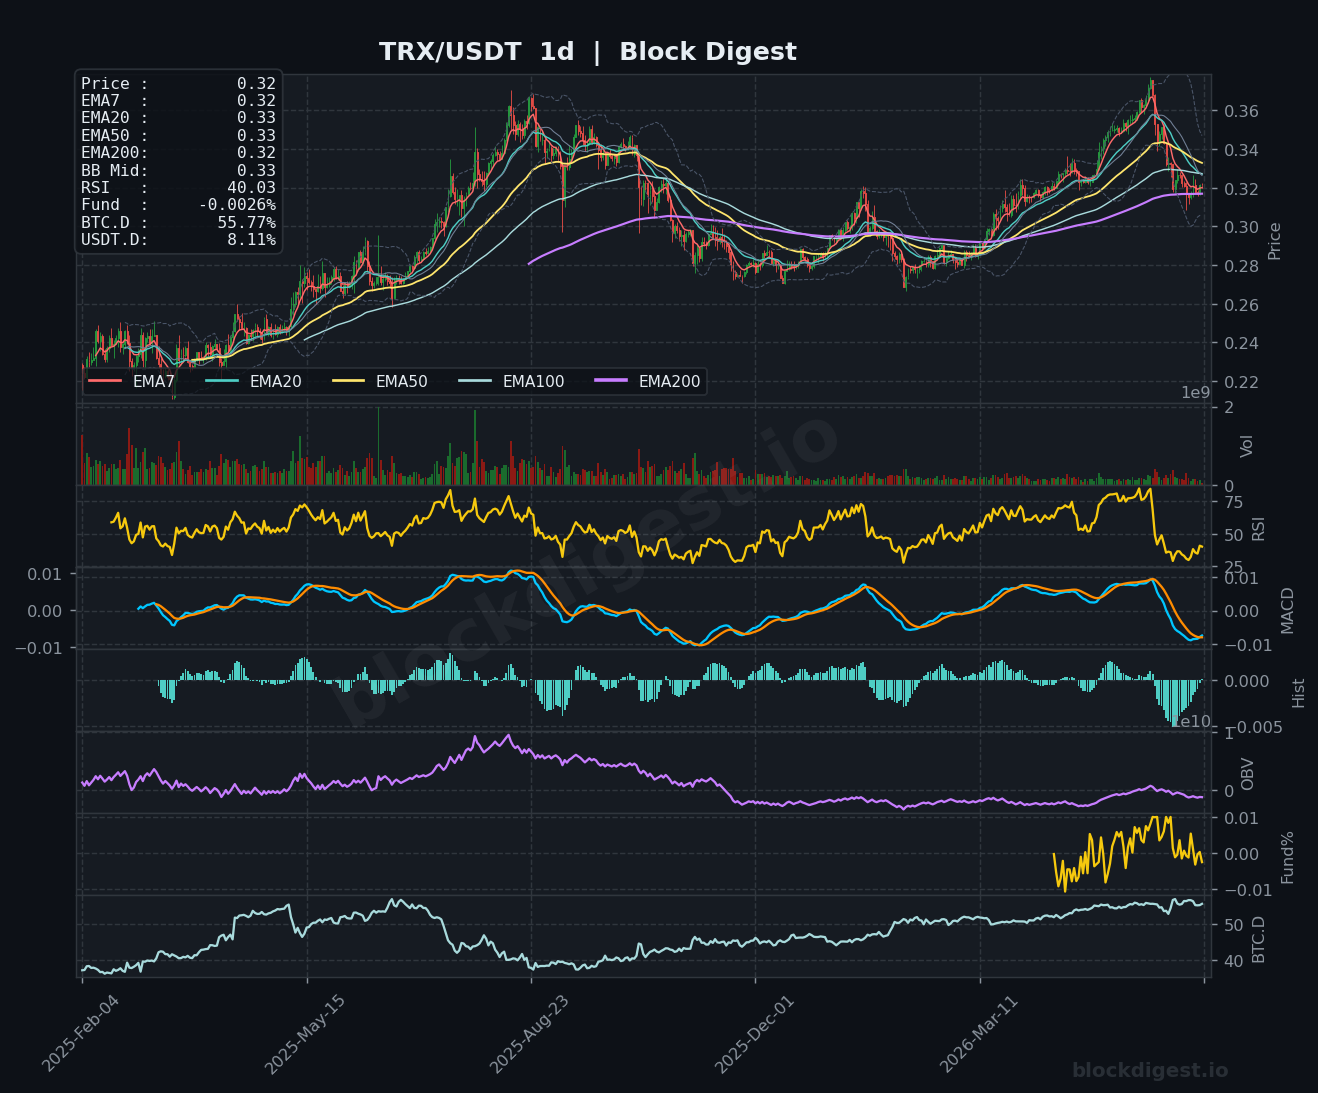
TRX stands out as the relative outperformer in this group, trading at $0.32 with a 1h RSI of 56.96 and 4h RSI of 56.66 — both above the neutral 50 level, which is notably stronger than its peers. Price is broadly consolidating around the $0.31–$0.32 range on the 1h and 4h charts, with all short-term EMAs converging tightly at $0.32, suggesting a coiling period. However, the daily chart tells a more cautionary story: the daily RSI has dropped to 40.03 from overbought highs, and the MACD histogram is printing increasingly negative bars following the peak near $0.37. Support is solid at $0.31; resistance is seen at $0.33–$0.34; short-term bias is neutral with a slight bullish lean on lower timeframes, but the daily structure warrants caution.
Altcoin Outlook
The broader altcoin market as of June 18, 2026 remains in a corrective, risk-averse posture, with BTC dominance above 55% and USDT dominance at 8.11% acting as dual headwinds against sustained capital rotation into alts. Among the six coins surveyed, TRX presents the most resilient short-term setup given its near-neutral RSI readings above 56 on the 1h and 4h, while DOGE and LTC show the weakest daily structures with RSIs threatening oversold territory without yet producing convincing reversal signals. BNB’s deeply oversold 1h RSI near 30 warrants monitoring for a technical bounce, but structural resistance remains heavy across all pairs. Traders should watch for a meaningful pullback in BTC dominance and a reduction in USDT.D below 7.5% as key macro conditions that would improve the probability of a sustained altcoin recovery.
Disclaimer: This analysis is for informational purposes only and does not constitute financial advice. Cryptocurrency markets are highly volatile and unpredictable. All trading decisions should be made based on your own research and risk tolerance. Block Digest is not responsible for any financial losses incurred as a result of acting on this content.
Stay Ahead of the Market
Follow BlockDigest for crypto market intelligence, research and real-time updates.


