ETH Daily Analysis — May 12, 2026
ETH Daily Analysis – May 12, 2026
Market Overview
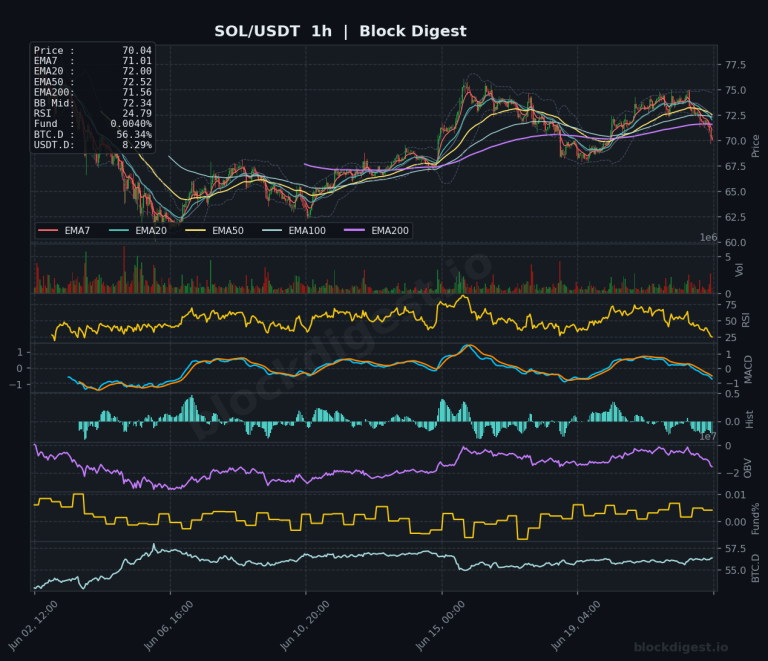
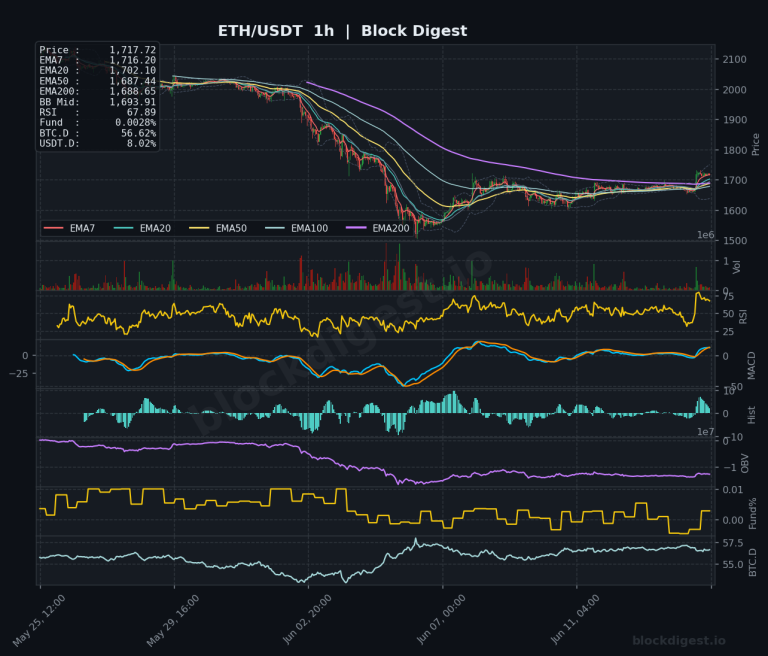
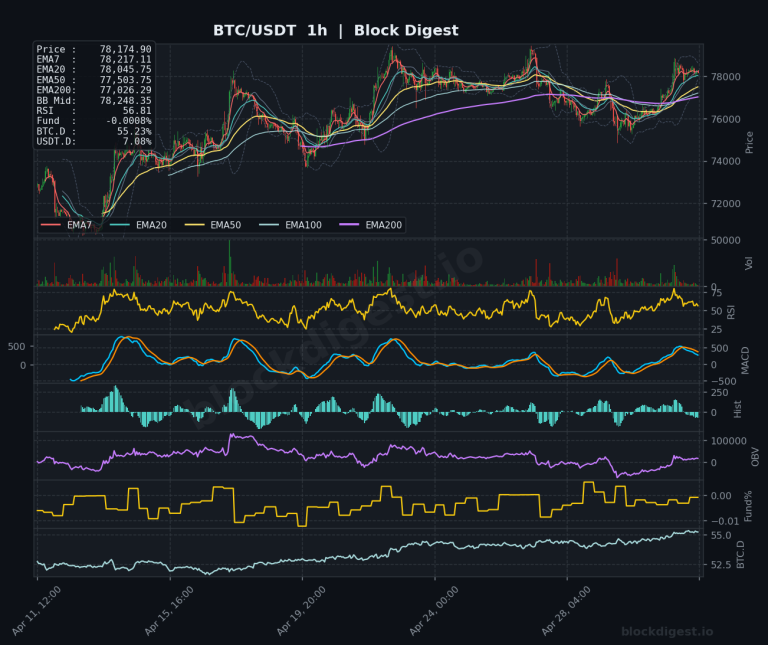
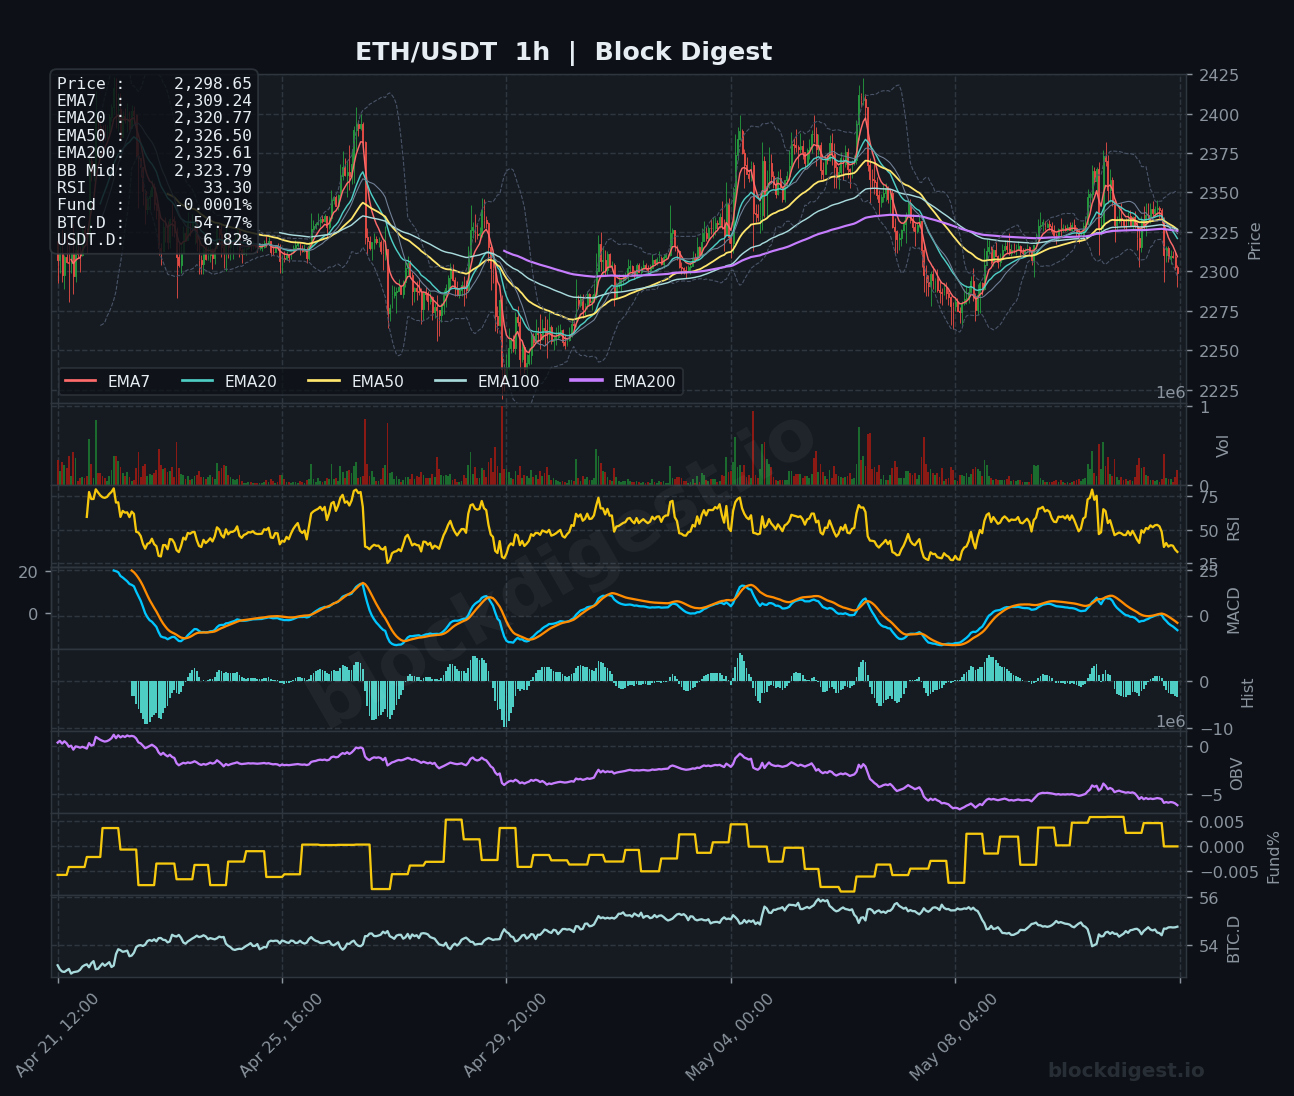
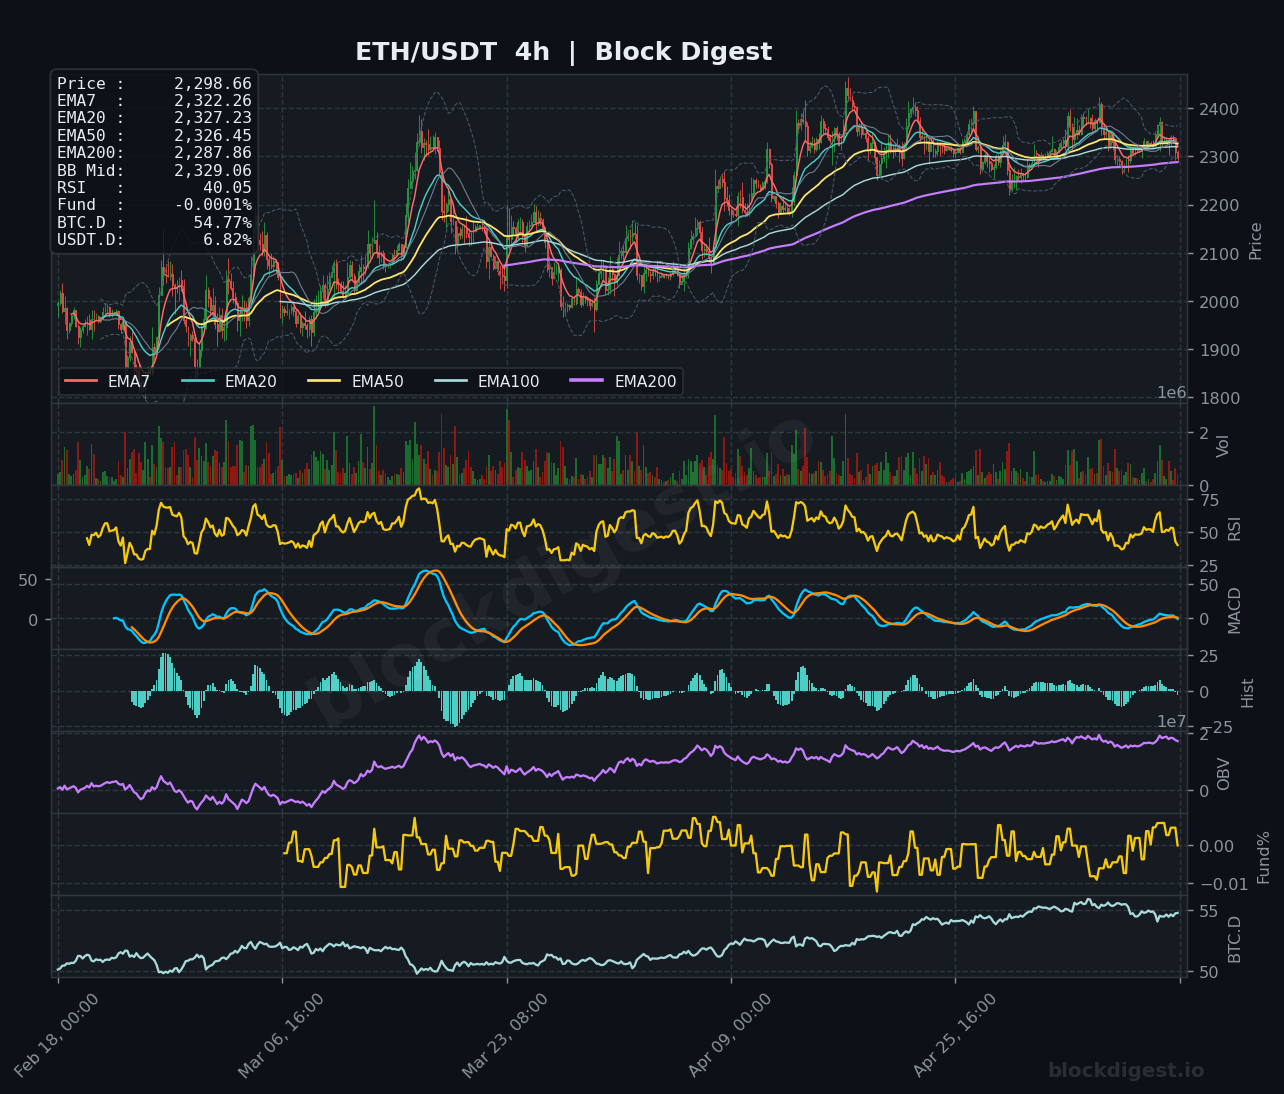
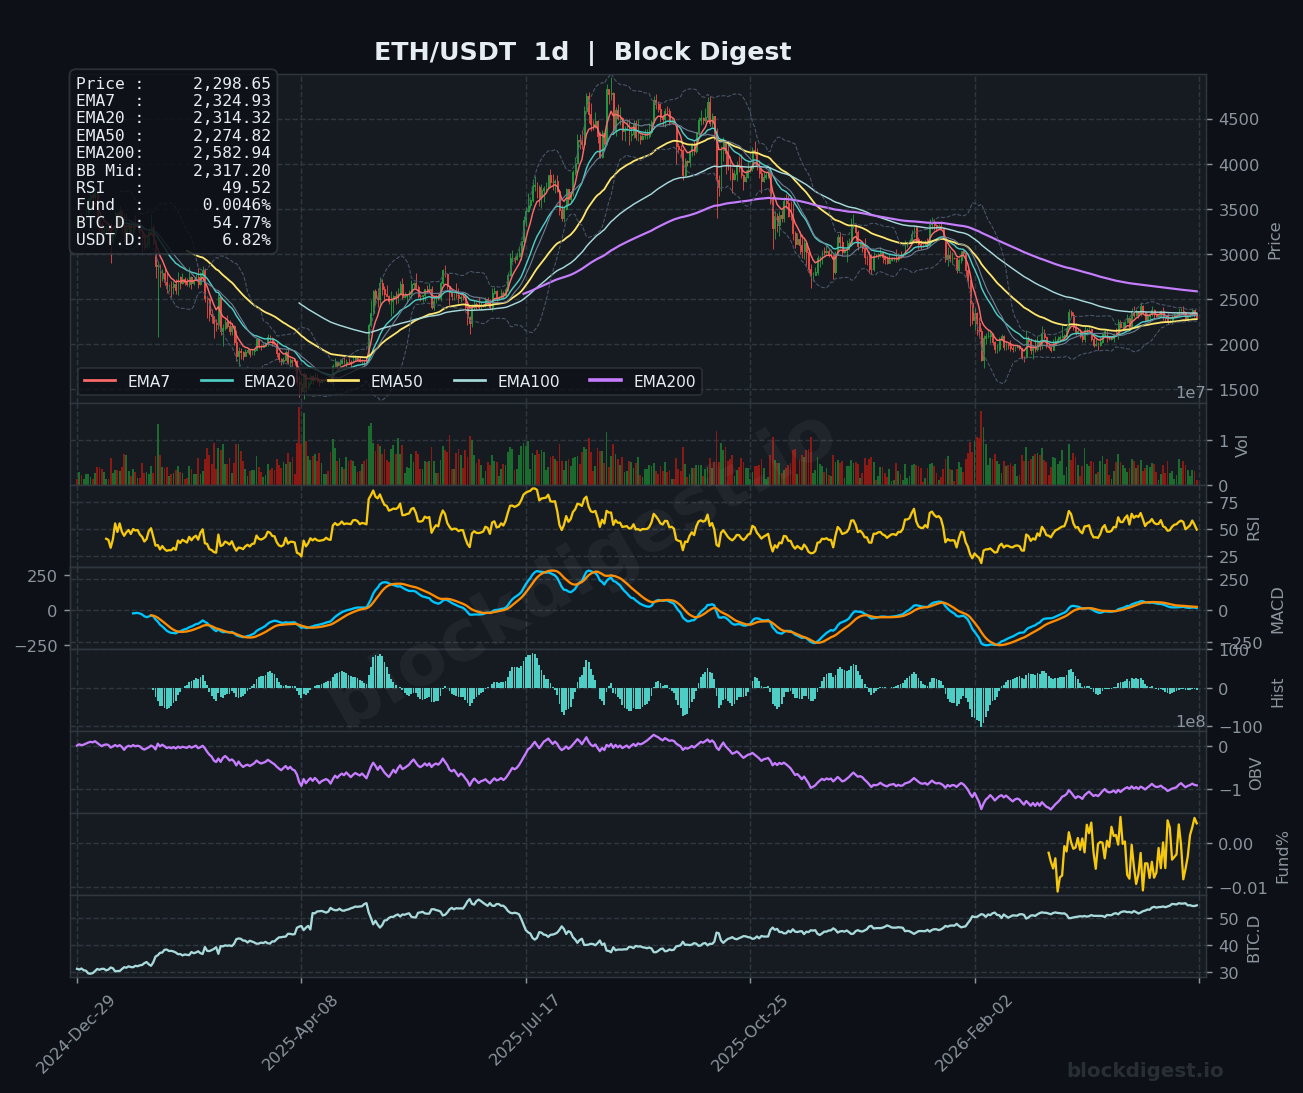
Ethereum is trading at $2,298.65, showing notable weakness after failing to sustain above the $2,400 level in recent sessions. Price is currently threading between the EMA20 ($2,320.77 on 1h, $2,327.23 on 4h) and EMA50 ($2,326.50 on 1h, $2,326.45 on 4h), indicating short-term consolidation within a tight range. On the daily timeframe, ETH remains below all major EMAs with price sitting beneath the EMA7 ($2,324.93), suggesting continued bearish pressure despite broader market optimism around Bitcoin’s move above $82,000. The Bollinger Band middle line at $2,323.79 (1h) and $2,329.06 (4h) represents immediate resistance, while the daily chart shows price attempting to find support after a prolonged downtrend.
Multi-Timeframe Confluence
The three timeframes present a mixed picture with critical divergence between short-term and long-term structure. The 1-hour chart shows price below the EMA7-20-50 cluster around $2,309-$2,326, signaling local distribution, while the 4-hour timeframe displays a similar bearish EMA stack with price trading beneath the EMA20 ($2,327.23). However, the daily timeframe reveals the more concerning structure: ETH remains decisively below all major moving averages, including the EMA200 at $2,582.94, confirming the broader downtrend remains intact. The confluence zone between $2,320-$2,330 appears across all three timeframes as critical resistance, representing the intersection of multiple EMAs and recent consolidation highs—a break above this zone would be necessary to shift near-term sentiment.
Key Levels to Watch
Resistance:
- $2,326-$2,330: Immediate resistance cluster containing EMA50 (1h/4h), EMA20 (4h), and Bollinger Band midlines across timeframes—rejection here would confirm continued distribution
- $2,369-$2,400: Major resistance zone aligning with recent swing highs and the opening price mentioned in market context; reclaiming this level would signal genuine bullish momentum
- $2,450-$2,500: Upper Bollinger Band resistance on daily and 4h charts, representing the gateway to challenging the EMA200 at $2,582.94
Support:
- $2,280-$2,290: Immediate support representing recent consolidation lows and lower Bollinger Band on the 1h timeframe; holding this level is critical for bulls
- $2,250-$2,260: Secondary support coinciding with prior bounce zone visible on the 4h chart and psychological round number
- $2,180-$2,200: Major support area marking the recent swing low on the daily chart; loss of this level would expose deeper retracement toward $2,100
Momentum & On-Chain Signals
RSI readings present a neutral-to-bearish picture across timeframes, with the 1h RSI at 33.30 showing oversold conditions that could prompt a technical bounce, while the 4h RSI at 40.05 and daily RSI at 49.52 remain in neutral territory without clear directional conviction. The MACD on the 1h and 4h charts shows bearish crossovers with histograms declining, indicating weakening momentum, though the daily MACD histogram shows signs of compression that could precede a directional move. OBV trends reveal concerning divergence—the indicator has been declining on the daily timeframe even as price attempts to stabilize, suggesting institutional distribution rather than accumulation. Funding rates near -0.0001% (essentially neutral) indicate balanced positioning without extreme leverage bias, though the lack of positive funding despite Bitcoin’s strength suggests limited conviction in ETH longs at current levels.
BTC Dominance & Market Sentiment
Bitcoin Dominance at 54.77% has been rising steadily, creating significant headwinds for Ethereum and altcoins despite the broader crypto market rally mentioned in the news context. This elevated BTC.D reading explains ETH’s underperformance relative to Bitcoin’s surge toward $82,000—capital is flowing into BTC rather than rotating into alts. USDT Dominance at 6.82% remains relatively stable, suggesting moderate stablecoin reserves sitting on exchanges, which could provide buying power if sentiment shifts, but the current allocation favors Bitcoin accumulation. The divergence between Bitcoin’s strength and Ethereum’s consolidation indicates risk-off behavior within crypto, where investors prefer the relative safety of BTC over higher-beta assets like ETH.
Risk Scenarios
Bullish case: A decisive reclaim of the $2,326-$2,330 resistance cluster with accompanying volume expansion would signal short-term reversal potential, targeting the $2,369 opening level mentioned in market context and potentially $2,400-$2,450 if momentum sustains. This scenario gains credibility if Bitcoin maintains support above $81,000 and BTC Dominance begins declining, allowing capital rotation into ETH, while RSI rebounds above 50 on the 4h chart and OBV shows accumulation patterns.
Bearish case: Failure to reclaim EMA resistance and a breakdown below $2,280 support would likely trigger accelerated selling toward $2,250 and potentially $2,200, particularly if Bitcoin corrects from current levels or BTC Dominance continues expanding. A daily close beneath $2,250 with increasing OBV distribution would expose the $2,180-$2,200 major support zone, with further downside risk toward $2,100 if macro sentiment deteriorates.
Outlook
Ethereum faces a critical juncture at current levels, caught between oversold 1h conditions and unresolved daily timeframe weakness. The inability to participate in Bitcoin’s rally toward $82,000 highlights underlying fragility, with the $2,320-$2,330 resistance zone serving as the immediate battleground. Traders should monitor whether ETH can reclaim and hold above the EMA cluster in the next 24-48 hours—failure to do so on diminishing volume would favor continued downside pressure. The key trigger to watch is BTC Dominance behavior: any decline from current 54.77% levels could catalyze capital rotation into ETH, but until that occurs, the path of least resistance remains sideways-to-down. Risk management remains paramount given the bearish daily structure, with $2,280 serving as the critical support level that separates consolidation from potential breakdown.
Disclaimer: This analysis is for informational purposes only and does not constitute financial advice. Cryptocurrency markets are highly volatile and unpredictable. All trading decisions should be made based on your own research and risk tolerance. Block Digest is not responsible for any financial losses incurred as a result of acting on this content.