
Market Overview
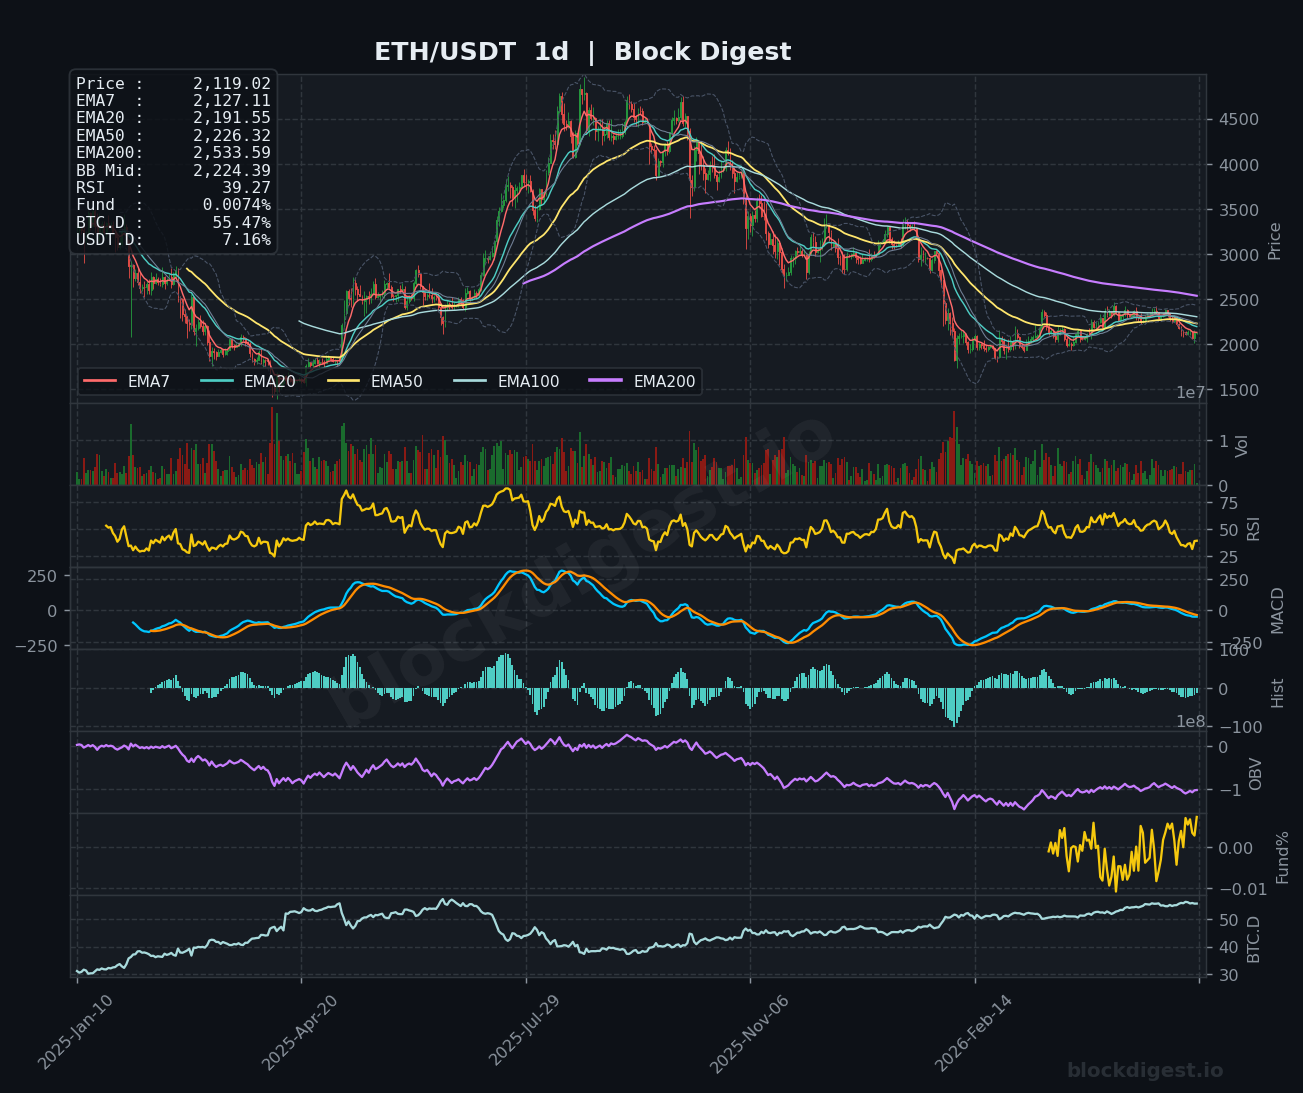
ETH/USDT is currently trading at $2,119.27, caught in a structurally weak position on the daily timeframe following a prolonged decline from highs above $4,000. Price sits below all major daily EMAs — the EMA20 at $2,191.55, EMA50 at $2,226.32, and the EMA200 at $2,533.59 — confirming a bearish macro structure. The daily Bollinger Band midline at $2,224.39 is acting as dynamic overhead resistance, with price hugging the lower band region. The dominant daily trend remains decisively bearish, and any recovery attempts have so far been shallow and quickly reversed.
Multi-Timeframe Confluence
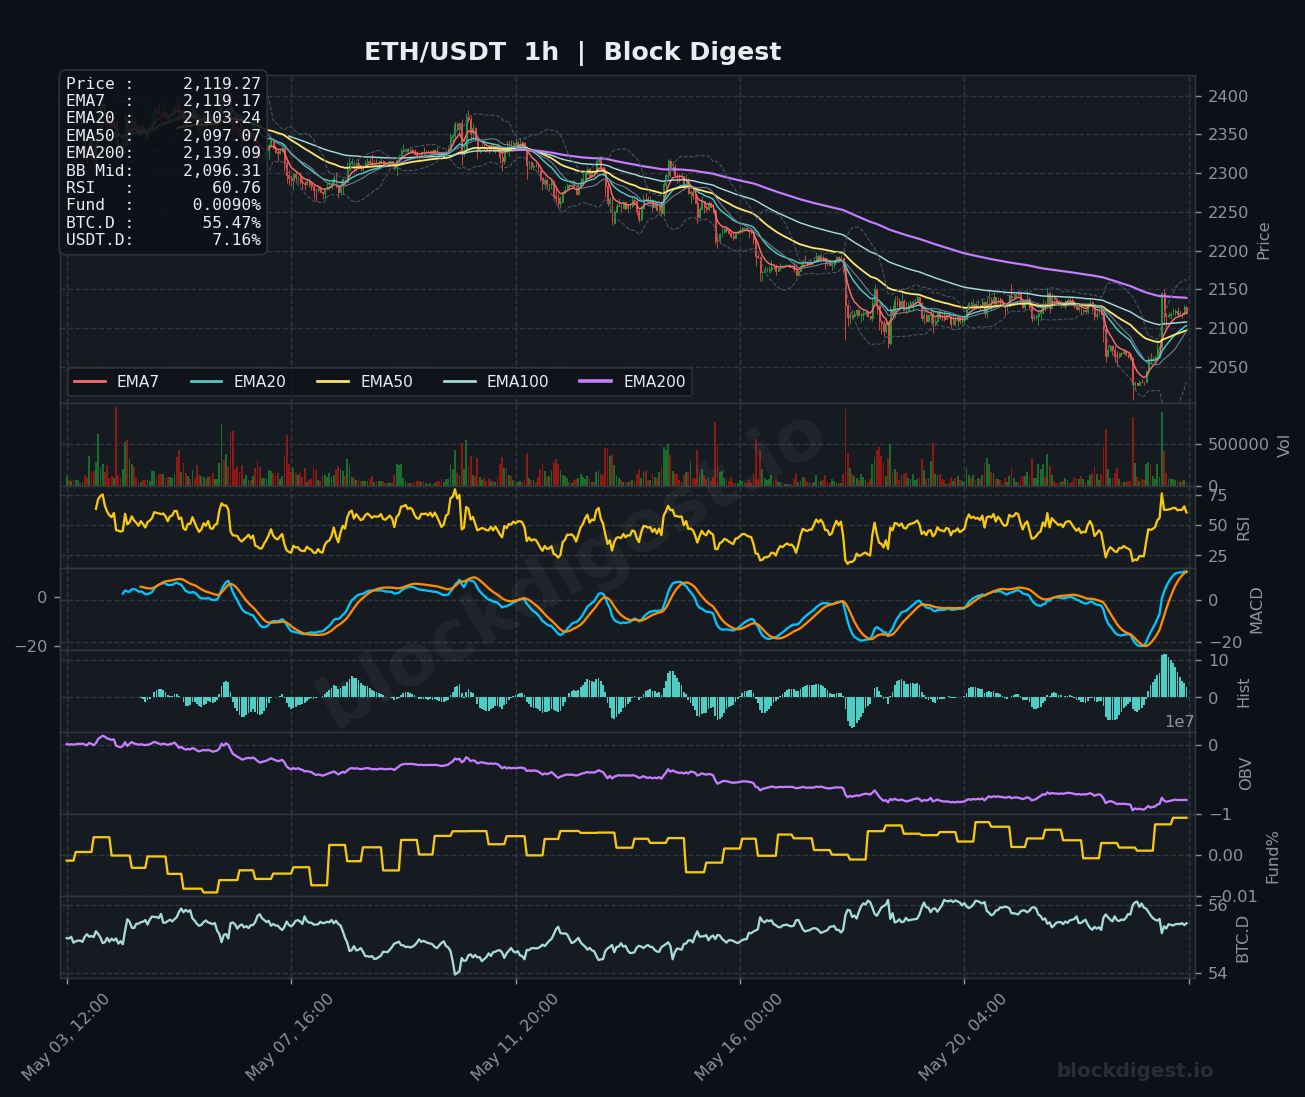
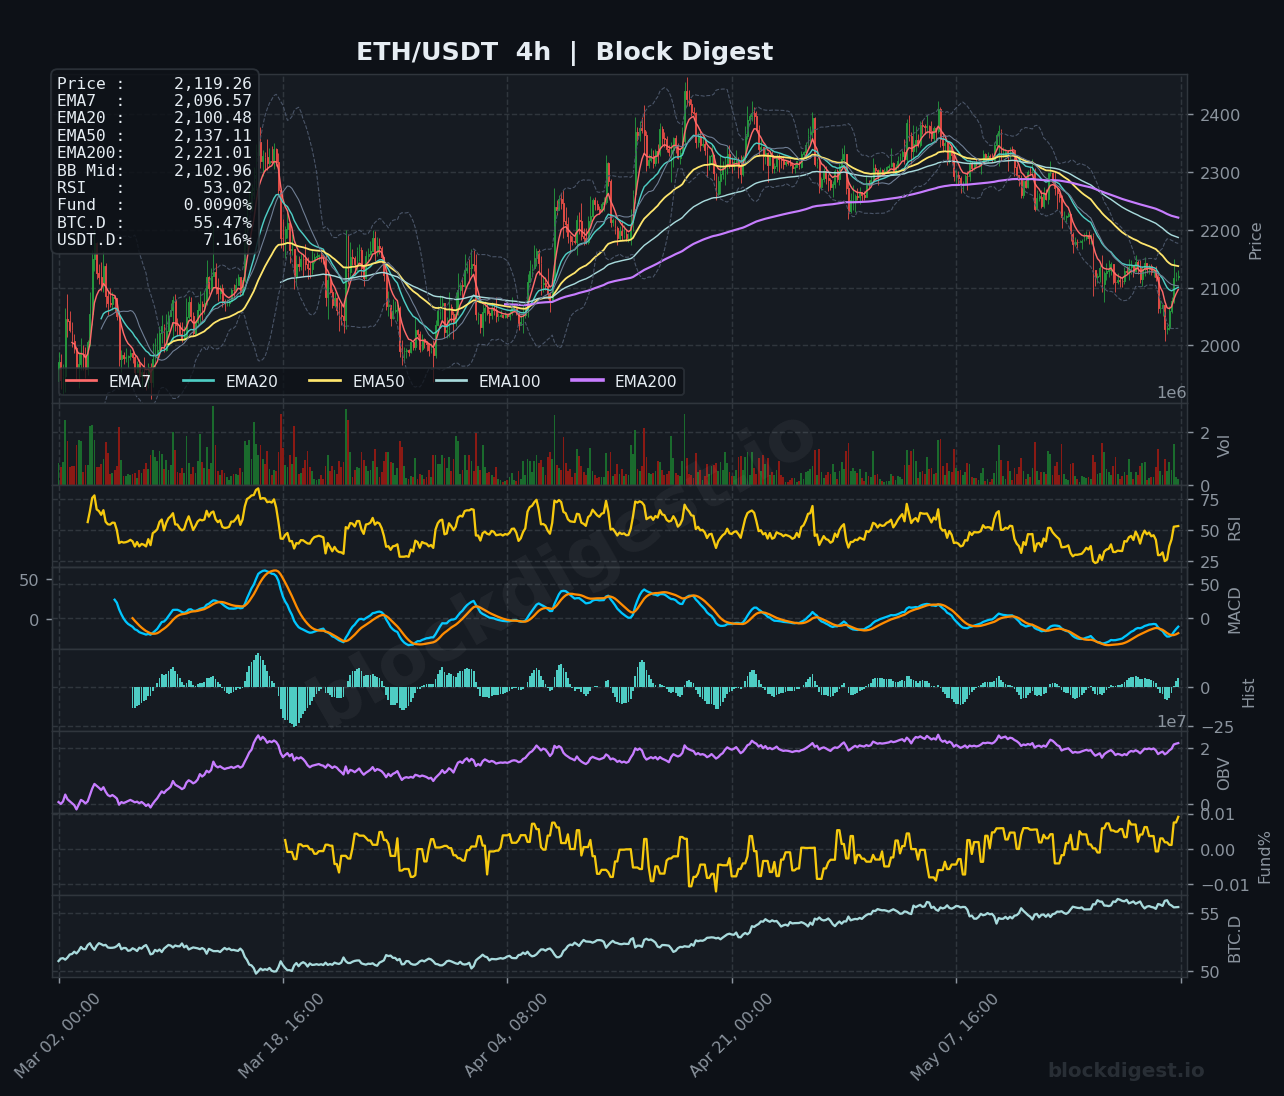
On the 1-hour chart, ETH has staged a short-term bounce from lows near $2,050, with the EMA7 ($2,119.17) and EMA20 ($2,103.24) now curling upward — a tentative sign of near-term stabilization. The 4-hour chart shows price reclaiming the EMA7 ($2,096.57) and EMA20 ($2,100.48) from below, but the EMA50 at $2,137.11 and EMA200 at $2,221.01 remain firmly overhead as formidable resistance clusters. All three timeframes converge on the $2,100–$2,140 zone as a critical decision area, where the short-term bounce narrative will be tested against the dominant higher-timeframe downtrend.
Key Levels to Watch
- Resistance: $2,140 — 4H EMA50 confluence and recent intraday supply zone where sellers have repeatedly capped recovery attempts
- Resistance: $2,191–$2,225 — Daily EMA20 and BB midline cluster; a major structural barrier that has not been reclaimed since the broader decline accelerated
- Resistance: $2,300 — Psychological round number and former support-turned-resistance aligning with the 4H EMA200 at $2,221, forming a dense supply ceiling
- Support: $2,096–$2,100 — 1H EMA50 ($2,097.07) and 4H EMA20 ($2,100.48) now acting as near-term floor; a loss of this level would negate the current bounce
- Support: $2,050 — Recent swing low and lower Bollinger Band region on the 1-hour chart; first major demand test on any renewed selling
- Support: $1,950–$2,000 — Psychological and structural support zone visible on the daily chart; a breach here would signal significant trend deterioration
Momentum & On-Chain Signals
The 1-hour RSI at 60.76 reflects the current short-term bounce momentum but is approaching a zone where previous recoveries have stalled, warranting caution. The 4-hour RSI at 53.02 is neutral and sitting at the mid-line, offering no directional conviction, while the daily RSI at 39.27 remains in bearish territory and has not yet shown a meaningful upturn. The 1-hour MACD has produced a sharp bullish crossover with the histogram expanding positively — encouraging in isolation — but the 4-hour MACD lines remain flat and marginally negative, suggesting the bounce lacks higher-timeframe confirmation. The OBV on the daily chart continues its downward trajectory, indicating persistent distribution pressure that undermines the reliability of near-term price recovery attempts.
BTC Dominance & Market Sentiment
BTC dominance sits at 55.47%, reflecting a market environment where capital continues to favor Bitcoin over altcoins, a headwind for ETH outperformance in the near term. USDT dominance at 7.16% suggests that a meaningful portion of market participants remain in cash or stablecoins, indicating risk-off positioning has not fully reversed. For ETH specifically, sustained recovery would likely require a visible decline in BTC.D — a rotation that has not yet materialized on the charts.
Risk Scenarios
- Bullish case: A confirmed 4-hour candle close above $2,140 (4H EMA50), followed by a sustained hold above $2,100, would open a path toward the $2,191–$2,225 resistance band; reclaiming this zone could catalyze a broader relief rally targeting $2,300.
- Bearish case: Failure to hold the $2,096–$2,100 support cluster on any pullback would signal the bounce is exhausted, with a retest of $2,050 and potentially the $1,950–$2,000 structural support zone as the logical downside targets.
Outlook
The near-term bias leans cautiously neutral-to-bullish off the recent $2,050 lows, but this remains a counter-trend bounce within a clearly established daily downtrend. The critical trigger in the next 24–48 hours is whether ETH can sustain price action above $2,100 and break through the $2,137–$2,140 resistance zone with meaningful volume. A failure to do so would reinforce the bearish macro structure and increase the probability of a deeper drawdown toward $1,950. Until ETH reclaims the daily EMA20 at $2,191 on a closing basis, any bullish thesis should be treated as speculative, and risk management remains paramount.
Disclaimer: This analysis is for informational purposes only and does not constitute financial advice. Cryptocurrency markets are highly volatile and unpredictable. All trading decisions should be made based on your own research and risk tolerance. Block Digest is not responsible for any financial losses incurred as a result of acting on this content.
Stay Ahead of the Market
Follow BlockDigest for crypto market intelligence, research and real-time updates.


