
Market Overview
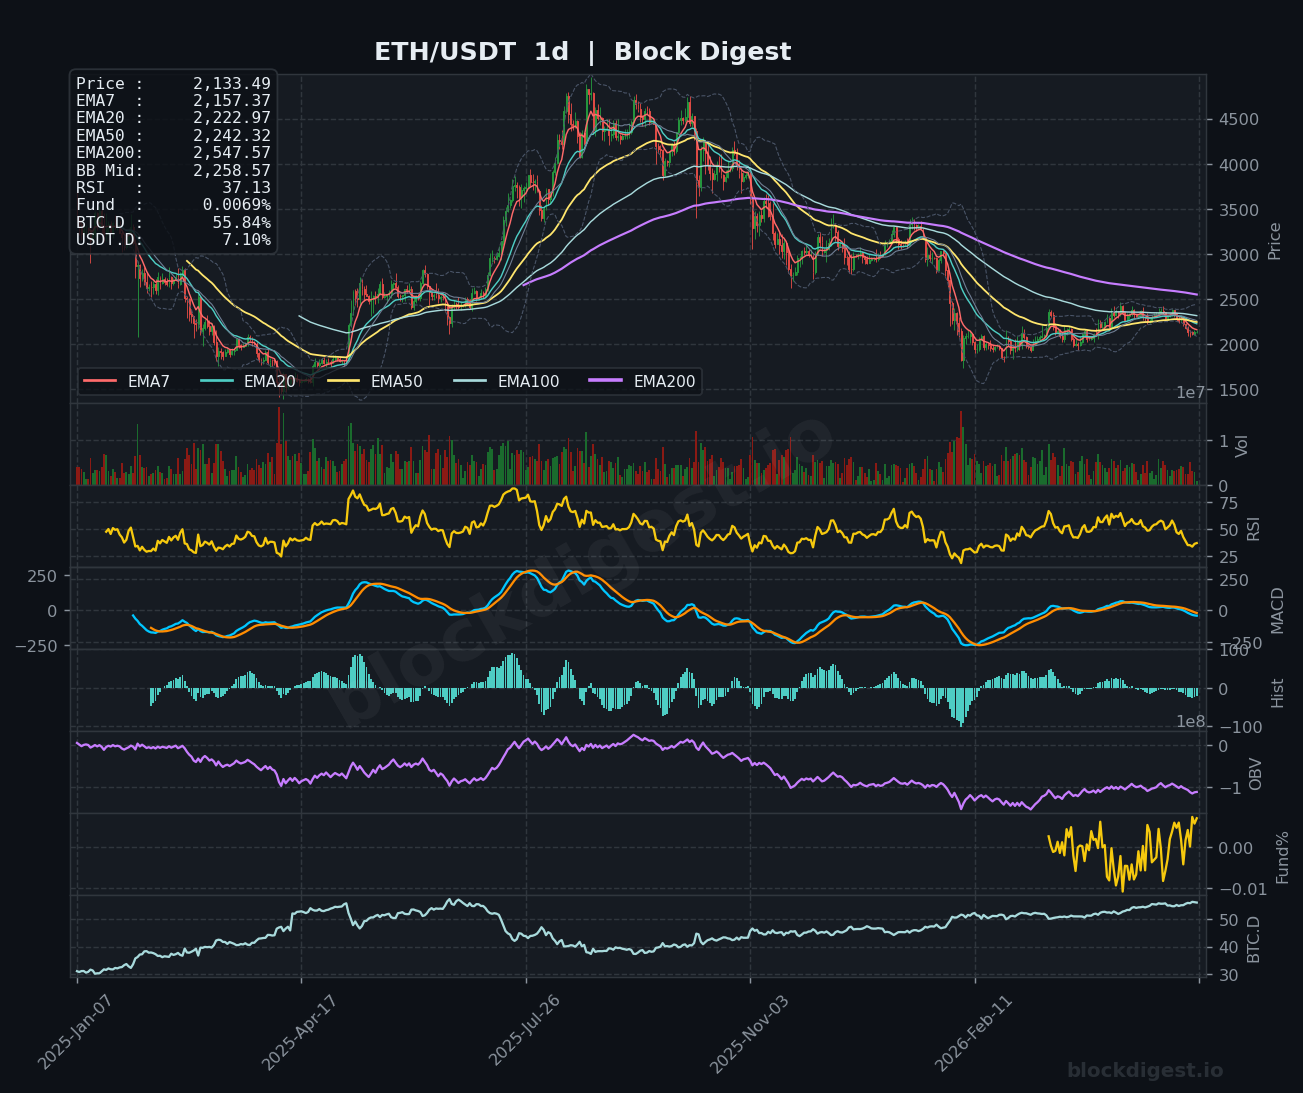
ETH/USDT is currently trading at $2,133.49, sitting in a structurally weak position on the daily timeframe after a sustained decline from highs above $4,000 recorded mid-2025. Price is trading well below all major daily EMAs — EMA7 at $2,157.37, EMA20 at $2,222.97, EMA50 at $2,242.32, and the EMA200 at $2,547.57 — confirming that bears maintain firm control at every meaningful moving average. The daily Bollinger Band midline sits at $2,258.57, with price pinned to the lower band region, reflecting persistent selling pressure. The dominant daily trend remains bearish, with no confirmed structural reversal in place.
Multi-Timeframe Confluence
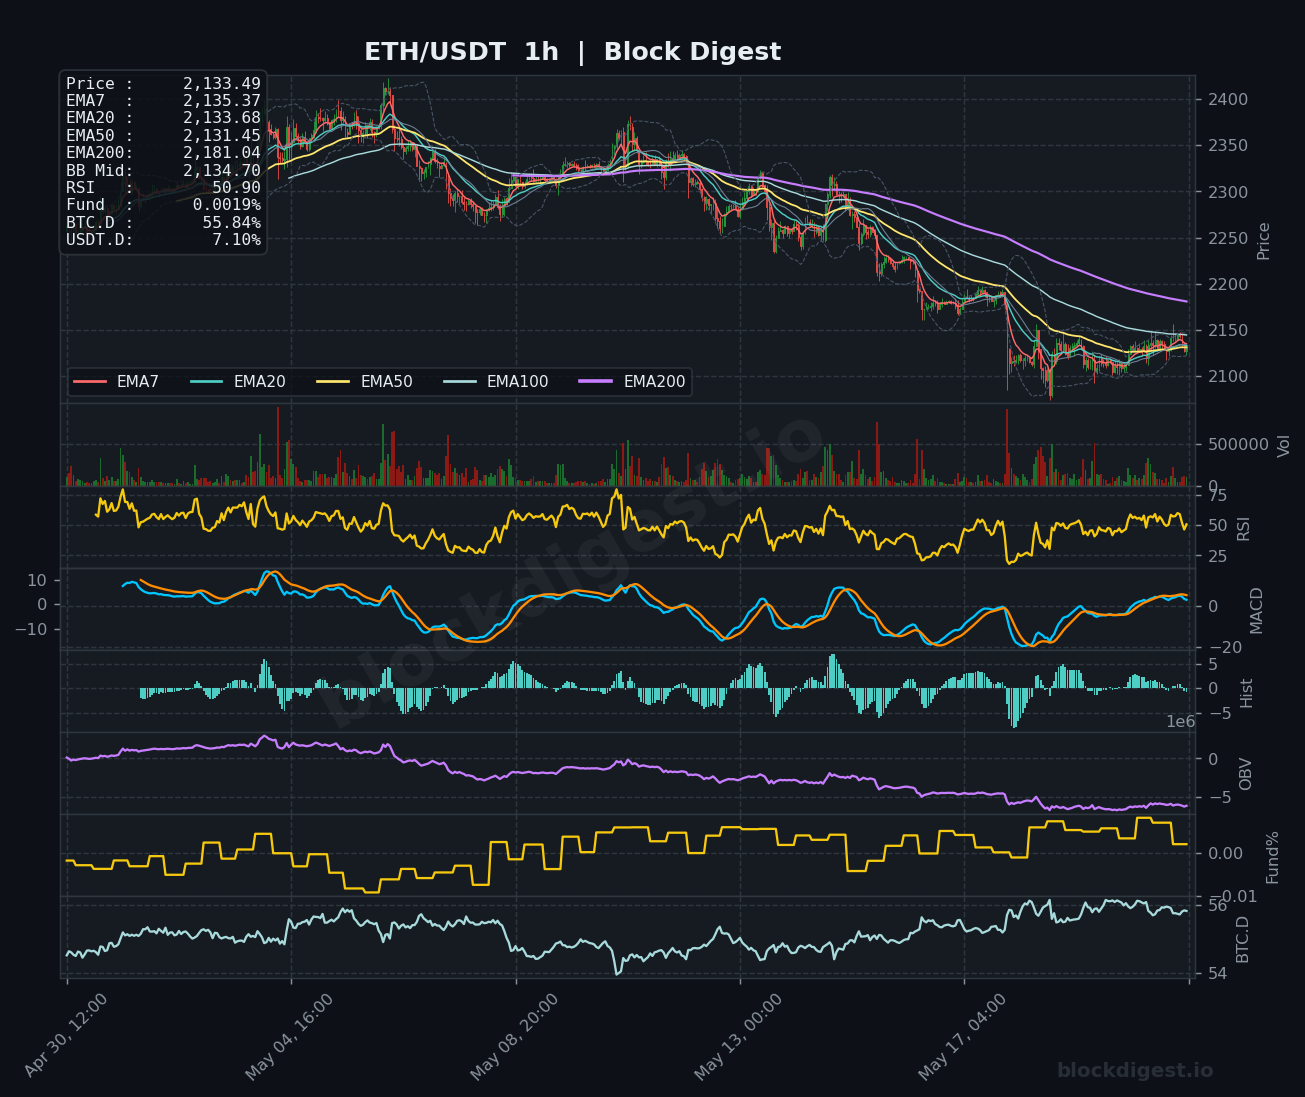
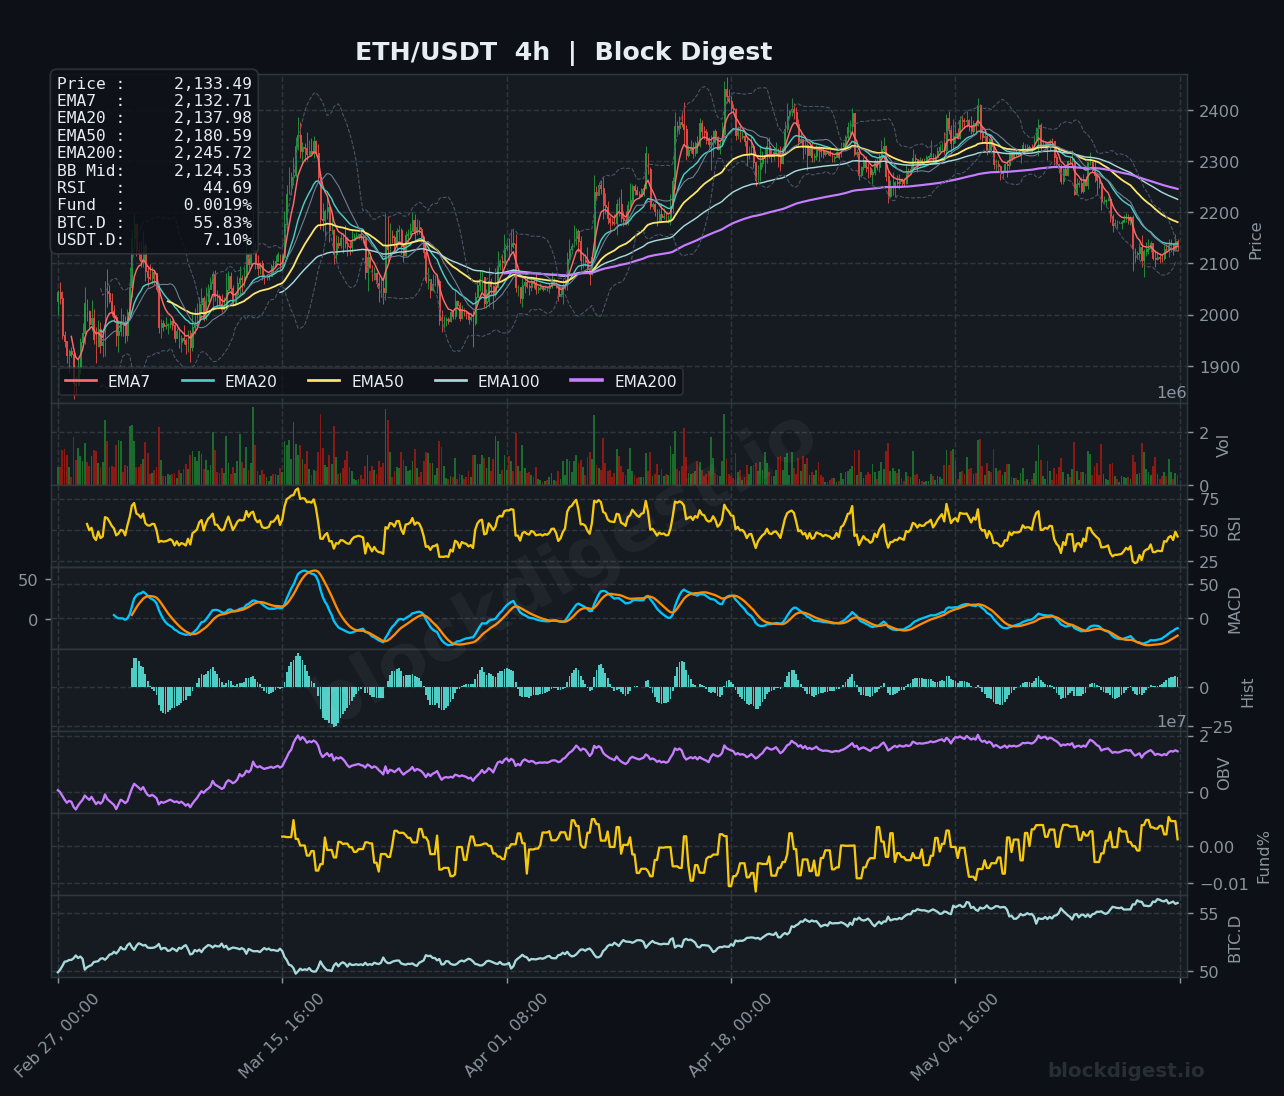
On the 1-hour chart, price has staged a short-term recovery attempt, with the EMA7 ($2,135.37), EMA20 ($2,133.68), and EMA50 ($2,131.45) tightly clustered around current price — a sign of short-term consolidation rather than directional conviction. The 4-hour chart tells a more cautionary story: price remains below the EMA50 ($2,180.59) and EMA200 ($2,245.72), with the structure pointing to a failed recovery following a sharp drop from the $2,300–$2,400 range. Across all three timeframes, the EMA200 acts as a layered ceiling, with each higher timeframe adding more weight to overhead resistance. Short-term momentum on the 1-hour is attempting to stabilize, but it directly contradicts the bearish bias established on the 4-hour and daily charts.
Key Levels to Watch
- Resistance: $2,180 — the 4h EMA50, which capped recent recovery attempts and aligns with prior intraday swing highs
- Resistance: $2,222–$2,245 — a dense cluster combining the daily EMA20, EMA50, and the 4h EMA200, representing the most significant overhead supply zone
- Resistance: $2,300 — psychological round number and previous consolidation base that broke down, now acting as structural resistance
- Support: $2,100 — the nearest psychological floor and recent intraday low region; a clean break below here opens downside
- Support: $2,050 — secondary support from prior price congestion; loss of this level would accelerate selling
- Support: $1,950–$2,000 — major psychological and structural support zone; represents a critical long-term demand area visible on the daily chart
Momentum & On-Chain Signals
The daily RSI at 37.13 is approaching oversold territory but has not yet reached the 30 threshold, suggesting there may be additional downside before a meaningful bounce materializes. On the 4-hour chart, RSI sits at 44.69 — below the neutral 50 line — indicating that intermediate-term momentum remains bearish, while the 1-hour RSI at 50.90 reflects the current consolidation indecision. The 4-hour MACD lines are both negative and running closely together near zero, with a marginally positive histogram suggesting a weak bullish crossover attempt, though this lacks conviction given broader context. OBV on the 1-hour chart is trending downward, indicating net distribution pressure, while the daily OBV continues its multi-month decline — a consistent signal that volume is not supporting any recovery thesis. Funding rate stands at a near-neutral 0.0019%, suggesting the market is not aggressively positioned in either direction at this juncture.
BTC Dominance & Market Sentiment
BTC dominance (BTC.D) is elevated at 55.84%, reflecting a continued flight to relative safety within the crypto ecosystem and a clear preference for Bitcoin over altcoins including ETH. USDT.D at 7.10% suggests that a meaningful portion of capital remains on the sidelines in stablecoins, which could either fuel a recovery if deployed or signal sustained caution. For ETH specifically, the elevated BTC.D environment is a headwind — historically, altcoins including ETH underperform when dominance remains above 55%, and a sustained reversal in BTC.D would be a prerequisite for any durable ETH rally.
Risk Scenarios
- Bullish case: A decisive hourly close above $2,180 followed by a 4-hour confirmation above the EMA50 would signal short-term momentum shifting; continuation through $2,222–$2,245 could open a move toward $2,300 and potentially retest the $2,350 zone.
- Bearish case: Failure to hold $2,100 on a closing basis would confirm the consolidation as distribution, with the next meaningful downside targets at $2,050 and the critical $1,950–$2,000 zone.
Outlook
The directional bias for ETH remains cautiously bearish heading into May 21–22, given the overwhelming overhead resistance structure across daily and 4-hour timeframes and a daily RSI that hasn’t yet reached oversold extremes. The key trigger to watch in the next 24–48 hours is whether price can reclaim and hold the $2,180 level on the 4-hour chart — without that, every bounce is likely to be sold. A deterioration in BTC price action or a spike in BTC.D above 56% would compound selling pressure on ETH. Conversely, a stabilization in BTC.D combined with improving 4-hour MACD momentum could set up a relief rally, but the macro structure on the daily chart warrants continued caution until price reclaims at minimum the $2,222–$2,245 supply cluster.
Disclaimer: This analysis is for informational purposes only and does not constitute financial advice. Cryptocurrency markets are highly volatile and unpredictable. All trading decisions should be made based on your own research and risk tolerance. Block Digest is not responsible for any financial losses incurred as a result of acting on this content.
Stay Ahead of the Market
Follow BlockDigest for crypto market intelligence, research and real-time updates.


