
market outlook
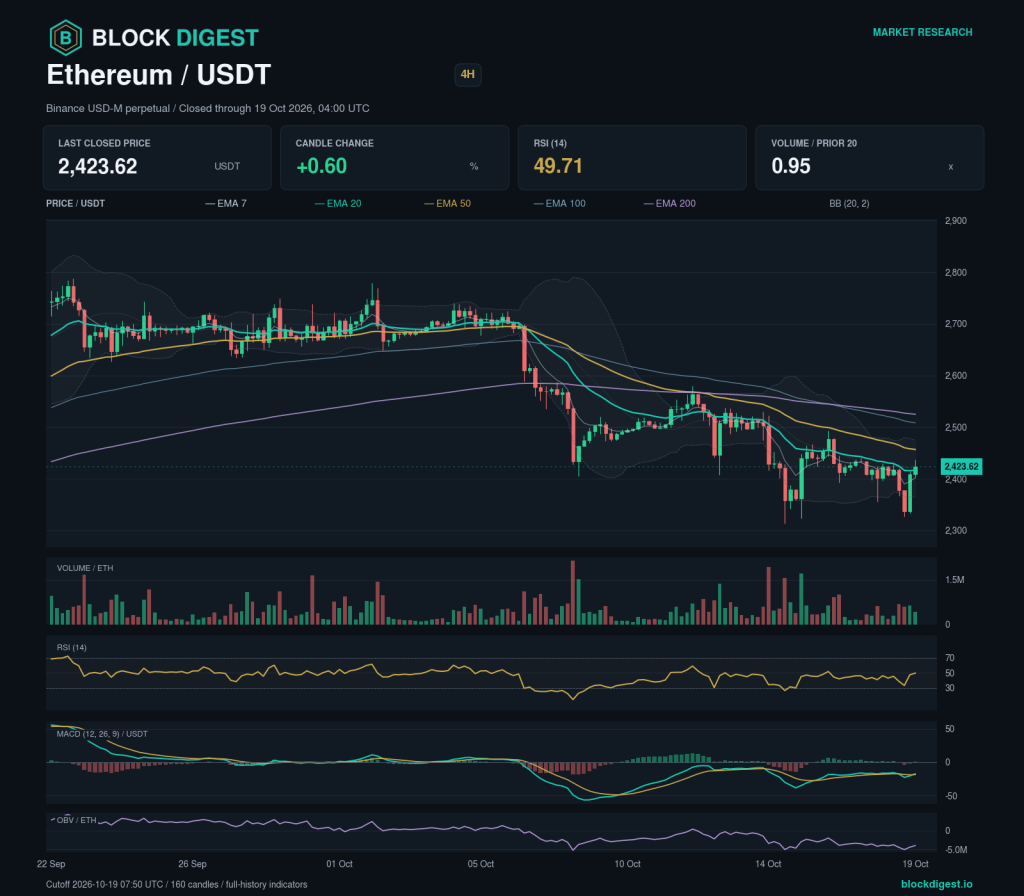
Ethereum Weekly: Daily and Weekly Structures Diverge
Weekly Market Overview Ethereum’s daily chart still shows lower confirmed highs and lows, even as weekly swings point higher. That disagreement limits conviction in the daily trend. Ethereum’s latest completed four-hour candle closed at 2,423.62 USDT, for the period ending 2026-10-19 04:00 UTC. The last daily close rose 0.31% from the previous close. The next...
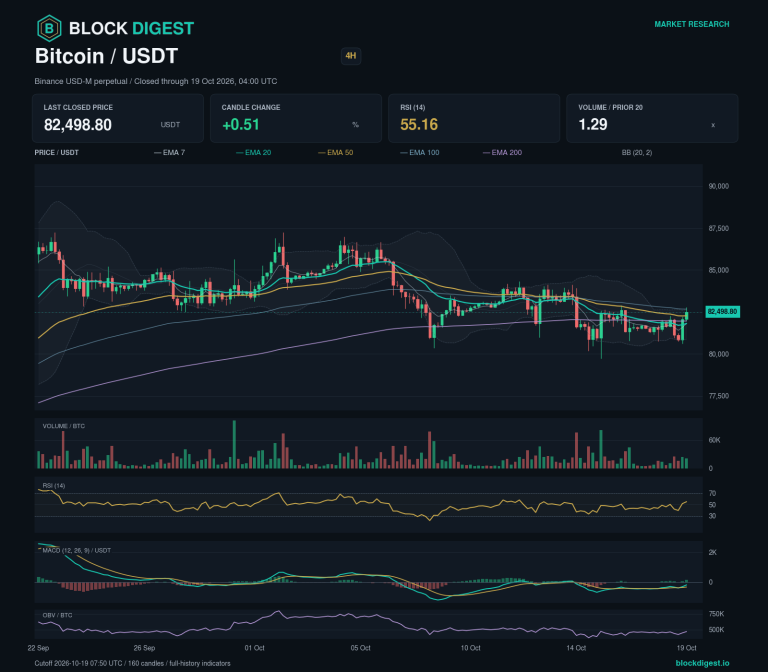
Bitcoin Weekly: Daily and Weekly Structures Diverge
Weekly Market Overview Bitcoin’s daily chart still shows lower confirmed highs and lows, even as weekly swings point higher. That disagreement limits conviction in the daily trend. Bitcoin’s latest completed four-hour candle closed at 82,498.80 USDT, for the period ending 2026-10-19 04:00 UTC. The last daily close rose 0.76% from the previous close. The next...
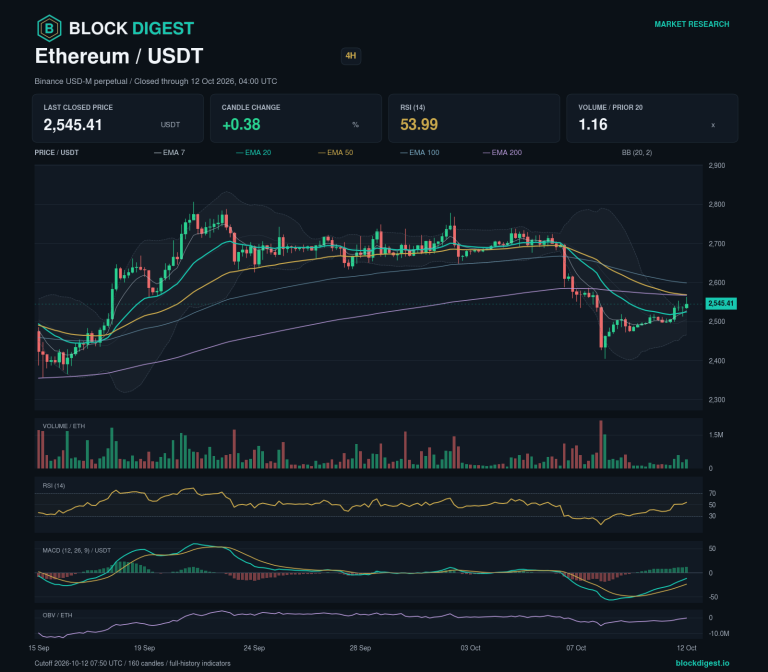
Ethereum Weekly: Key Levels Frame an Unsettled Structure
Weekly Market Overview Ethereum’s daily swing sequence offers no clear directional thesis. That puts the emphasis on the relevant support and resistance zones rather than a forecast of the next move. Ethereum’s latest completed four-hour candle closed at 2,545.41 USDT, for the period ending 2026-10-12 04:00 UTC. The last daily close rose 1.23% from the...
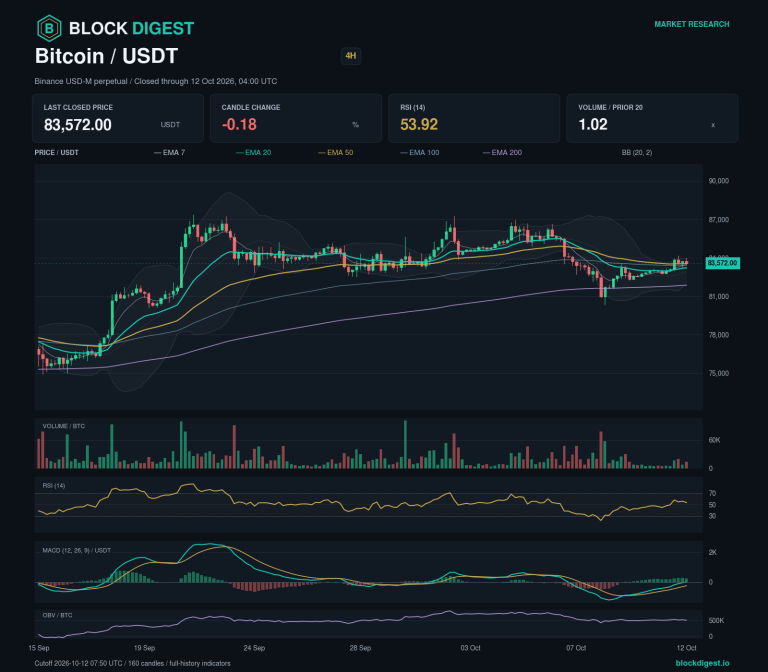
Bitcoin Weekly: Daily and Weekly Structures Diverge
Weekly Market Overview Bitcoin’s daily and weekly charts are giving different signals. With those signals in disagreement, the next structural confirmation matters more than a single directional headline. Bitcoin’s latest completed four-hour candle closed at 83,572.00 USDT, for the period ending 2026-10-12 04:00 UTC. The last daily close rose 0.94% from the previous close. BlockDigest’s...
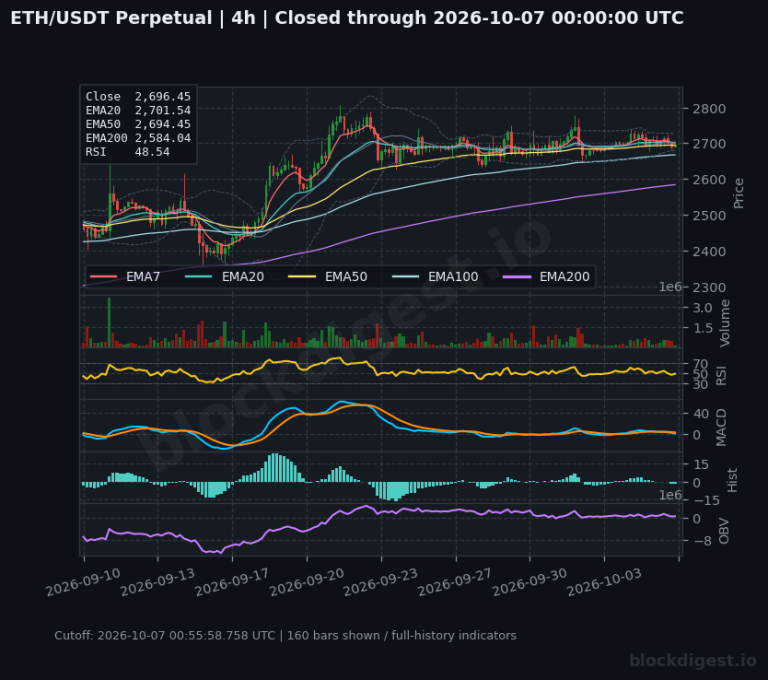
Ethereum Weekly: Higher Swings Set the Weekly Framework
Weekly Market Overview Higher confirmed daily highs and lows underpin the weekly assessment, leaving Ethereum’s daily swing structure constructive. Ethereum’s latest completed four-hour candle closed at 2,696.45 USDT, for the period ending 2026-10-07 00:00 UTC. The last daily close fell 0.45% from the previous close. BlockDigest’s base assessment is bullish. The next upside checkpoint requires...
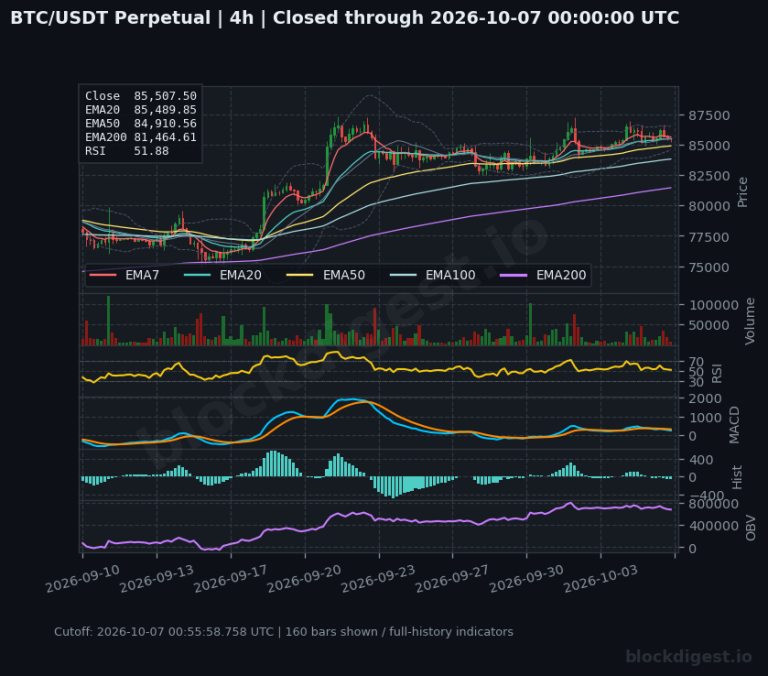
Bitcoin Weekly: Daily and Weekly Structures Diverge
Weekly Market Overview Bitcoin’s daily and weekly charts are giving different signals. With those signals in disagreement, the next structural confirmation matters more than a single directional headline. Bitcoin’s latest completed four-hour candle closed at 85,507.50 USDT, for the period ending 2026-10-07 00:00 UTC. The last daily close fell 0.24% from the previous close. BlockDigest’s...
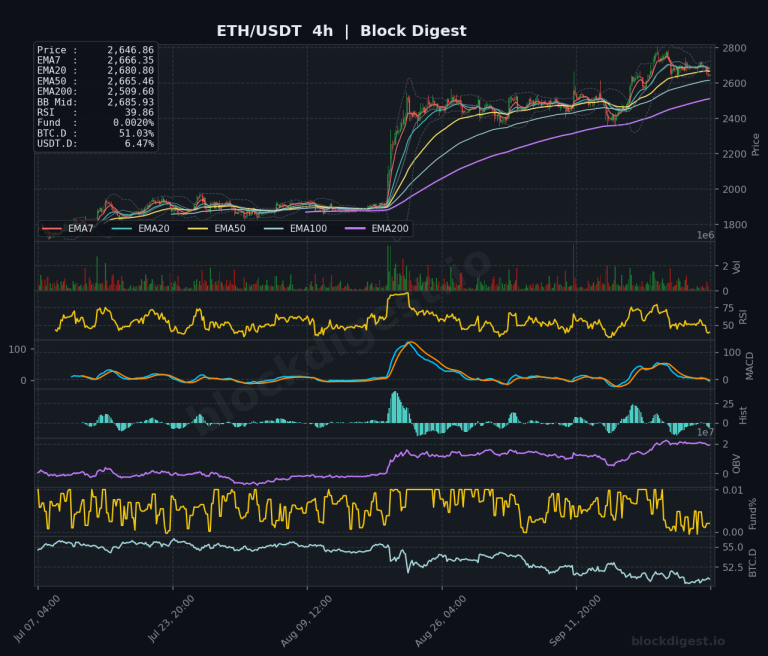
Ethereum Weekly Analysis: Ethereum consolidation near 2646 with bullish trend
Weekly Market Overview Ethereum is consolidating near multi-month highs, trading at 2646.86 after a powerful breakout from the 2000–2200 base. The weekly candle shows tight consolidation and slight upper-range compression beneath macro resistance, marking a pause after a period of aggressive expansion. The trend has shifted decisively bullish on the weekly timeframe, with the asset...
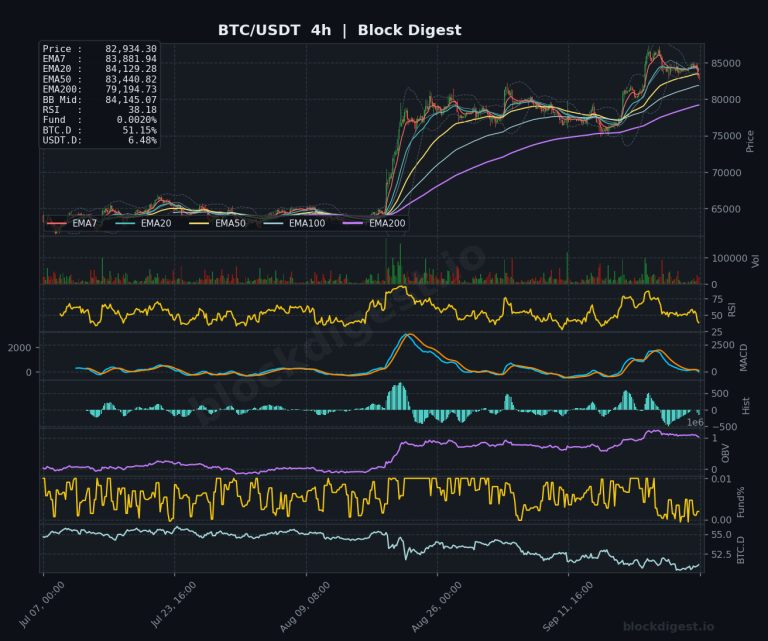
Bitcoin Weekly Analysis: BTC establishes 80,000 zone as operational base
Weekly Market Overview BTC/USDT is currently trading at 82934.3, marking a period of robust bullish expansion that has firmly established the asset above the previous multi-month consolidation range of 60,000–70,000. Price action has successfully accepted the low-to-mid 80,000 zone as a new operational base, distancing itself from earlier resistance. Market sentiment remains distinctly optimistic, with...
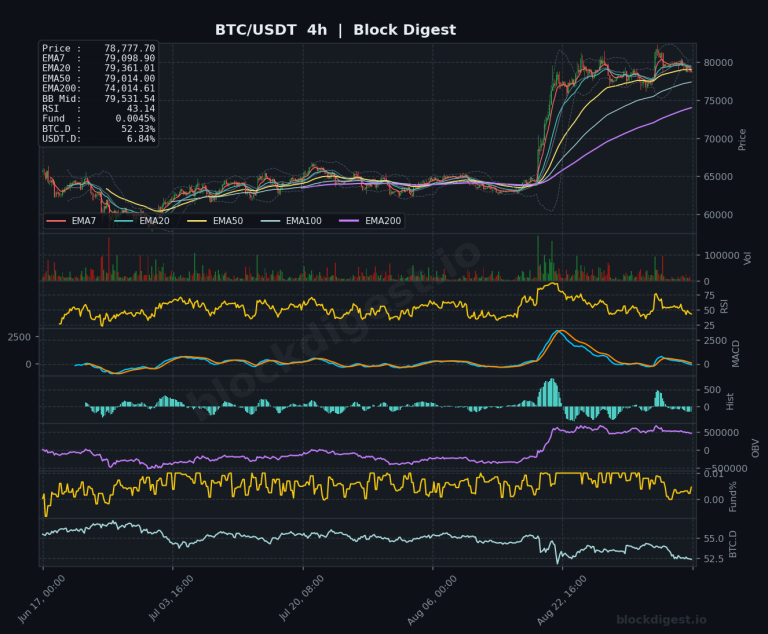
Bitcoin Weekly Analysis: BTC consolidating at $78,781 after macro recovery
Weekly Market Overview BTC/USDT is currently consolidating at $78,781.10, resting near the apex of an aggressive macro recovery following a long base accumulation between $60,000 and $70,000. The current weekly candle shows high-level compression just above critical moving average clusters, reflecting a period of digestion after the asset tested recent highs near $81,700. Structural context...
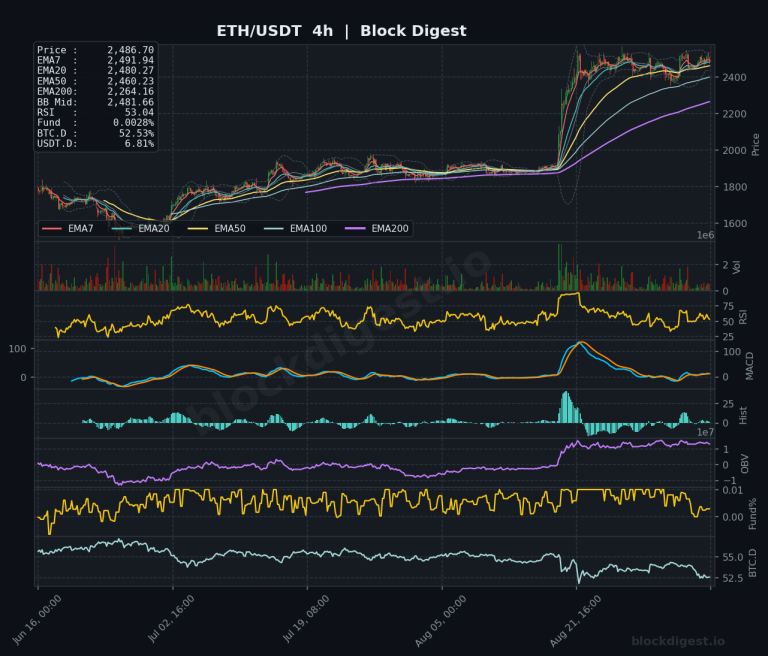
Ethereum Weekly Analysis: Ethereum Consolidates Beneath $2,485 Resistance Level
Weekly Market Overview Ethereum is consolidating directly beneath critical multi-month resistance after an aggressive vertical expansion out of the sub-$2,000 accumulation range. The current weekly candle reflects tight compression around the $2,485 mark, showing shrinking bodies and a narrower intraweek range after weeks of sustained buying. This structural pause preserves the series of higher lows...
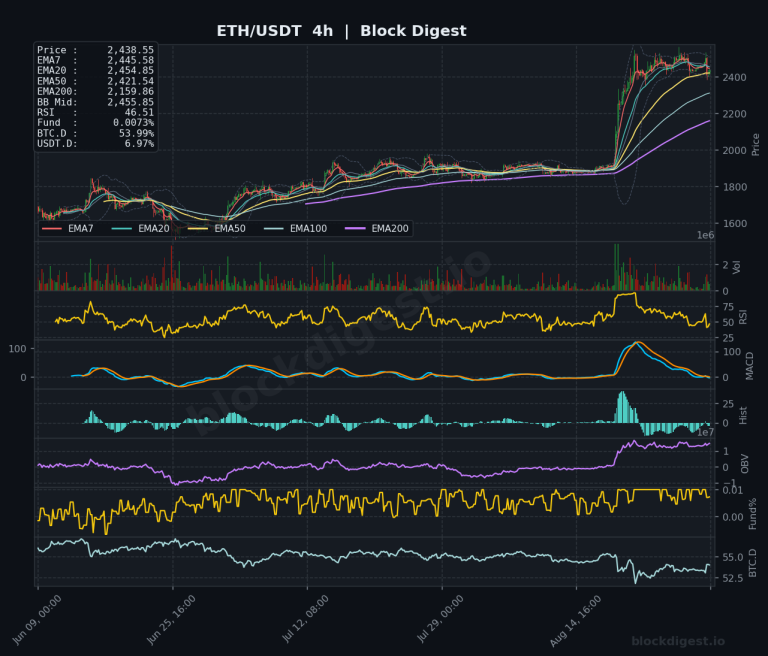
Ethereum Weekly Analysis: Reclaiming 50 EMA at $2,373
Weekly Market Overview Ethereum trades at $2,438.55 as the final weekly candle of August consolidates near multi-month highs following a powerful impulsive expansion off the summer base. The weekly structure shows aggressive absorption of overhead supply, with price reclaiming the weekly 50 EMA at $2,373.20 and pressing directly into major structural resistance. This transition shifts...
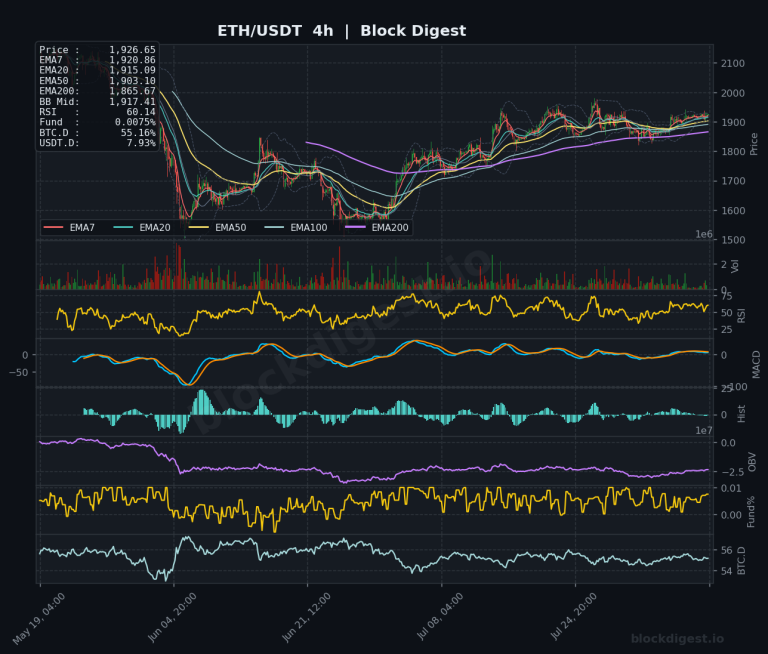
Ethereum Weekly Analysis: Ethereum Consolidates Below $2,000 Resistance Level
Weekly Market Overview Ethereum closed the week at approximately $1,926, posting a modest gain of roughly 0.33% as price action continued to consolidate within a historically significant range just below the psychologically important $2,000 level. The weekly candle structure reflects subdued directional conviction — a tight-bodied candle with contained wicks — suggesting an ongoing tug-of-war...