Ethereum Daily Analysis: ETH slides below all major moving averages at $1,678
Market Overview
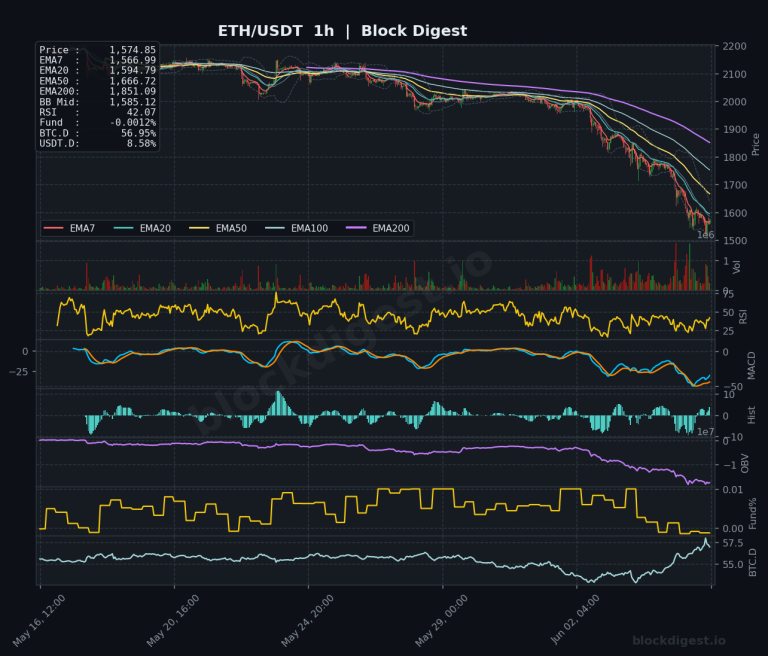
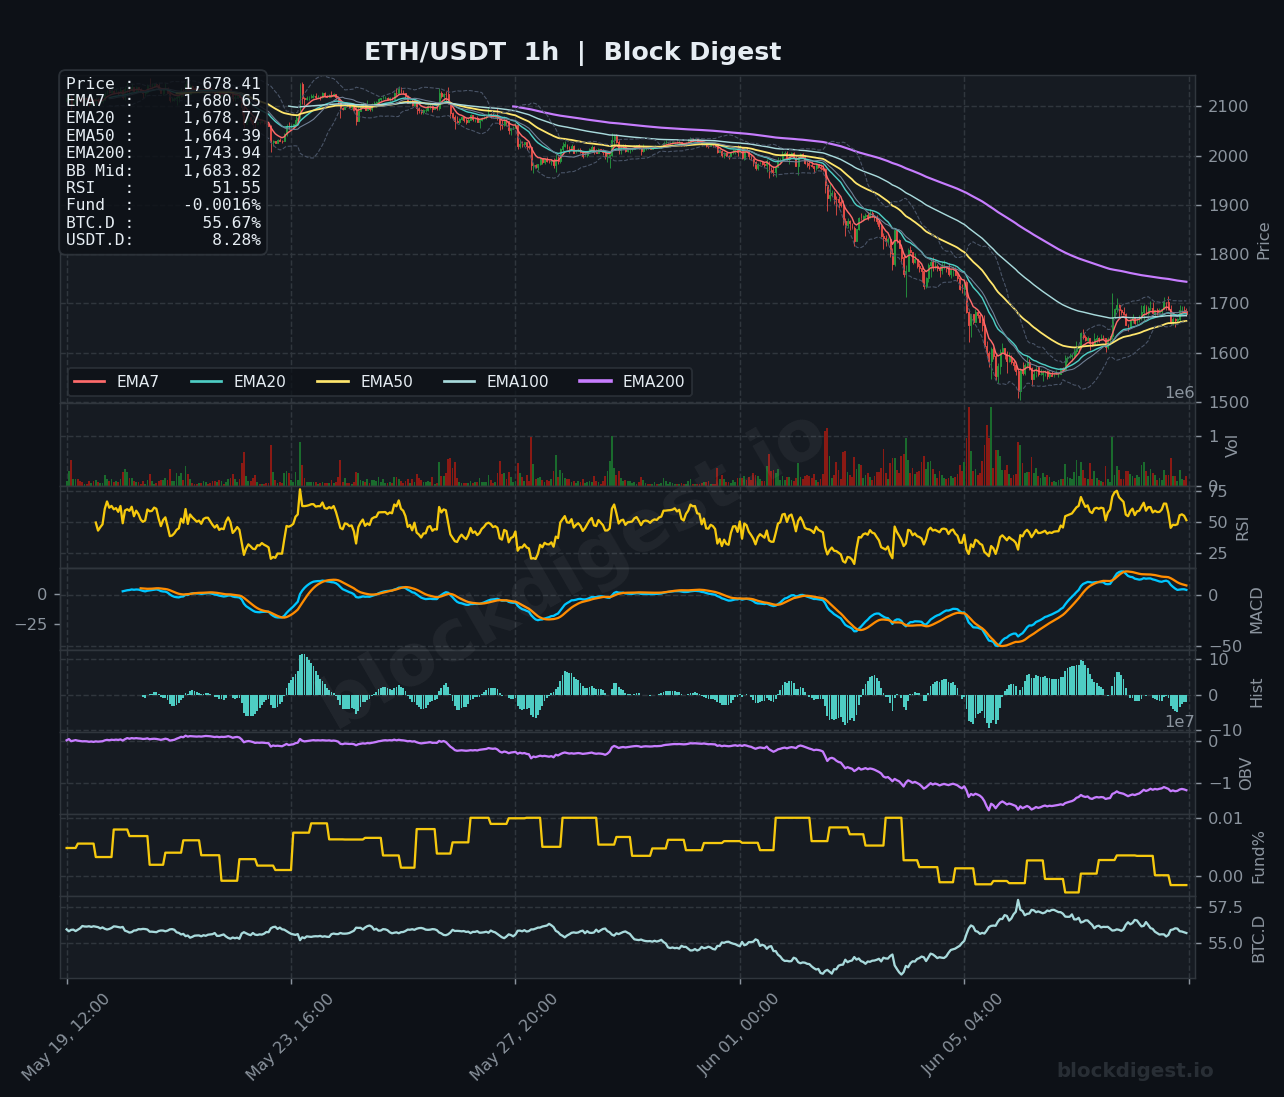
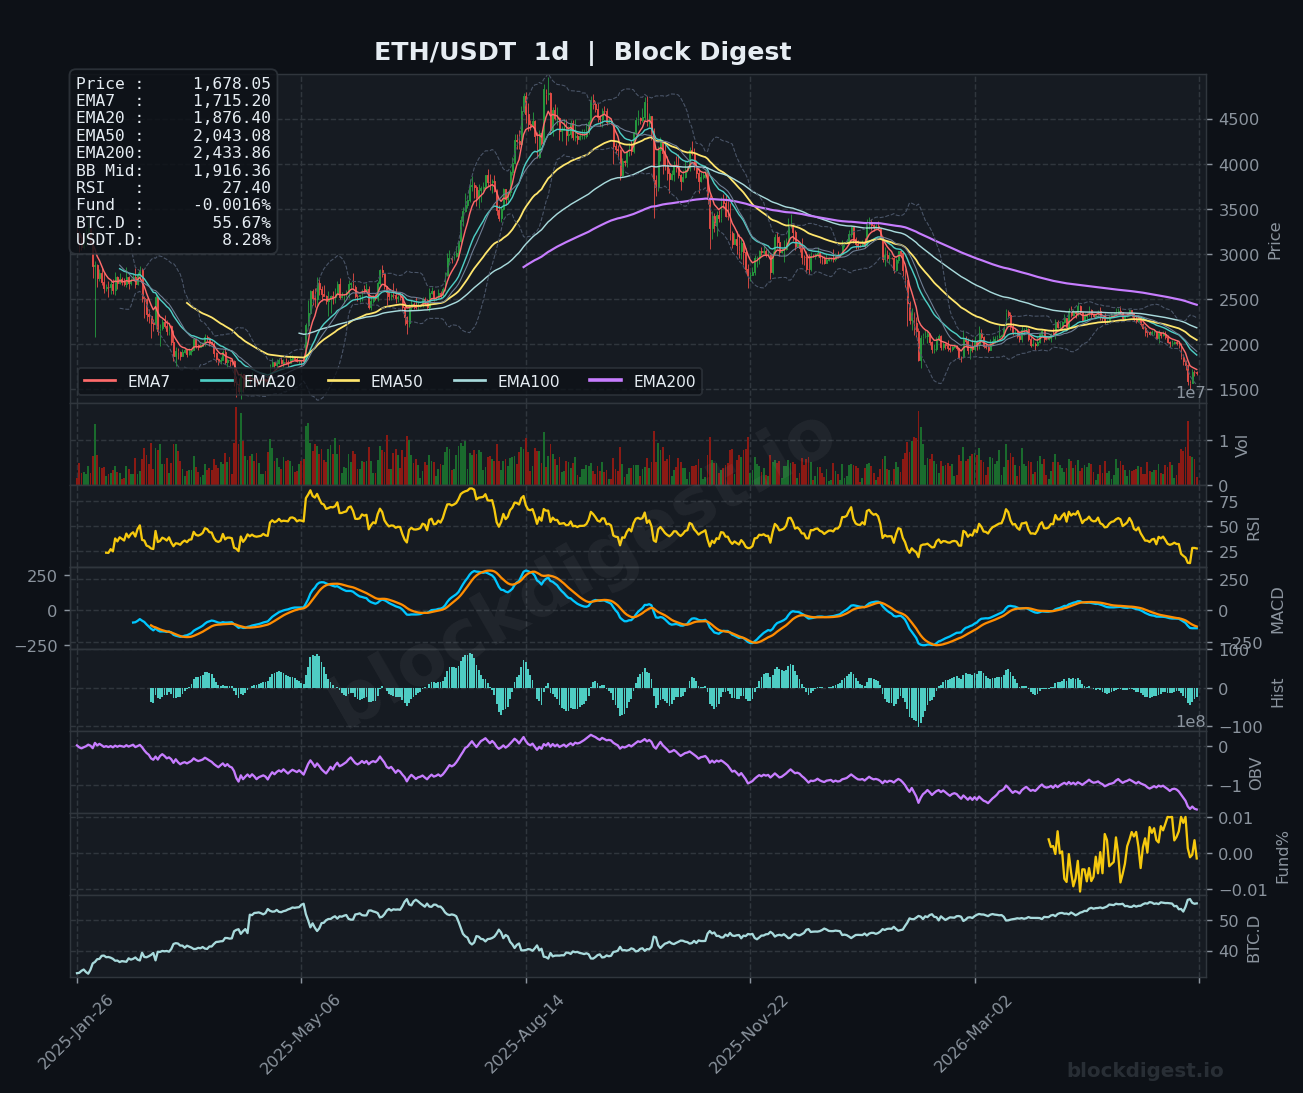
ETH/USDT is currently trading at $1,678.05, deeply entrenched in a sustained downtrend that has accelerated significantly in recent weeks. Price sits well below all major daily EMAs — the EMA7 at $1,715.20, EMA20 at $1,876.40, EMA50 at $2,043.08, and the EMA200 at $2,433.86 — painting a bearish picture across every meaningful moving average. The daily Bollinger Band midline at $1,916.36 is positioned nearly $240 above current price, confirming that ETH is trading in the lower half of its broader range with no immediate mean-reversion catalyst visible. The dominant trend on the daily timeframe remains unambiguously bearish, with the EMA stack in full bearish alignment and price making lower lows throughout the observable chart history.
Multi-Timeframe Confluence
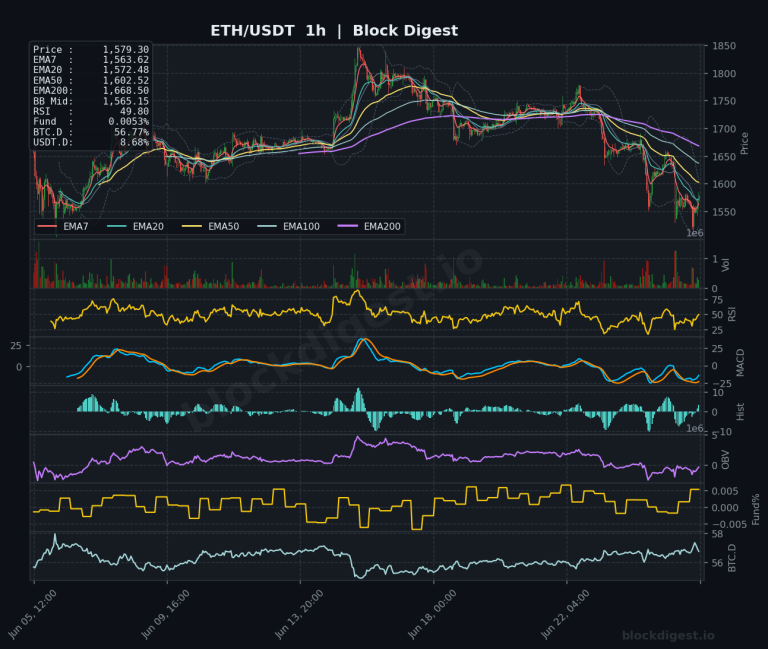
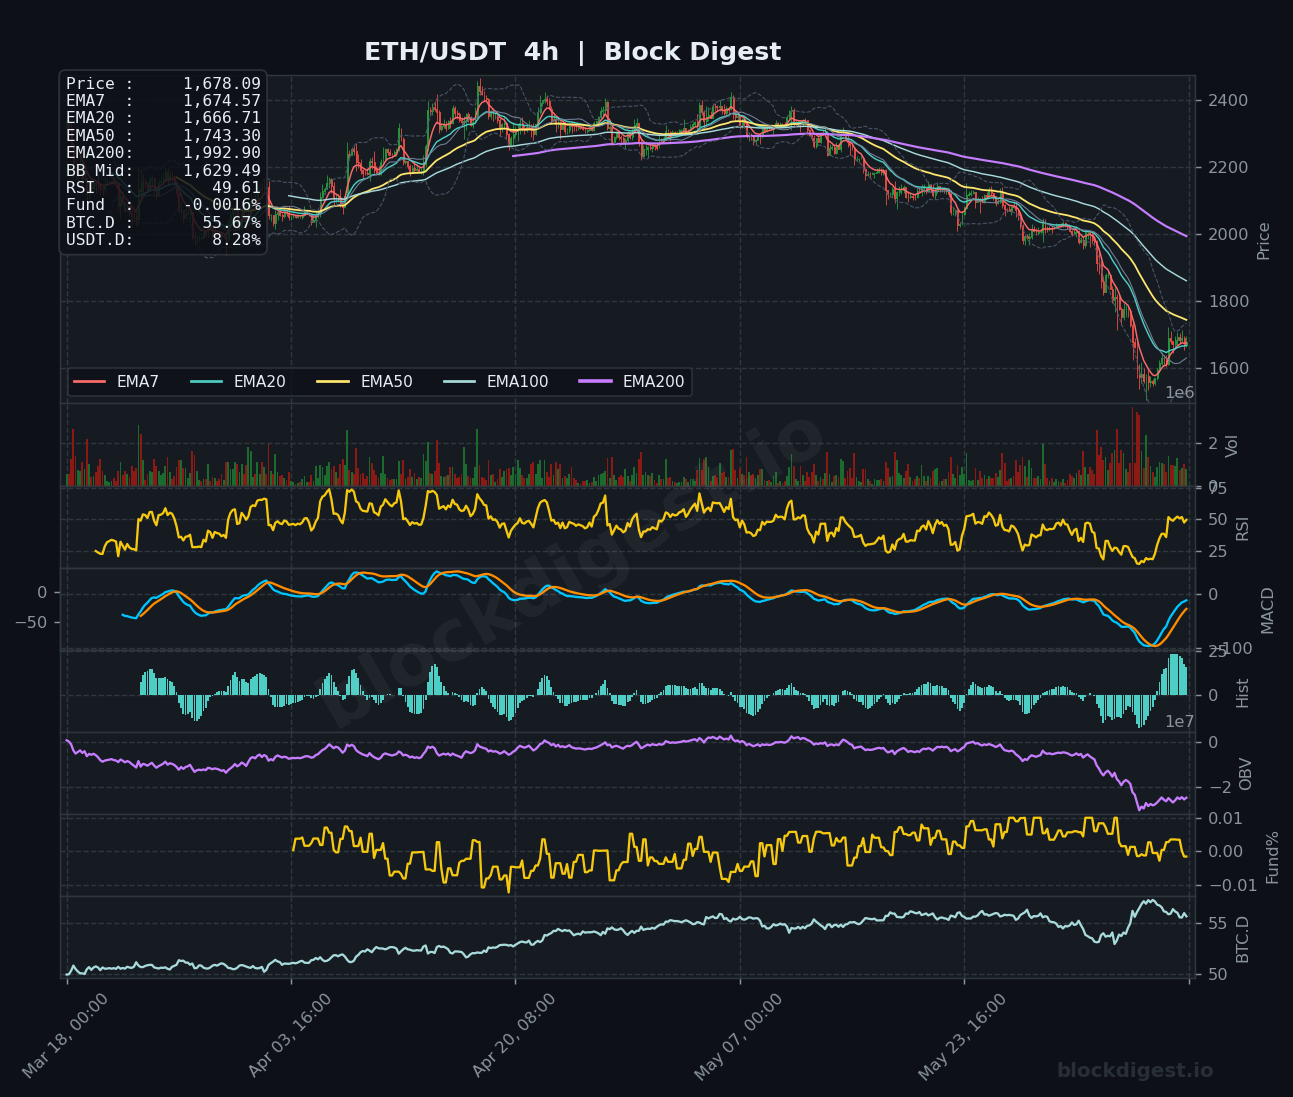
Across all three timeframes, the EMA structure reinforces a consistent bearish narrative — short-term EMAs are stacked below longer-term ones on the 1h and 4h charts, while the 1h shows price oscillating just beneath the EMA7 ($1,680.65) and EMA20 ($1,678.77), suggesting a feeble attempt at consolidation rather than genuine recovery. The 4h chart reveals that the EMA50 ($1,743.30) and EMA200 ($1,992.90) act as significant overhead resistance, with the BB midline at $1,629.49 now acting as a near-term pivot the bulls need to defend. Notably, the 1h RSI at 51.55 is marginally recovering from oversold conditions, offering a brief short-term reprieve, but this is sharply contradicted by the daily RSI plunging to 27.40 — deep in oversold territory — which reflects the severity of the macro downtrend. Any short-term relief rallies on the 1h and 4h should be treated with caution given the overwhelming bearish confluence on the daily.
Key Levels to Watch
- Resistance: $1,715–$1,720 — the 1h/4h EMA7 cluster and recent intraday supply zone where sellers have consistently re-emerged
- Resistance: $1,743 — the 4h EMA50, a key dynamic resistance that capped multiple short-term bounces during the recent decline
- Resistance: $1,876 — the daily EMA20, a critical macro level that would need to be reclaimed to suggest any structural trend reversal
- Support: $1,629 — the 4h Bollinger Band midline, a near-term battleground that bulls must hold to prevent further capitulation
- Support: $1,580–$1,600 — recent swing low zone visible on the 1h chart where aggressive dip-buying emerged; losing this level would be technically significant
- Support: $1,500 — a psychological round number and structural demand zone that represents the next meaningful floor if current support fails
Momentum & On-Chain Signals
The daily RSI at 27.40 is in oversold territory, which historically can precede short-term bounces, but alone is insufficient to call a reversal in a trend of this magnitude. The 4h MACD shows the signal and MACD lines deeply negative but beginning to converge with growing histogram bars turning green — an early, tentative sign of momentum deceleration rather than a confirmed bullish crossover. On the 1h, the MACD histogram has returned close to zero and the lines are attempting a bullish cross, consistent with the minor consolidation visible in price. OBV across all three timeframes trends persistently lower, confirming that volume-weighted selling pressure has dominated this entire decline with no meaningful accumulation signal yet emerging.
BTC Dominance & Market Sentiment
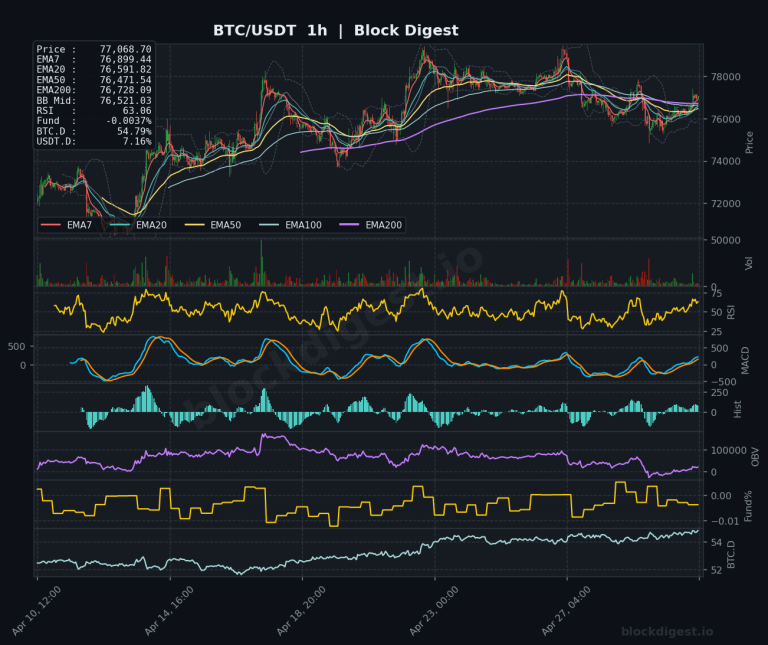
BTC.D currently sits at 55.67%, having trended upward steadily over the observed period, indicating that capital continues to rotate into Bitcoin at the expense of altcoins including ETH. USDT.D at 8.28% suggests a notable portion of market participants have moved to stablecoins, reflecting defensive positioning and reduced risk appetite across the broader crypto market. For ETH specifically, an elevated BTC.D environment historically suppresses altcoin recovery potential, meaning ETH may struggle to mount a sustained rally even if Bitcoin stabilizes near current levels.
Risk Scenarios
- Bullish case: A sustained 4h candle close above $1,743 (4h EMA50), accompanied by a confirmed MACD bullish crossover on the 4h and RSI reclaiming 40+ on the daily, would open the door toward a retest of $1,876 and potentially the $2,000 psychological level.
- Bearish case: A decisive breakdown and daily close below $1,580 on elevated volume would invalidate the current consolidation structure, targeting the $1,500 psychological support with potential for further extension toward the $1,400 zone if selling accelerates.
Outlook
The path of least resistance for ETH remains to the downside, with the daily EMA stack in full bearish alignment and OBV confirming sustained distribution. However, the daily RSI at 27.40 approaching historically oversold levels and nascent 1h MACD recovery signals suggest a short-term relief bounce toward $1,720–$1,743 cannot be ruled out in the next 24–48 hours. The critical level to monitor over this period is $1,629 on the 4h — a sustained break below this Bollinger Band midline would likely accelerate selling toward the $1,500 handle. Until ETH reclaims the daily EMA20 at $1,876 and BTC.D begins to roll over meaningfully, the prudent view is to treat any bounce as a counter-trend move within a dominant bear structure.
Disclaimer: This analysis is for informational purposes only and does not constitute financial advice. Cryptocurrency markets are highly volatile and unpredictable. All trading decisions should be made based on your own research and risk tolerance. Block Digest is not responsible for any financial losses incurred as a result of acting on this content.