Bitcoin Daily Analysis: Bitcoin at $63K, Major EMAs in Bearish Stack
Market Overview
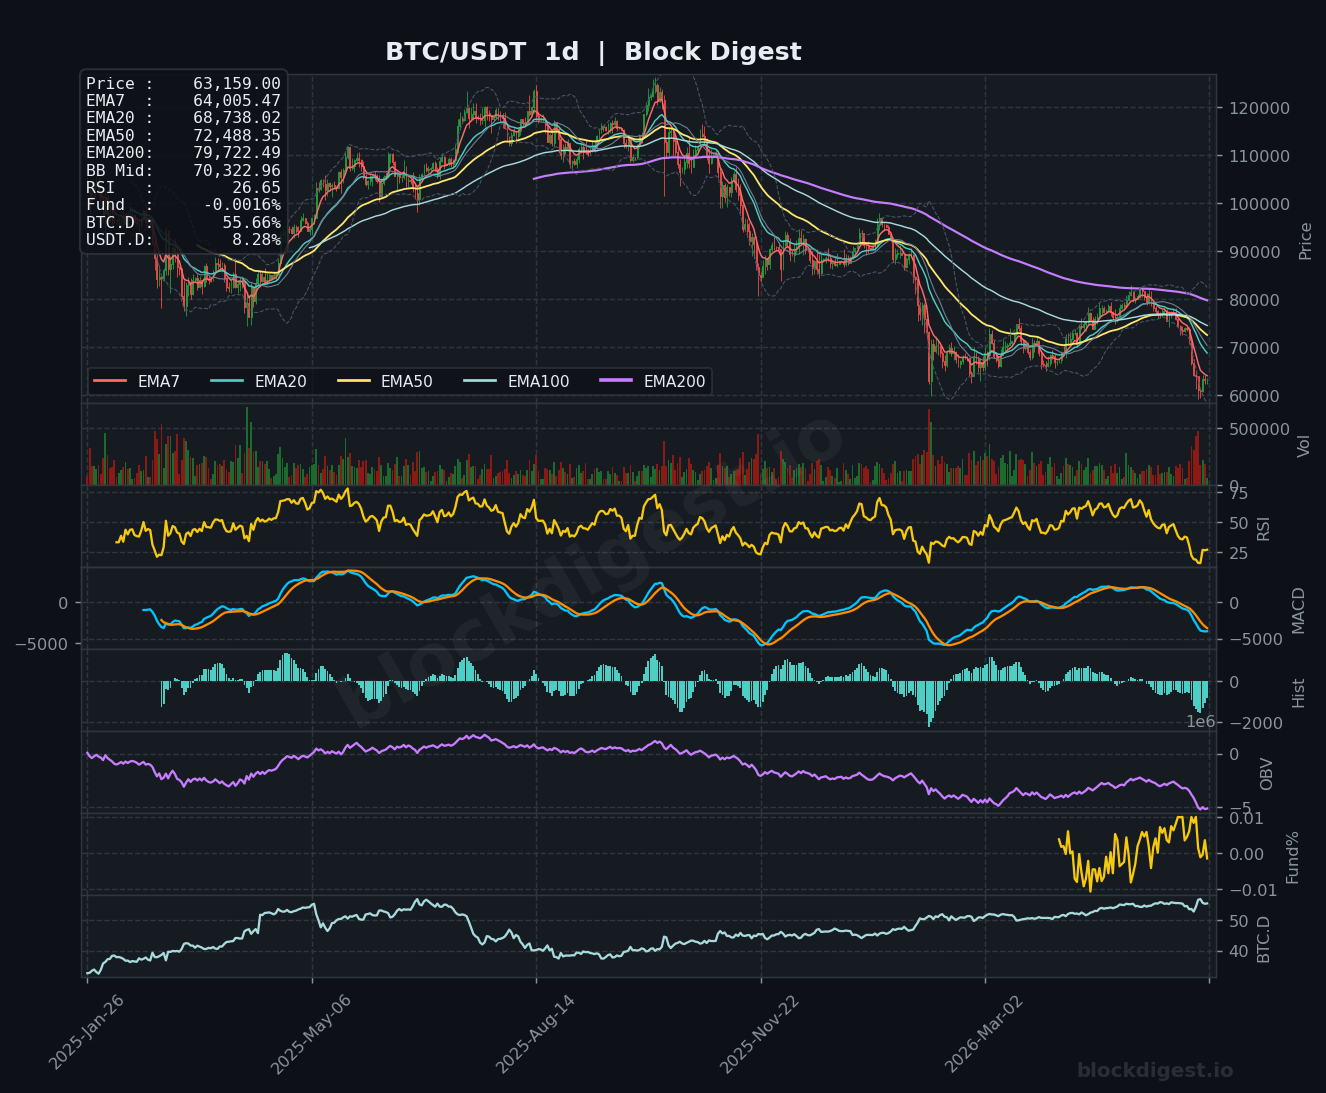
Bitcoin is trading at approximately $63,160 as of June 9, 2026, sitting roughly 50% below its all-time high of $126,210 set in October 2025. The daily timeframe paints a structurally bearish picture: price is trading well below all major EMAs, with the EMA7 at $64,005, EMA20 at $68,738, EMA50 at $72,488, and EMA200 at $79,722 — a full bearish stack that reflects the severity of the multi-month downtrend. The daily Bollinger Band midline sits at $70,323, placing current price firmly in the lower half of the band, consistent with sustained selling pressure. While price has stabilized near the $62,000–$63,000 zone recently, there is no confirmed structural reversal on the higher timeframe.
Multi-Timeframe Confluence
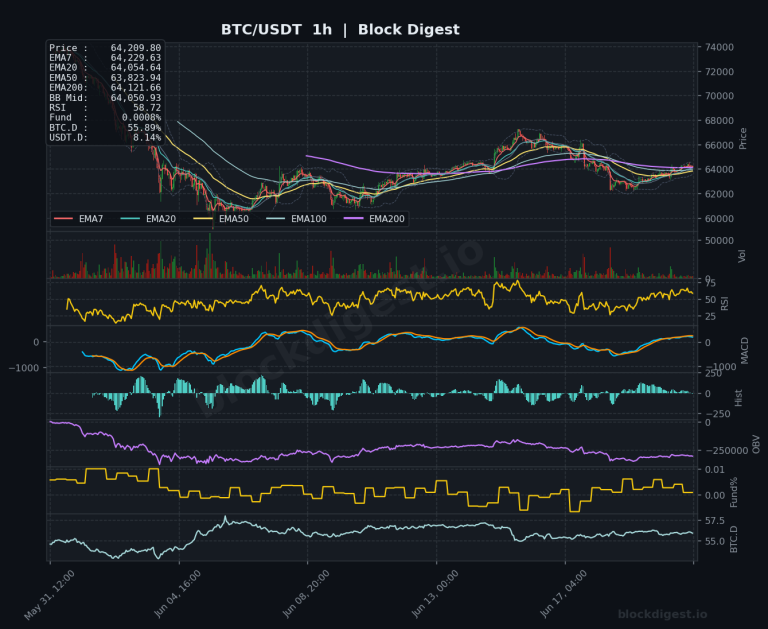
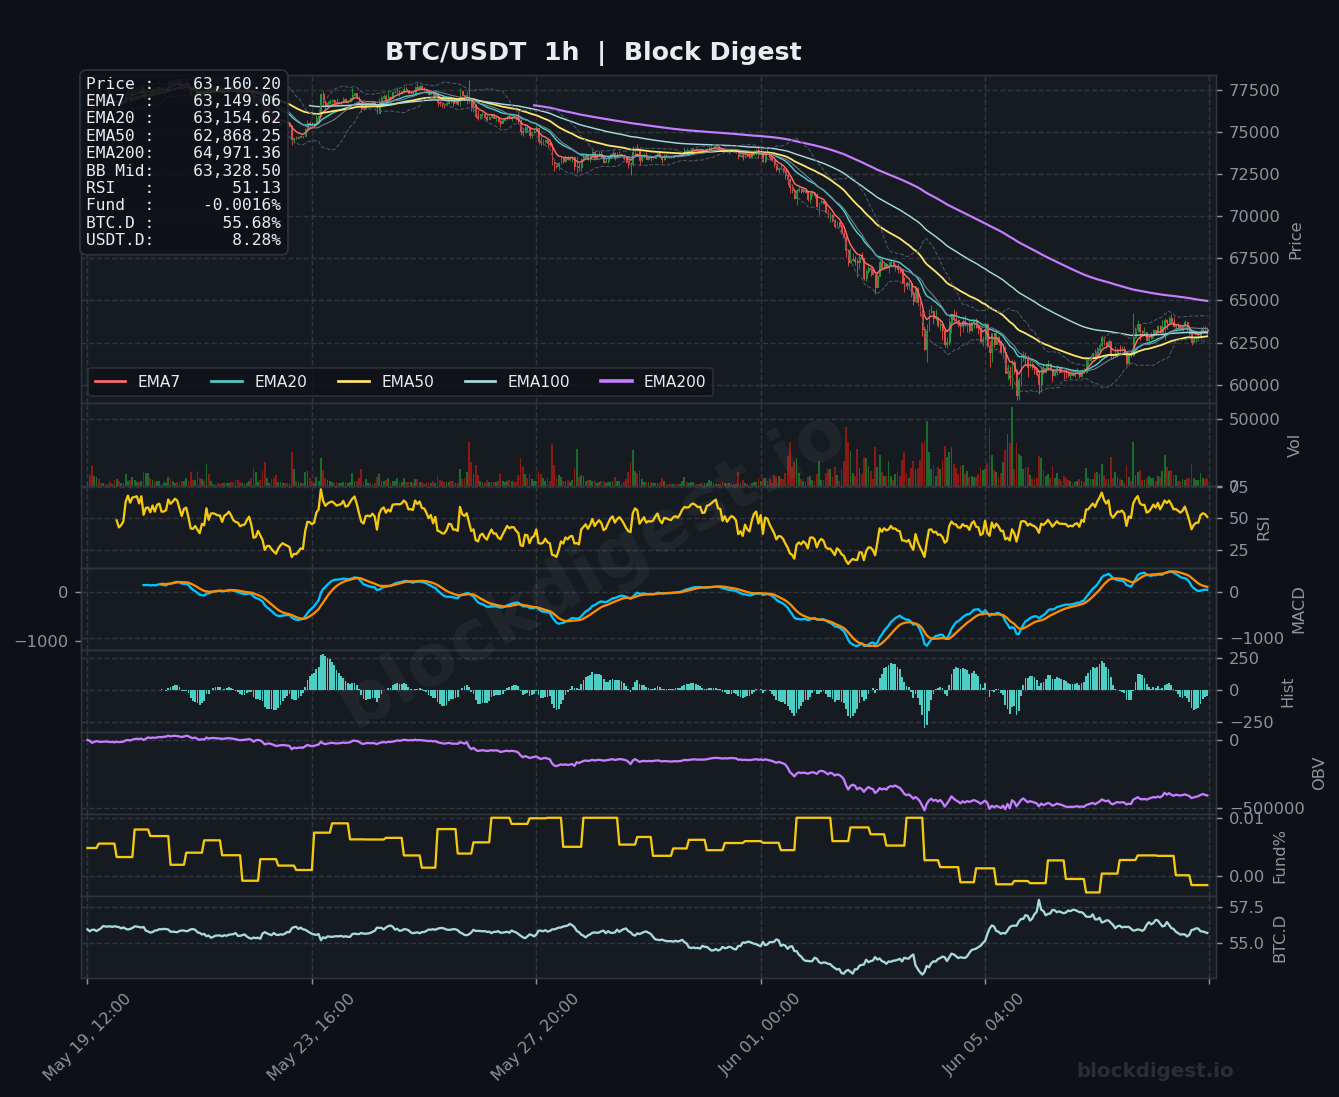
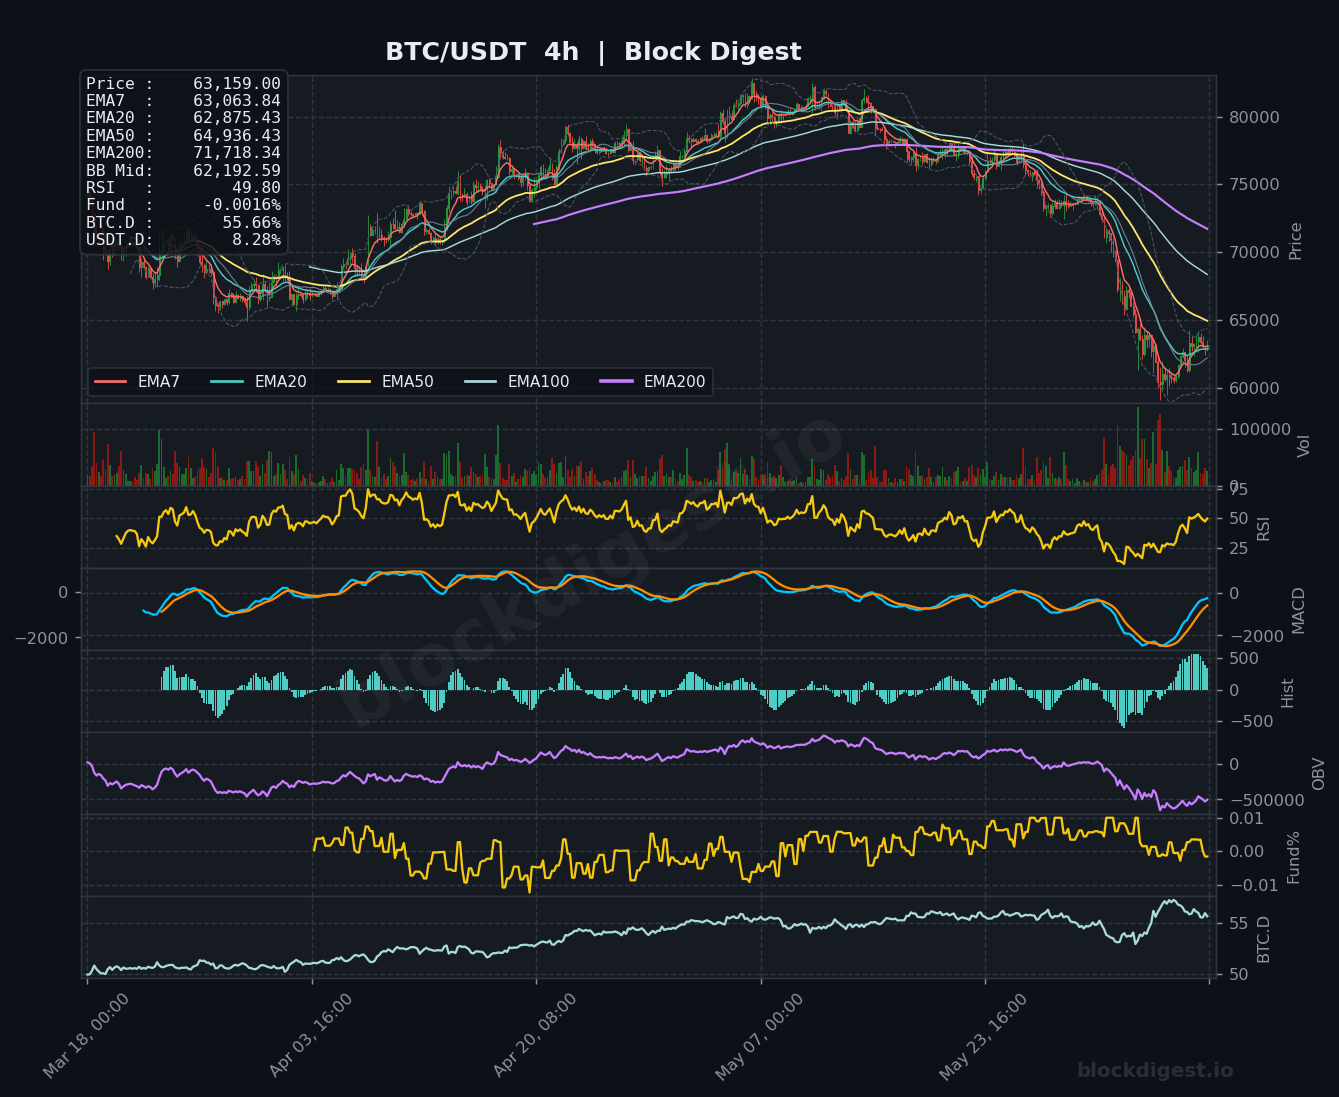
On the 1-hour chart, price is consolidating tightly around the $63,160 level, with EMA7 ($63,149), EMA20 ($63,155), and EMA50 ($62,868) all converging — a sign of short-term indecision rather than trending conviction. The 4-hour chart confirms the intermediate bearish trend, with EMA50 at $64,936 and EMA200 at $71,718 acting as significant overhead resistance layers. Notably, both the 1h and 4h frames show price attempting to stabilize above $62,000 support, but neither chart shows a definitive bullish crossover among EMAs that would confirm momentum rotation. The daily timeframe’s dominant downtrend overrides these tentative short-term stabilization signals, suggesting any bounce should be approached with caution.
Key Levels to Watch
- Resistance: $64,005 — Daily EMA7, the nearest dynamic resistance and first meaningful hurdle for any recovery attempt; $64,936 — 4h EMA50, a key intermediate barrier that has capped recent bounces; $68,738 — Daily EMA20, representing the broader intermediate trend resistance that would need to be reclaimed to shift the macro narrative
- Support: $62,000–$62,200 — Near-term structural floor visible across the 1h and 4h charts, aligning with the 4h Bollinger Band midline at $62,193; $60,000 — Psychological round number and recent swing low, a breakdown below which would accelerate selling; $58,000–$59,000 — Deeper structural support zone evident on the daily chart that previously acted as consolidation before the March 2026 relief rally
Momentum & On-Chain Signals
The daily RSI at 26.65 is approaching oversold territory, which historically has preceded at least short-term relief bounces — however, RSI can remain suppressed in strong downtrends without triggering meaningful reversals. The 4-hour MACD is showing early signs of a bullish histogram expansion from deeply negative levels, with the signal line beginning to curl upward, though no confirmed crossover has occurred. On the 1-hour chart, MACD is mildly positive and RSI sits at 51.13, reflecting the short-term stabilization. OBV on both the daily and 4-hour charts continues to trend downward, indicating persistent net distribution and undermining the validity of the short-term price stabilization — a notable bearish divergence from the modest price recovery. The funding rate at -0.0016% is mildly negative, suggesting slight short bias in perpetuals, which could fuel a short squeeze if buyers step in with conviction.
BTC Dominance & Market Sentiment
BTC Dominance stands at 55.68%, a notably elevated reading that reflects continued capital rotation into Bitcoin relative to altcoins — likely driven by institutional accumulation activity from entities like Strategy and Strive, which are selectively buying BTC rather than the broader market. USDT.D at 8.28% indicates a meaningful portion of crypto capital remains parked in stablecoins, signaling broader market risk aversion and a wait-and-see posture among participants. These readings collectively suggest the market has not yet entered a risk-on phase, and the elevated USDT.D could either fuel a recovery if deployed or reflect continued hesitation ahead of macro catalysts.
Risk Scenarios
- Bullish case: A sustained hourly close above $64,005 (daily EMA7) accompanied by a confirmed 4-hour MACD bullish crossover and rising OBV would signal short-term recovery momentum, with an initial target toward the $65,500–$66,000 zone and a secondary target near $68,738 (daily EMA20).
- Bearish case: A decisive breakdown below $62,000 support on elevated volume, particularly if the 4-hour candle closes beneath this level, would likely accelerate selling toward the $60,000 psychological support, with extended downside risk to the $58,000–$59,000 structural zone given the weak OBV backdrop.
Outlook
The overall setup for BTC on June 9, 2026 is cautiously bearish with limited short-term recovery potential, as the dominant daily downtrend, bearish EMA stack, and declining OBV continue to outweigh the oversold daily RSI reading and mild institutional accumulation signals. The critical trigger to watch over the next 24–48 hours is whether price can reclaim and hold above $64,005 — failure to do so maintains the path of least resistance to the downside. Macro headwinds, including residual ETF outflow pressure tied to April inflation data and potential capital competition from major IPOs, add further weight to the bearish thesis. Until price demonstrates sustained reclamation of at minimum the $64,936–$65,000 zone on the 4-hour timeframe, any intraday rally should be treated as a dead-cat bounce within a broader distribution structure rather than a confirmed trend reversal.
Disclaimer: This analysis is for informational purposes only and does not constitute financial advice. Cryptocurrency markets are highly volatile and unpredictable. All trading decisions should be made based on your own research and risk tolerance. Block Digest is not responsible for any financial losses incurred as a result of acting on this content.