
Market Context
The broader altcoin market is navigating a cautious recovery as of July 10, 2026, with BTC dominance sitting at 55.70–55.72% — a level that continues to suppress meaningful altcoin outperformance despite a mild 1.3% total market cap gain over the past 24 hours. USDT dominance at 8.10% remains elevated, signaling that a significant pool of sidelined capital has yet to rotate back into risk assets. The Fear & Greed Index edging from 24 to 27 reflects a marginal improvement in sentiment, though legislative optimism around the Crypto Clarity Act and the return of spot Bitcoin ETF inflows offer early green shoots for a more sustained recovery.
Solana (SOL)
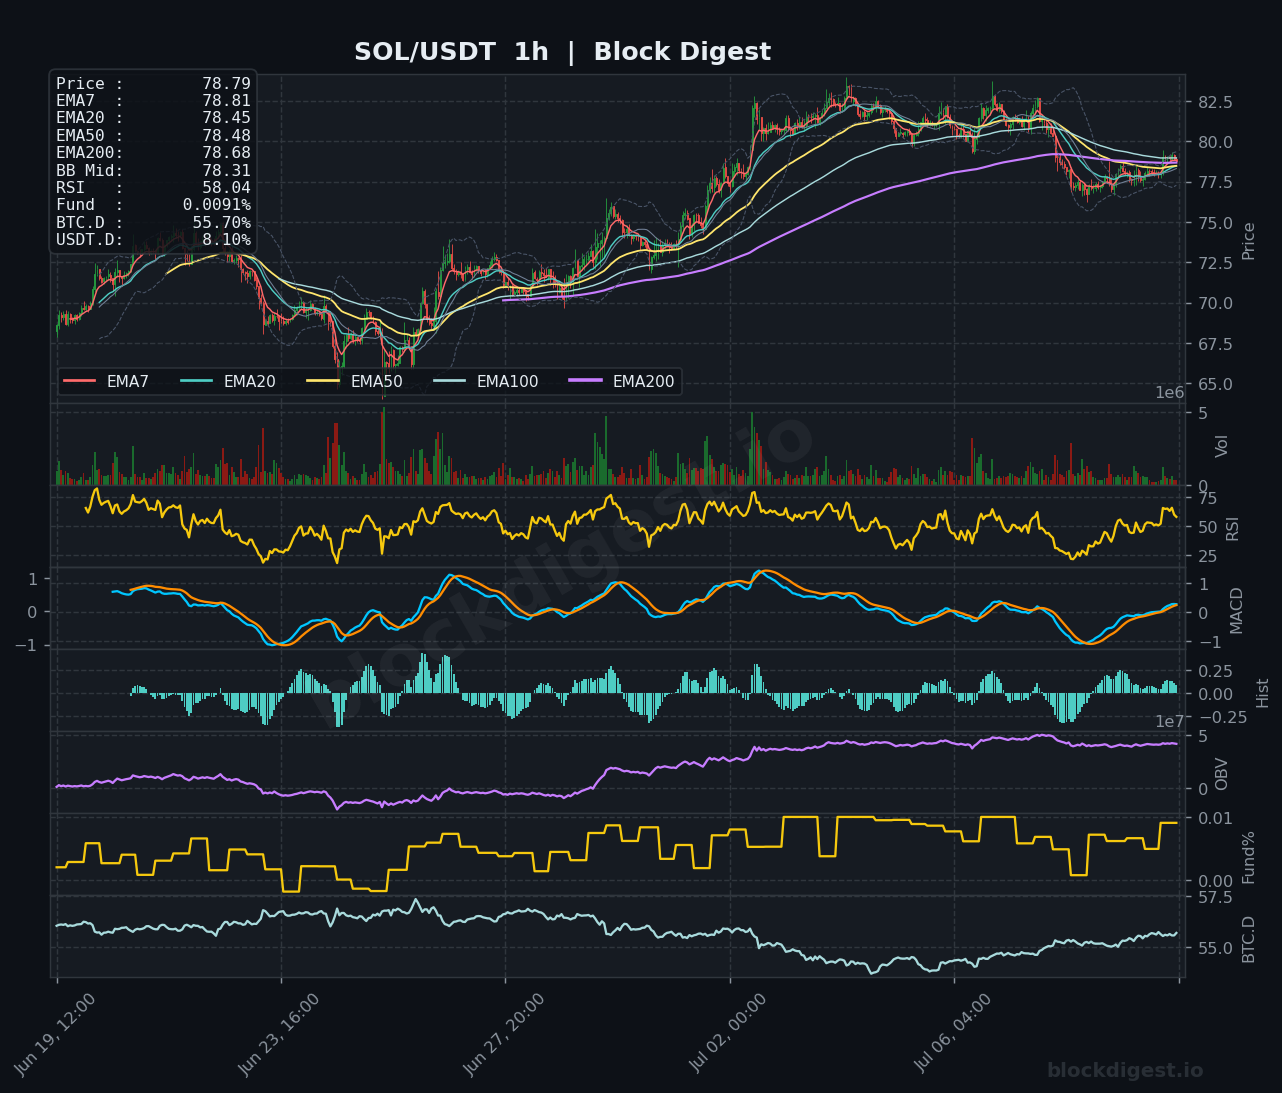
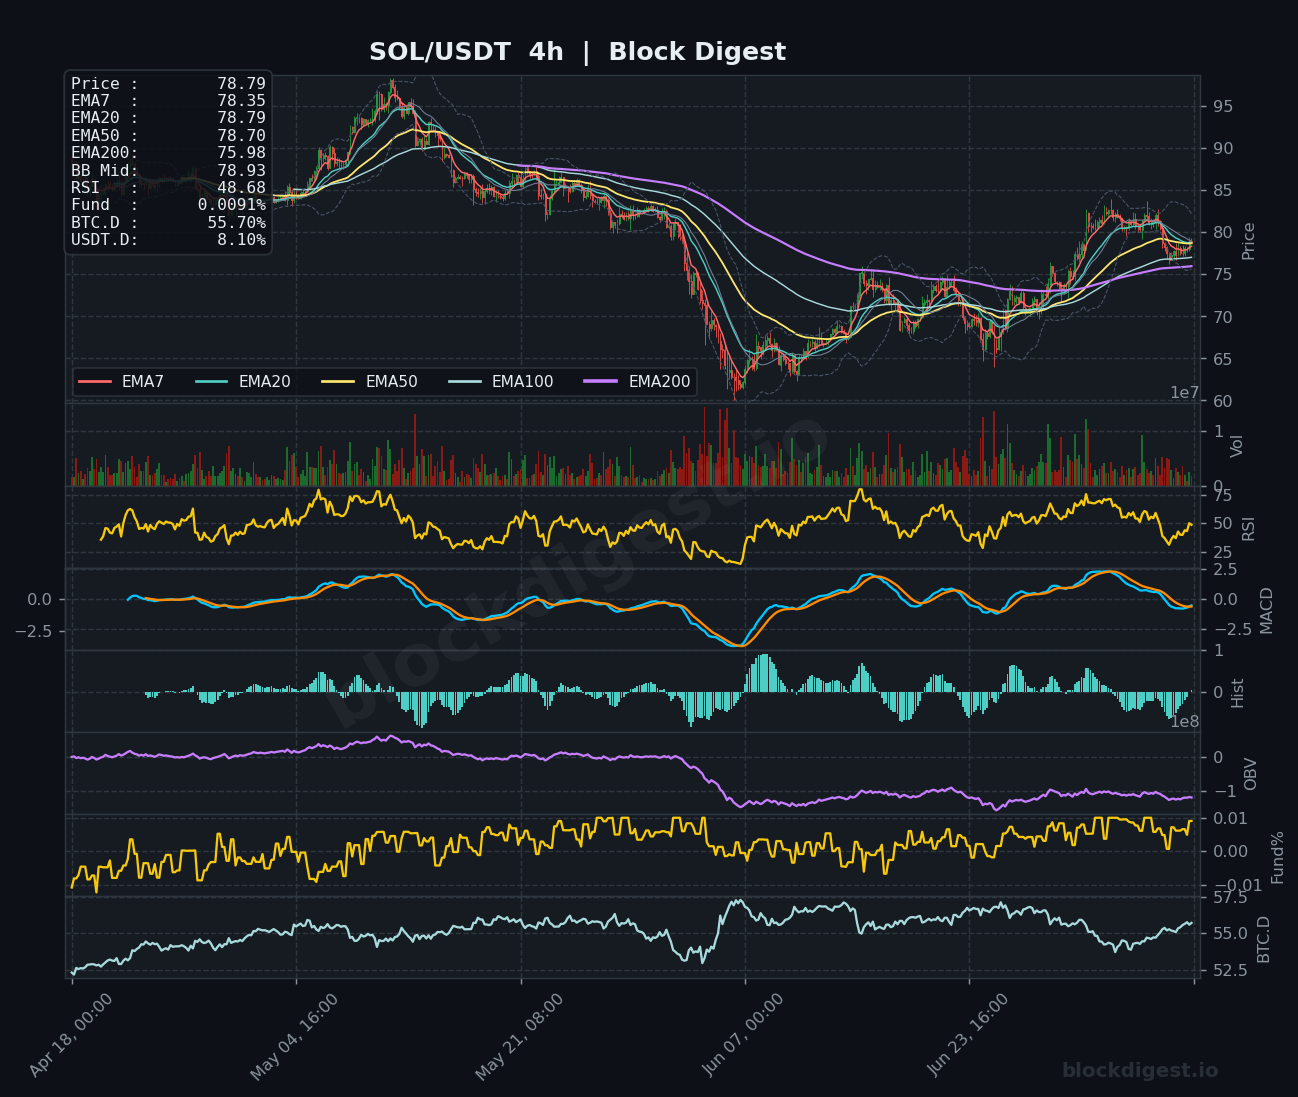
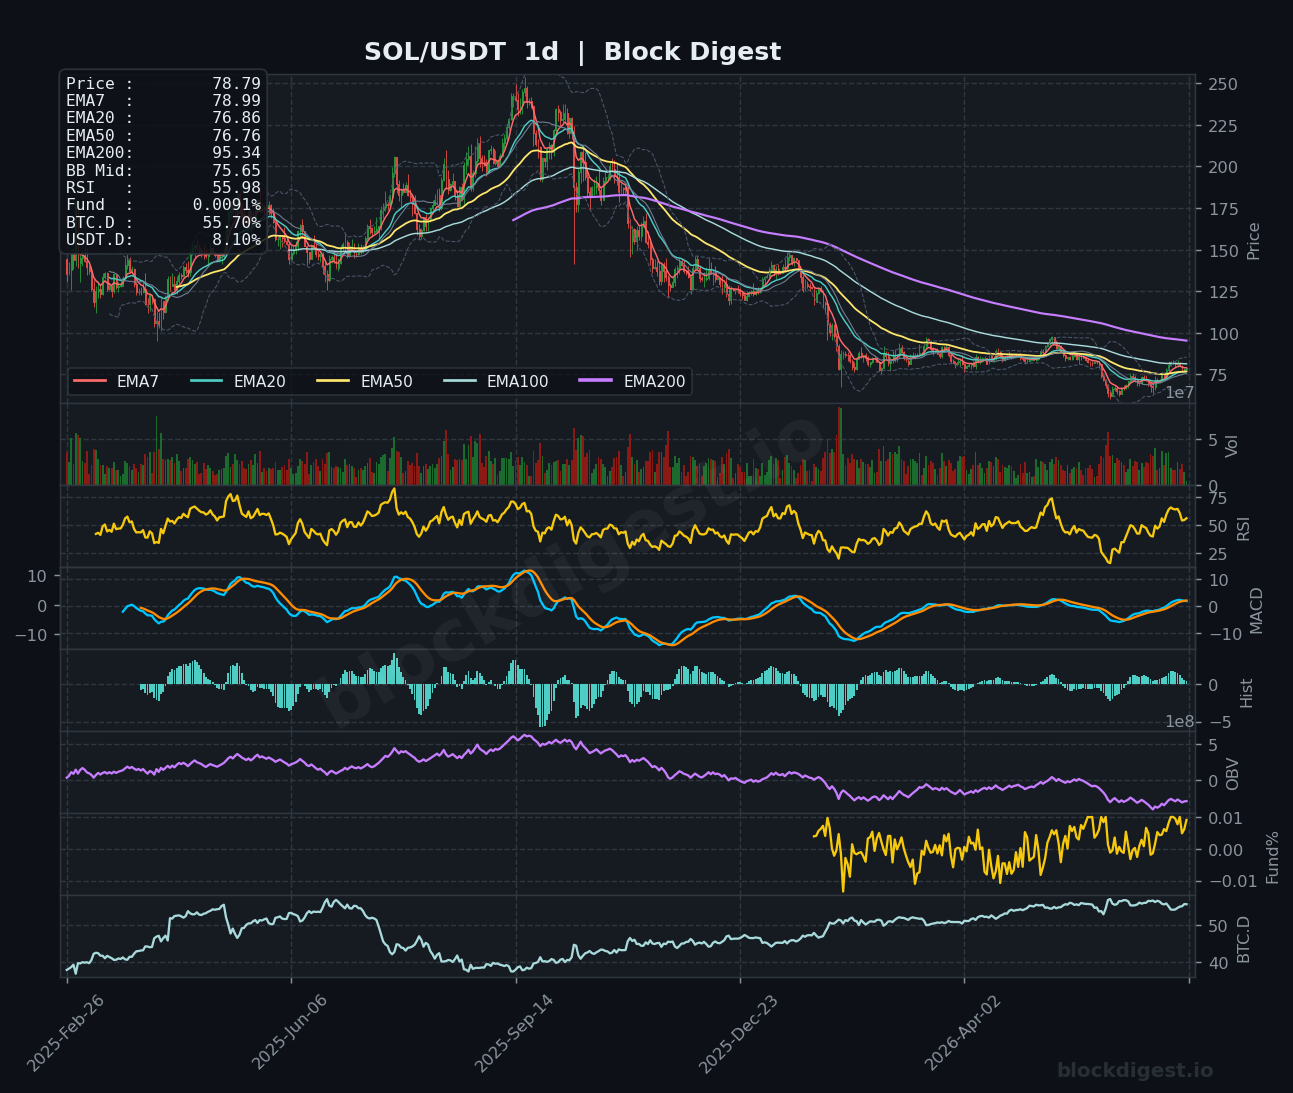
SOL is trading at $78.79 after staging a notable recovery from lows near $63–65, but is now consolidating just below the cluster of short-term EMAs (EMA7 at $78.81, EMA20 at $78.45, EMA50 at $78.48), which are all compressed tightly — a sign of indecision following the rally. On the 4h chart, RSI sits at 48.68 and the MACD is attempting a bullish cross near zero, suggesting the bearish momentum from the prior downtrend has been absorbed but conviction for the next leg higher is thin. The daily chart shows RSI at 55.98 with price trading above both the EMA20 ($76.86) and EMA50 ($76.76), which is constructive, though the EMA200 at $95.34 looms as a far-off structural resistance that underscores the depth of the prior drawdown. Key support sits at $76.50–$77.00; a clean hold and push above $80.00 would be the next meaningful bullish trigger.
XRP (XRP)
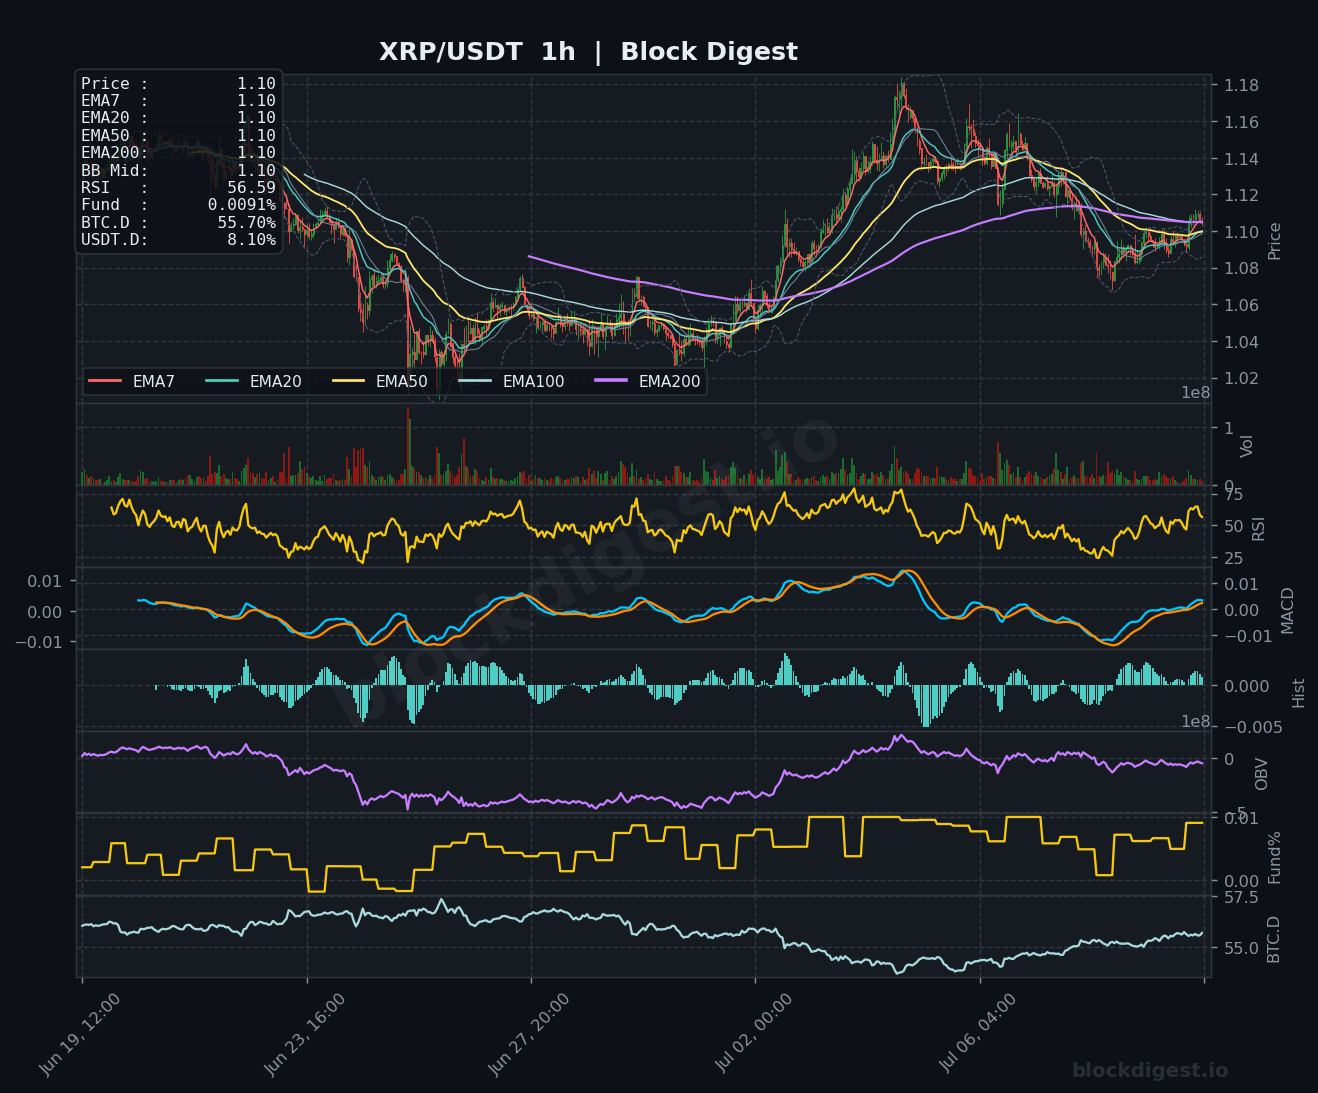
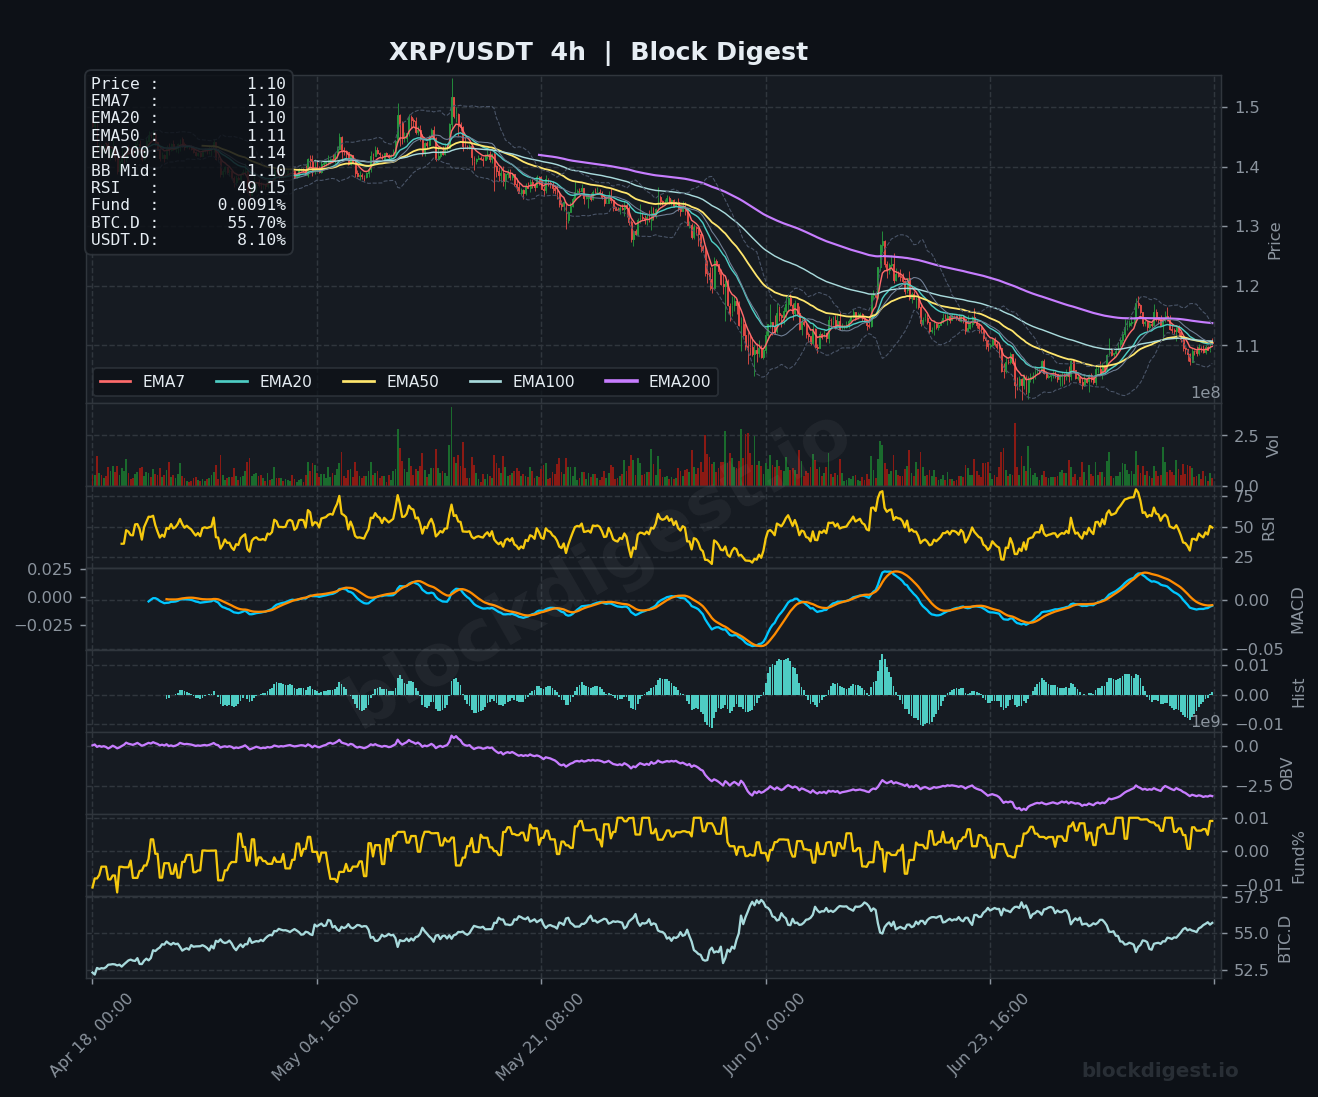
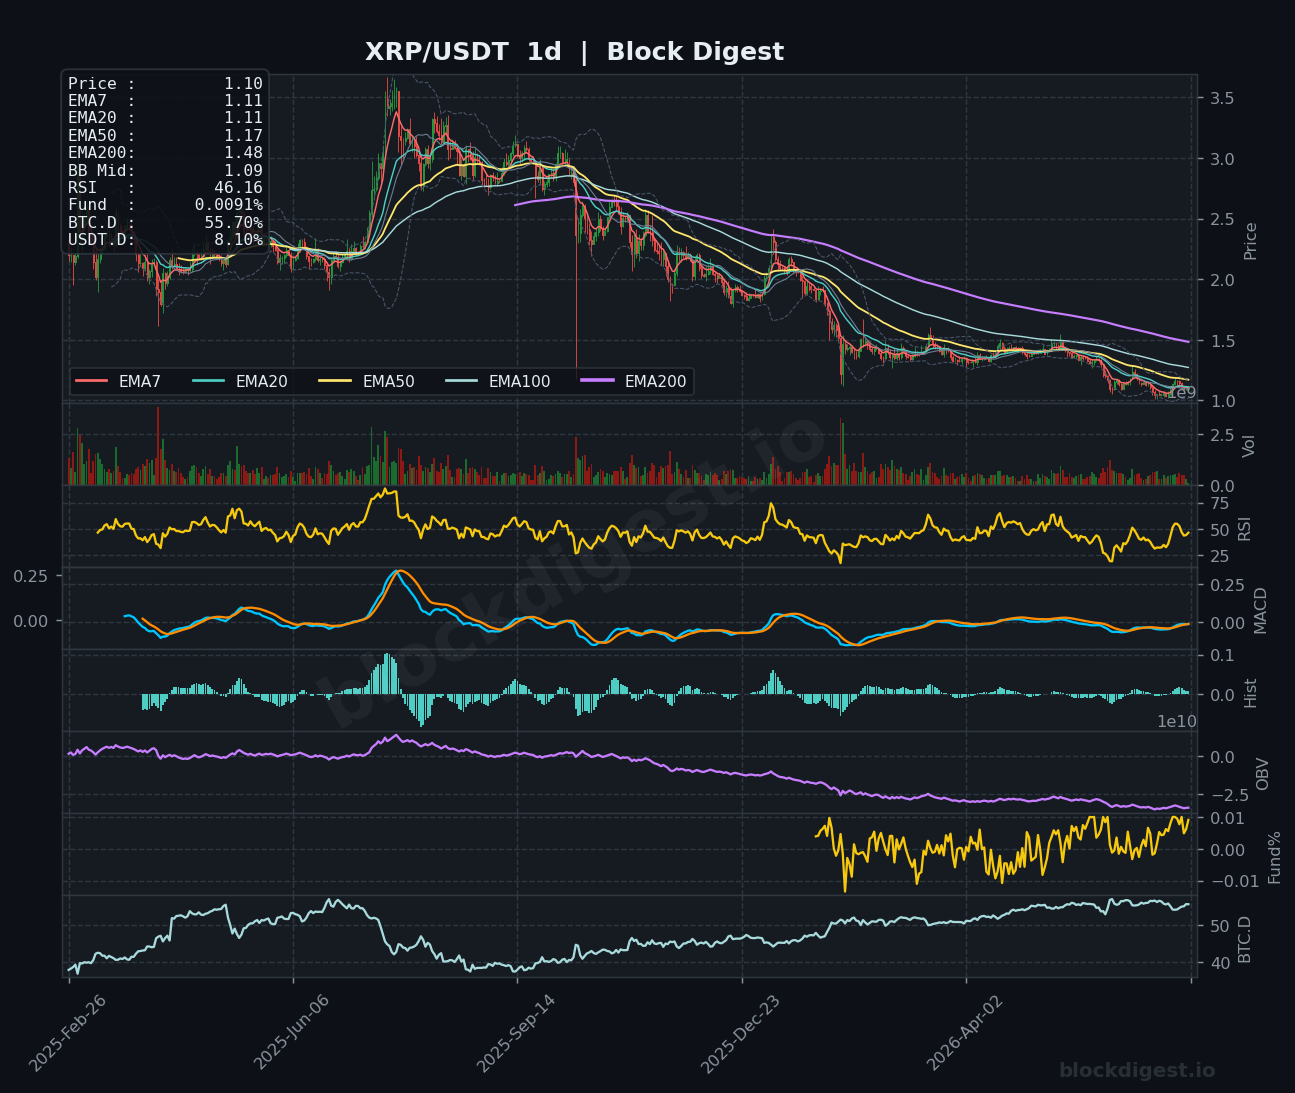
XRP is trading at $1.10, tightly coiling around its EMA stack (EMA7, EMA20, EMA50, and EMA200 all converging near $1.10–$1.11 on the 1h chart), indicating a compression phase that typically precedes a directional breakout. The 4h RSI at 49.15 is neutral, and the MACD remains very close to the zero line with a slight bearish lean — no strong directional signal is emerging from intermediate timeframes. On the daily chart, RSI reads 46.16 and price is trading below both the EMA50 ($1.17) and EMA200 ($1.48), painting a structurally bearish macro picture as OBV continues to trend lower, reflecting persistent net selling pressure over the longer term. Bulls need a confirmed break and close above $1.14–$1.15 to shift near-term bias; a failure at that level risks a retest of the $1.05–$1.07 support zone.
BNB (BNB)
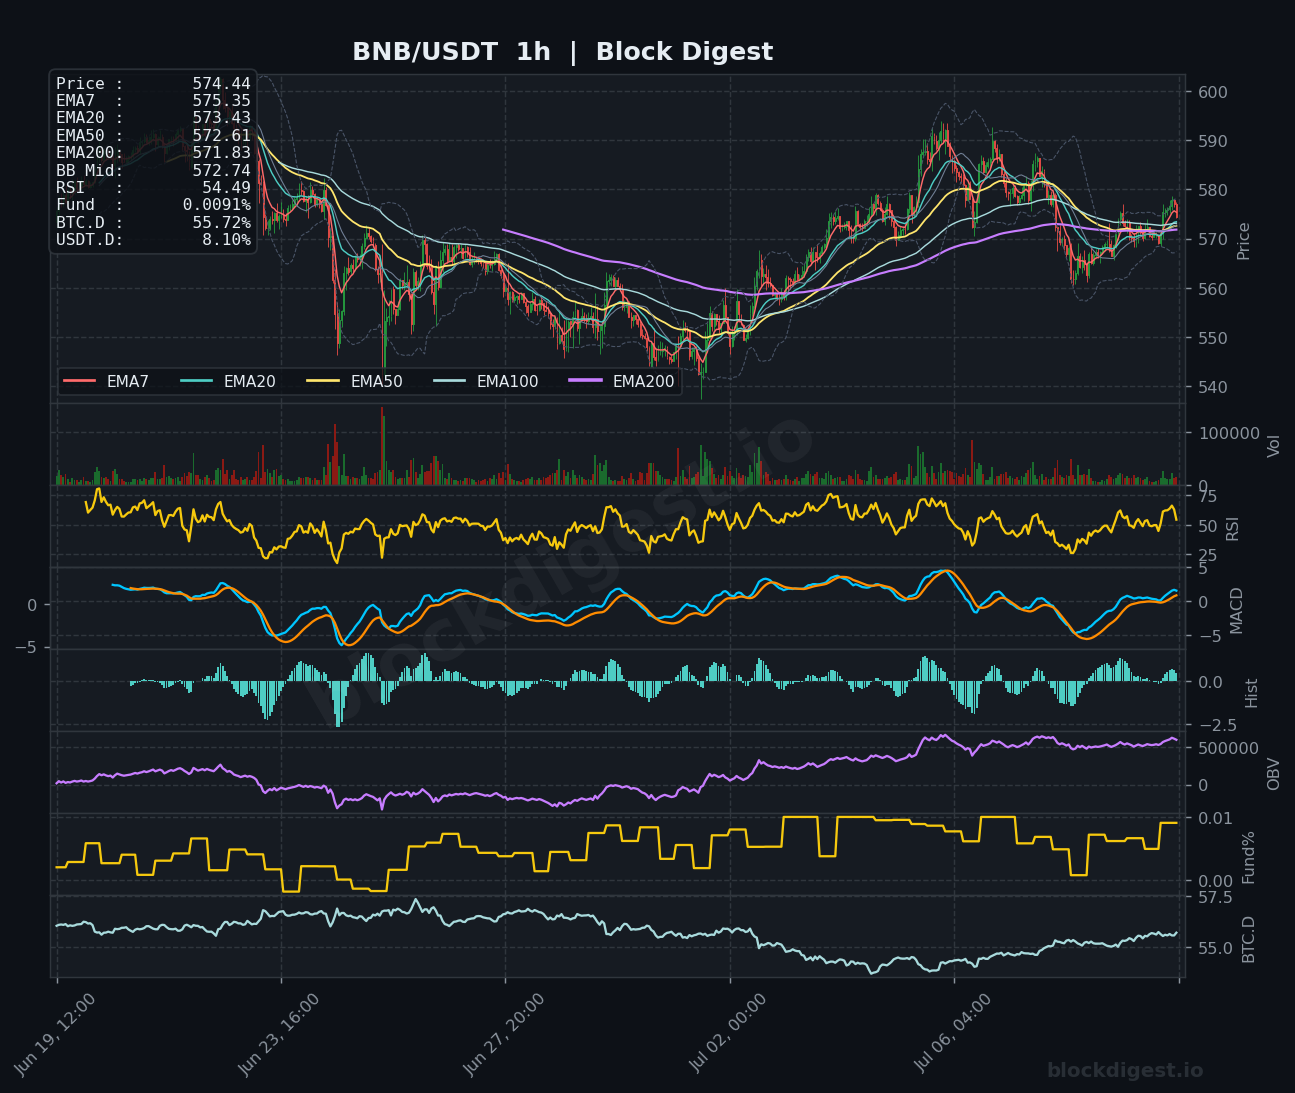
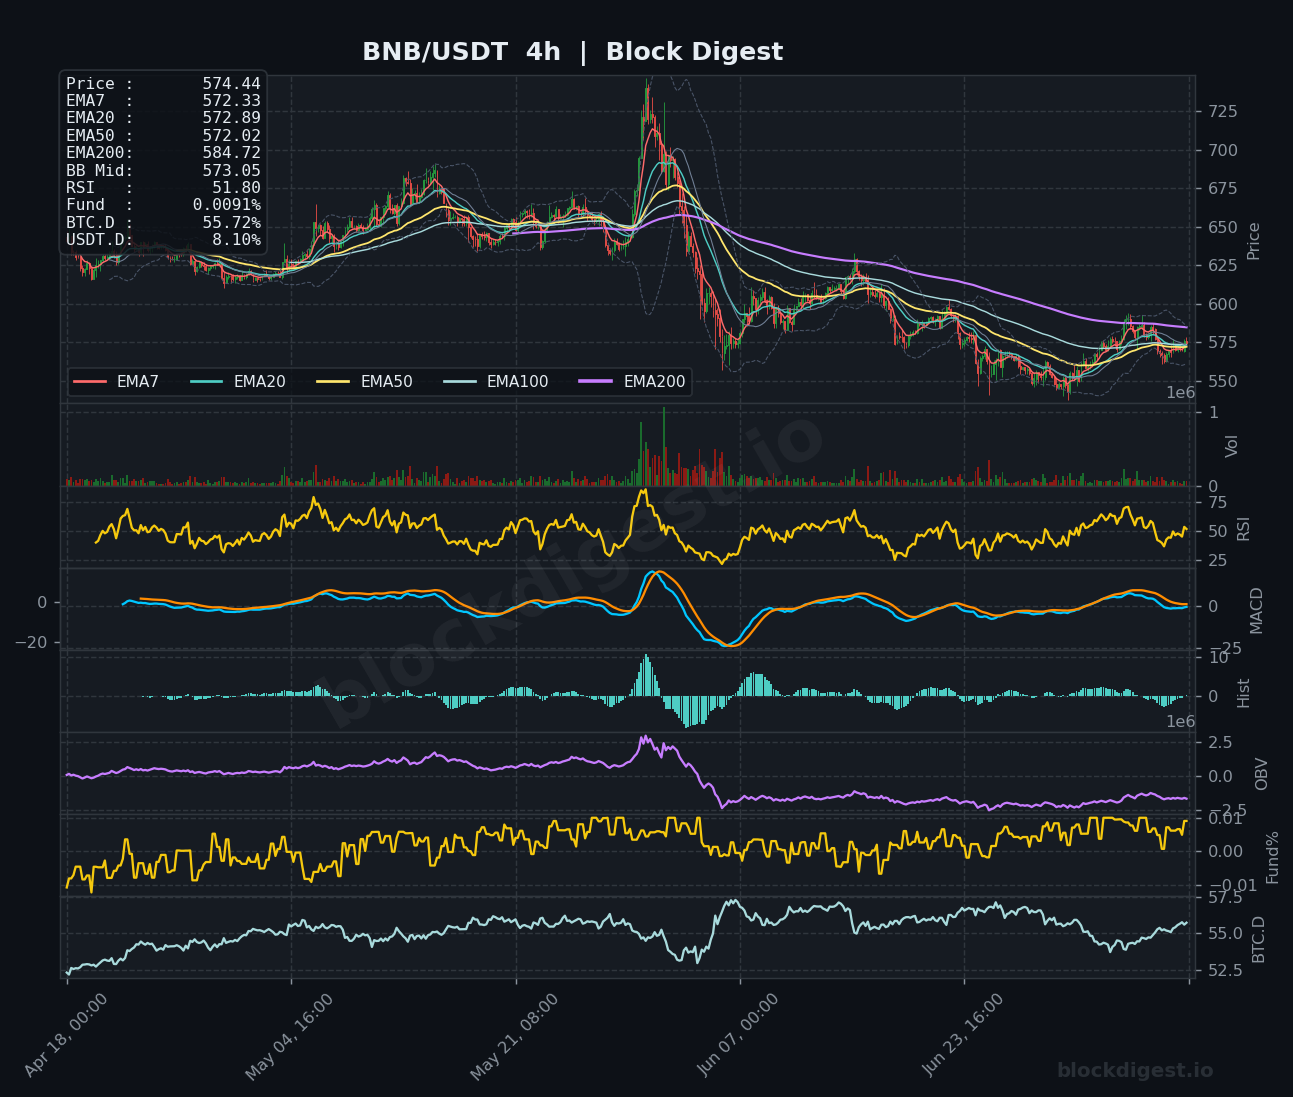
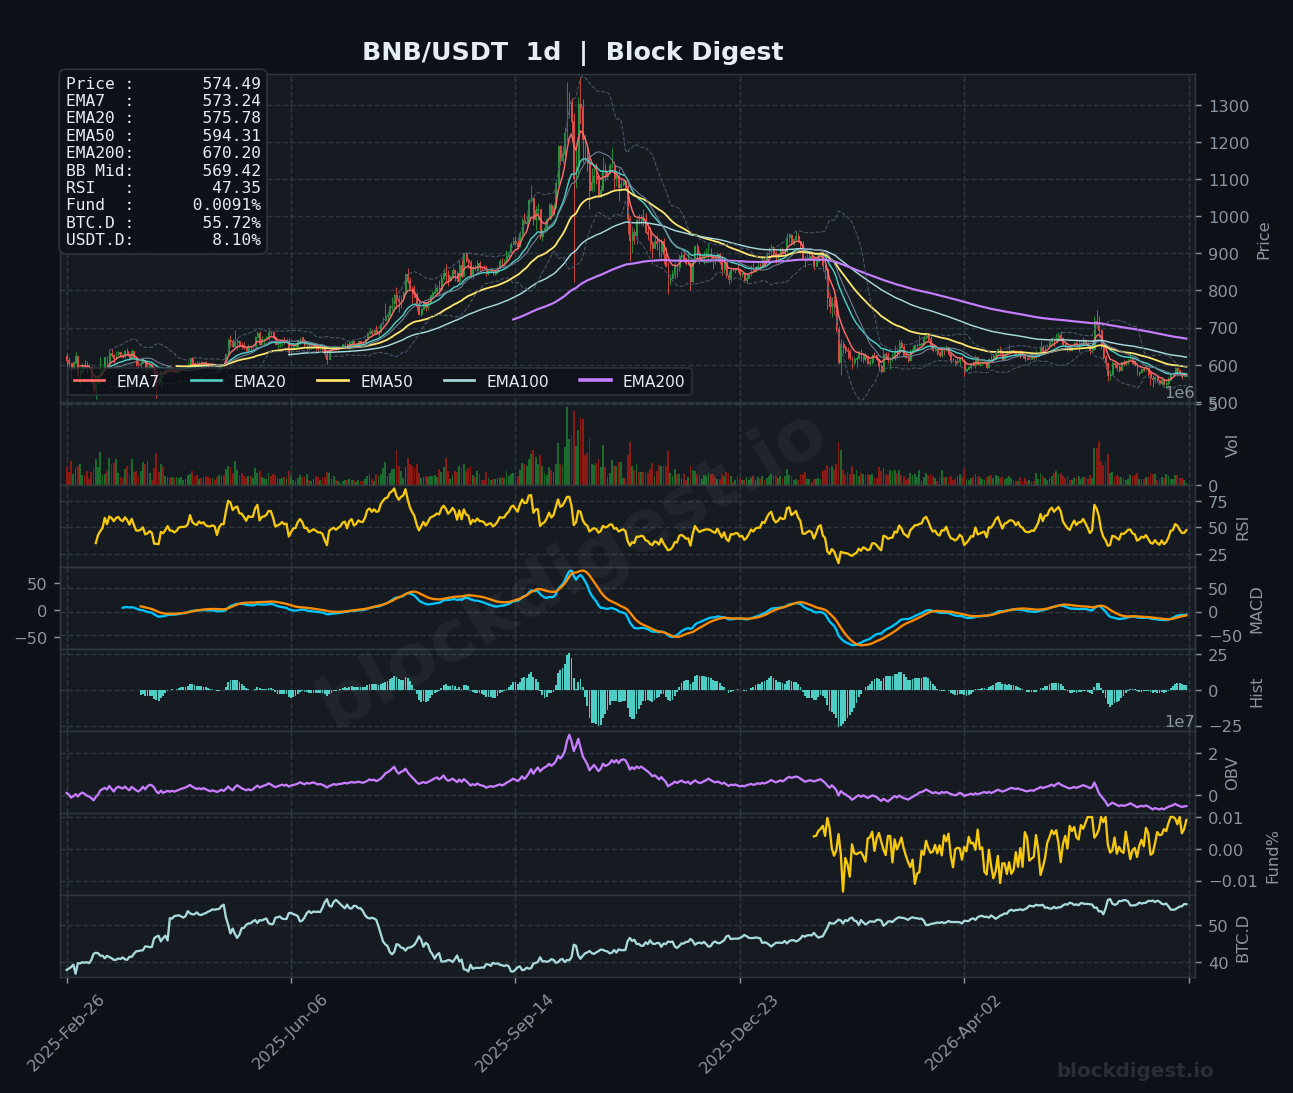
BNB is trading at $574.44 with the 1h EMA stack tightly aligned between $571.83 and $575.35, and the RSI at 54.49 showing a mild bullish lean in the near term. The 4h chart presents a more mixed picture — RSI is at 51.80 and MACD is hovering just above zero, indicating the asset has stabilized following a sharp decline from the $700+ peak but is yet to build convincing bullish momentum. On the daily chart, price remains well below the EMA50 ($594.31) and EMA200 ($670.20), and the OBV has been declining over the longer term, confirming that distribution pressure remains present at higher levels. BNB’s immediate battleground is the $570–$580 range; a breakout above $590 would target the EMA50, while a loss of $555 would put the recent lows back in focus.
Dogecoin (DOGE)
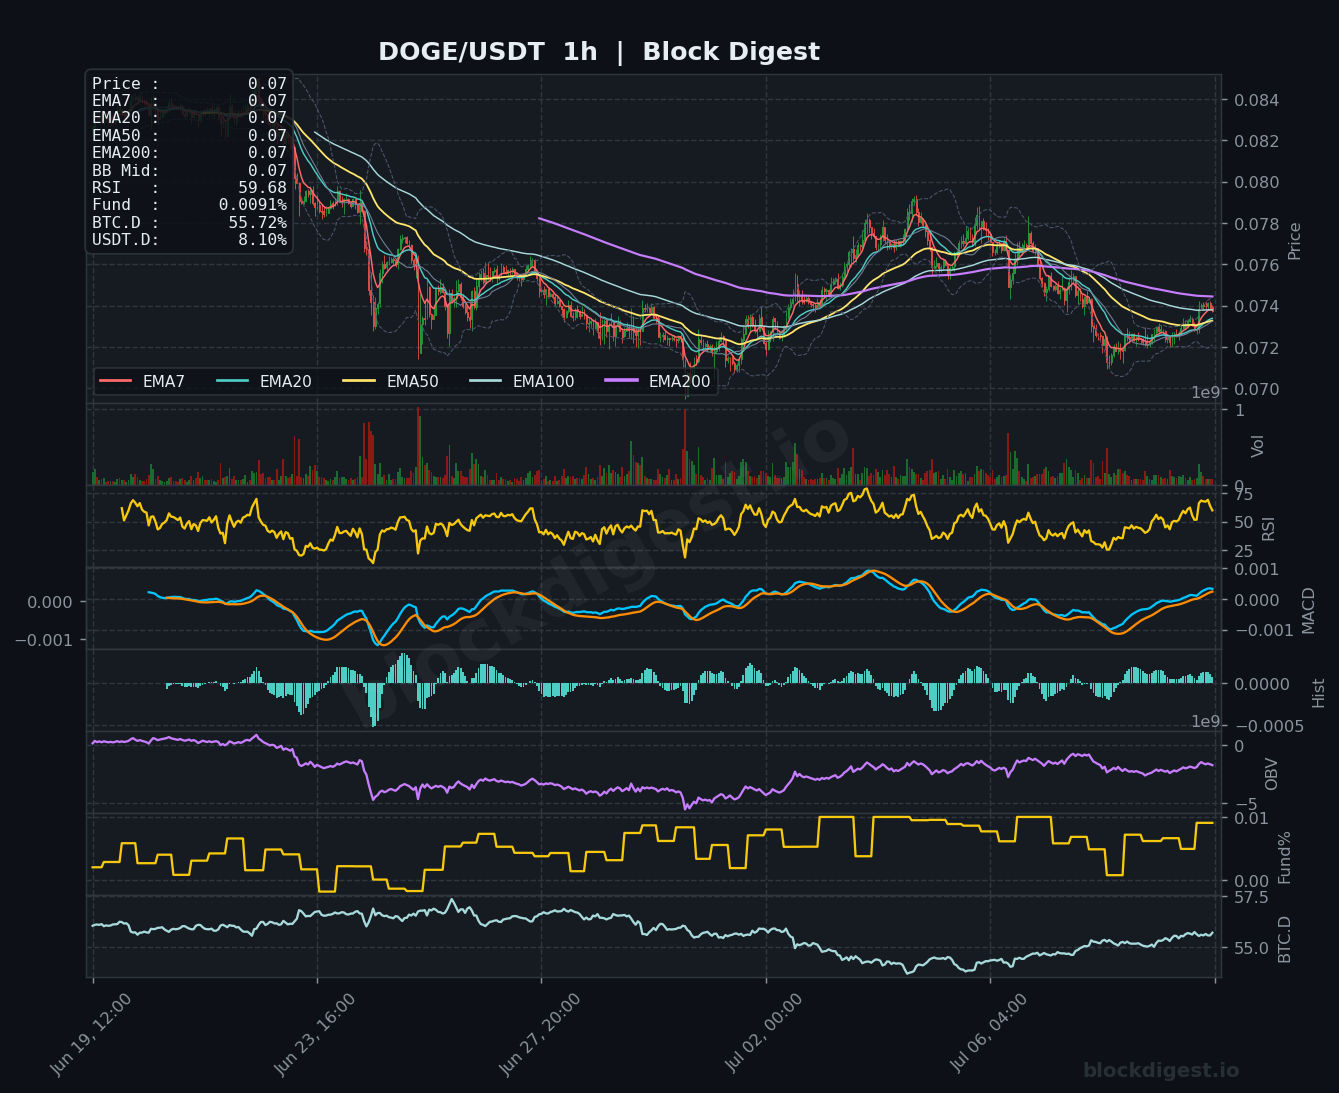
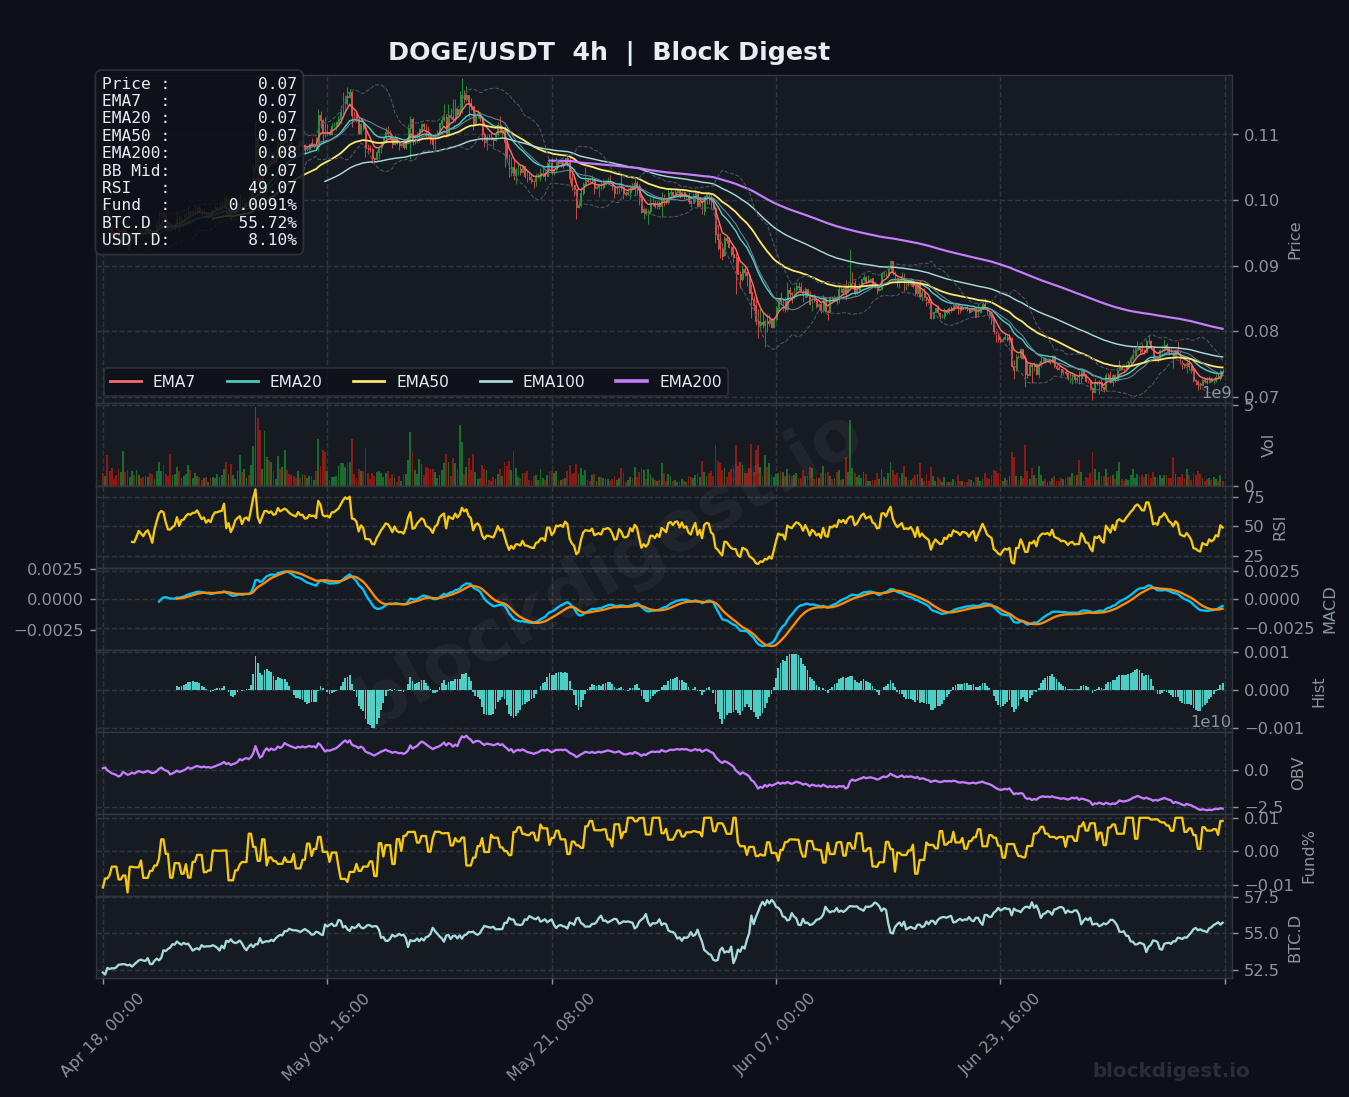
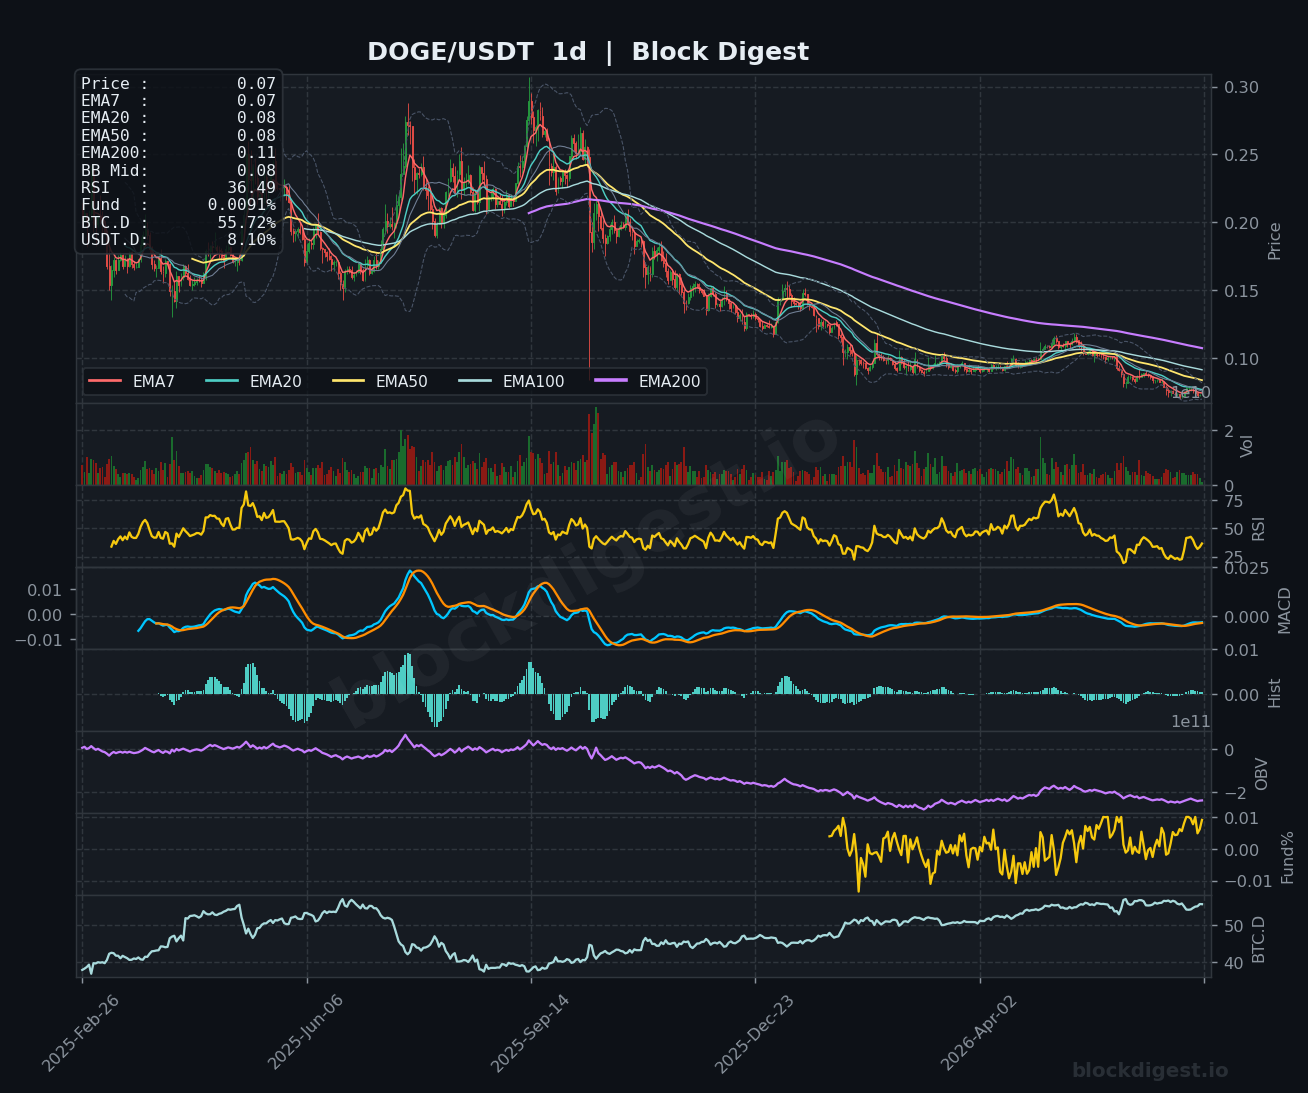
DOGE is trading at $0.0739, struggling to gain traction after a prolonged decline from the $0.25–$0.28 range earlier in the cycle. The 1h RSI at 59.68 and a slightly positive MACD suggest modest short-term buying interest, but price remains below all major EMAs on the daily chart (EMA20 at $0.08, EMA50 at $0.08, EMA200 at $0.11), reflecting deeply entrenched bearish structure. Daily RSI at 36.49 is approaching oversold territory but has not yet triggered a meaningful bounce, and the daily OBV continues to trend downward — confirming that selling volume remains dominant on higher timeframes. Near-term resistance sits firmly at $0.076–$0.078; the $0.070–$0.072 zone must hold as support to prevent a deeper slide toward the $0.065 region.
Litecoin (LTC)
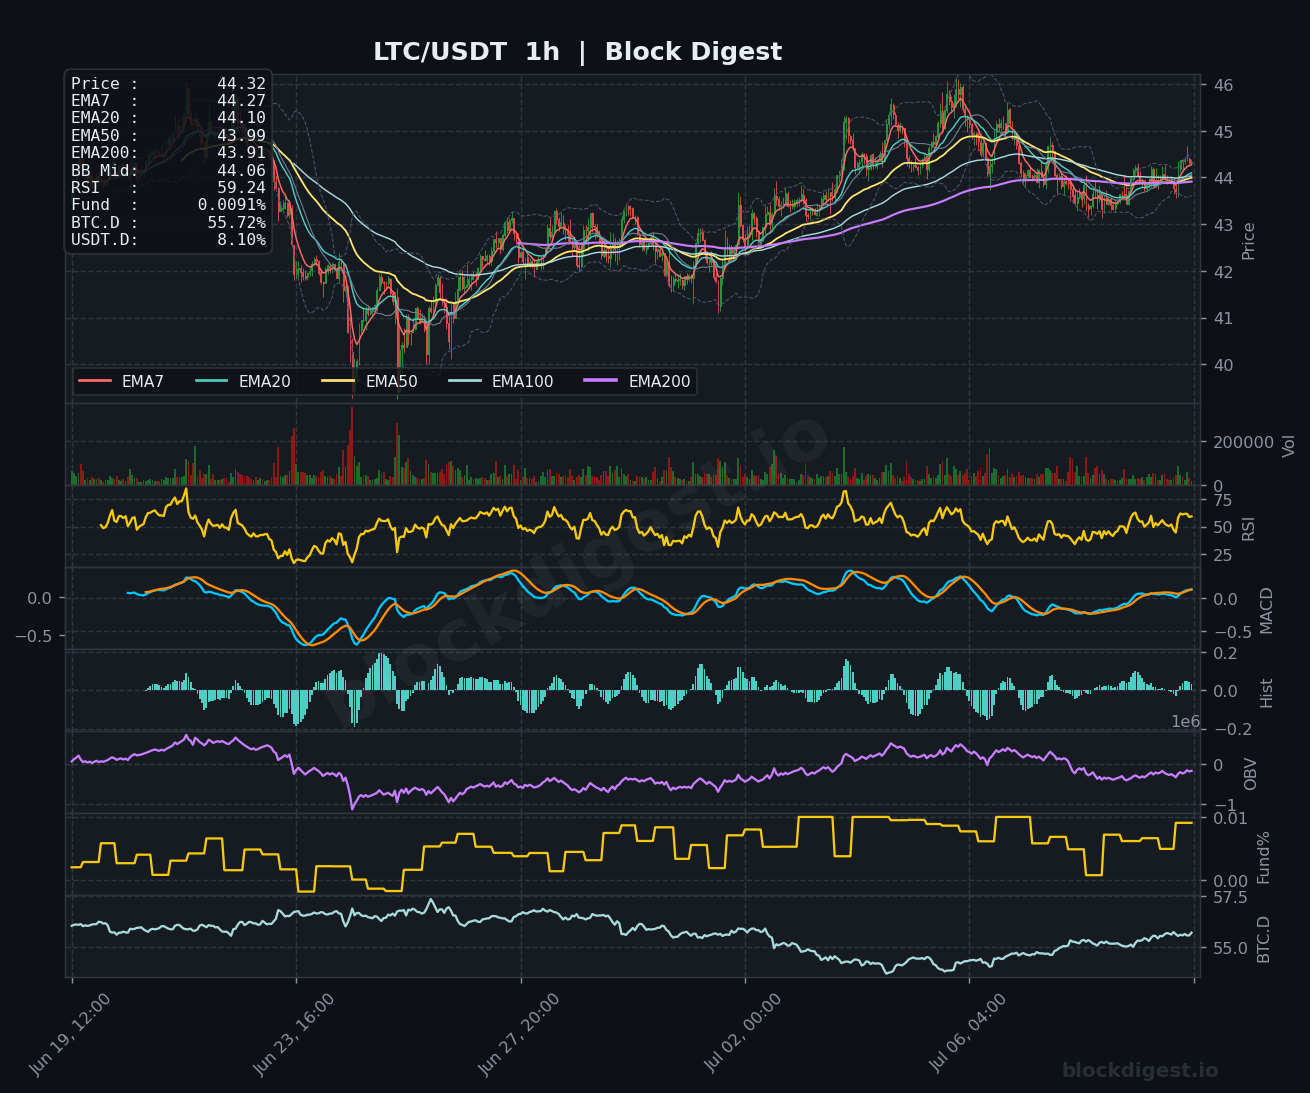
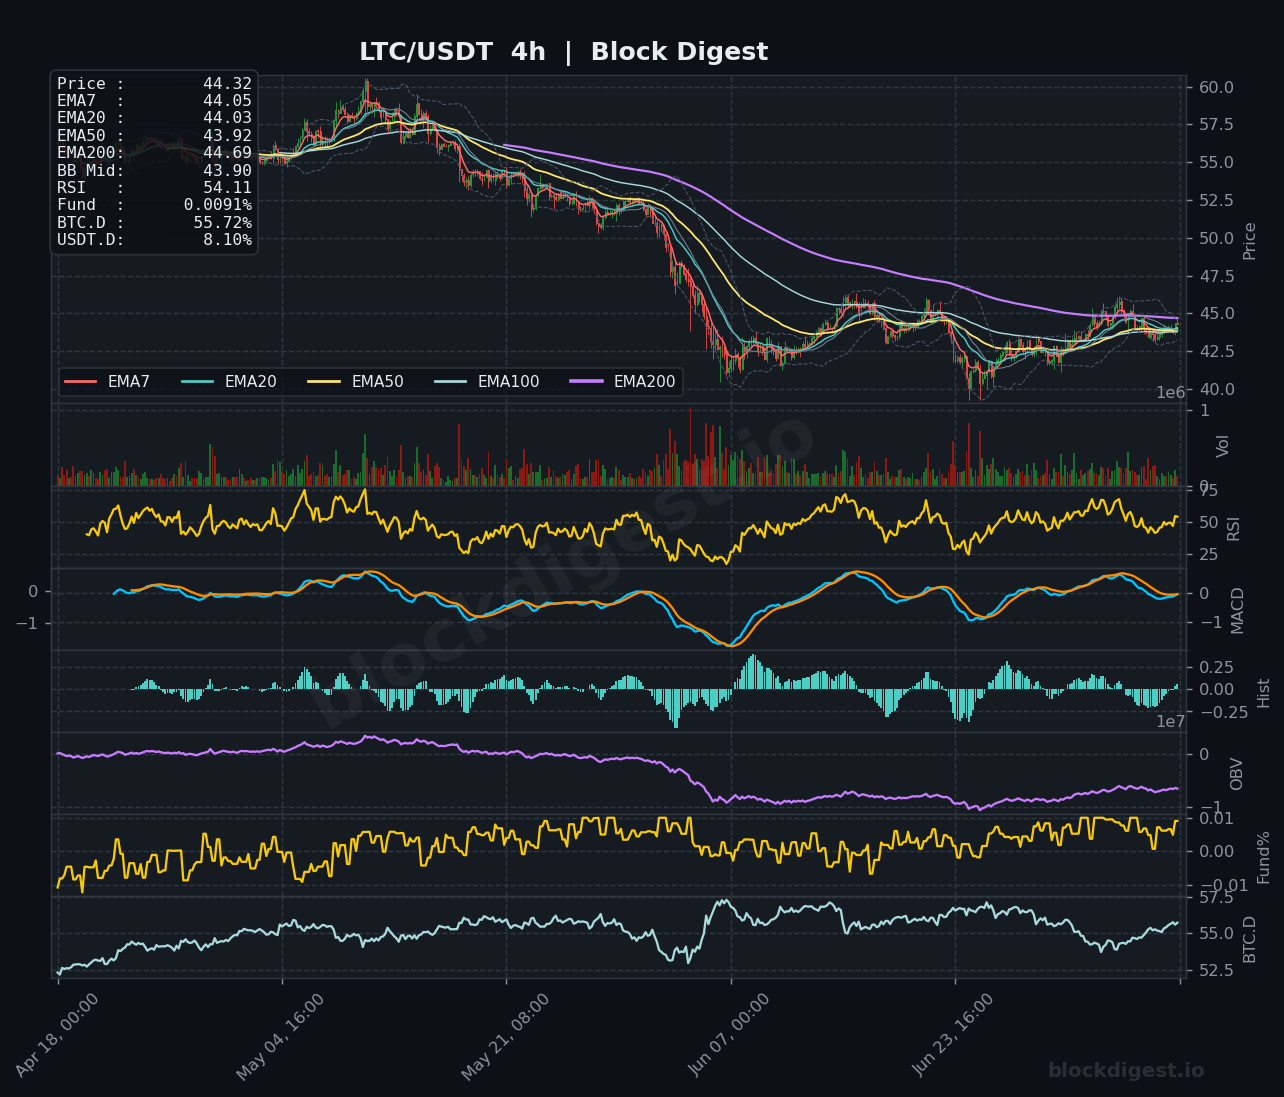
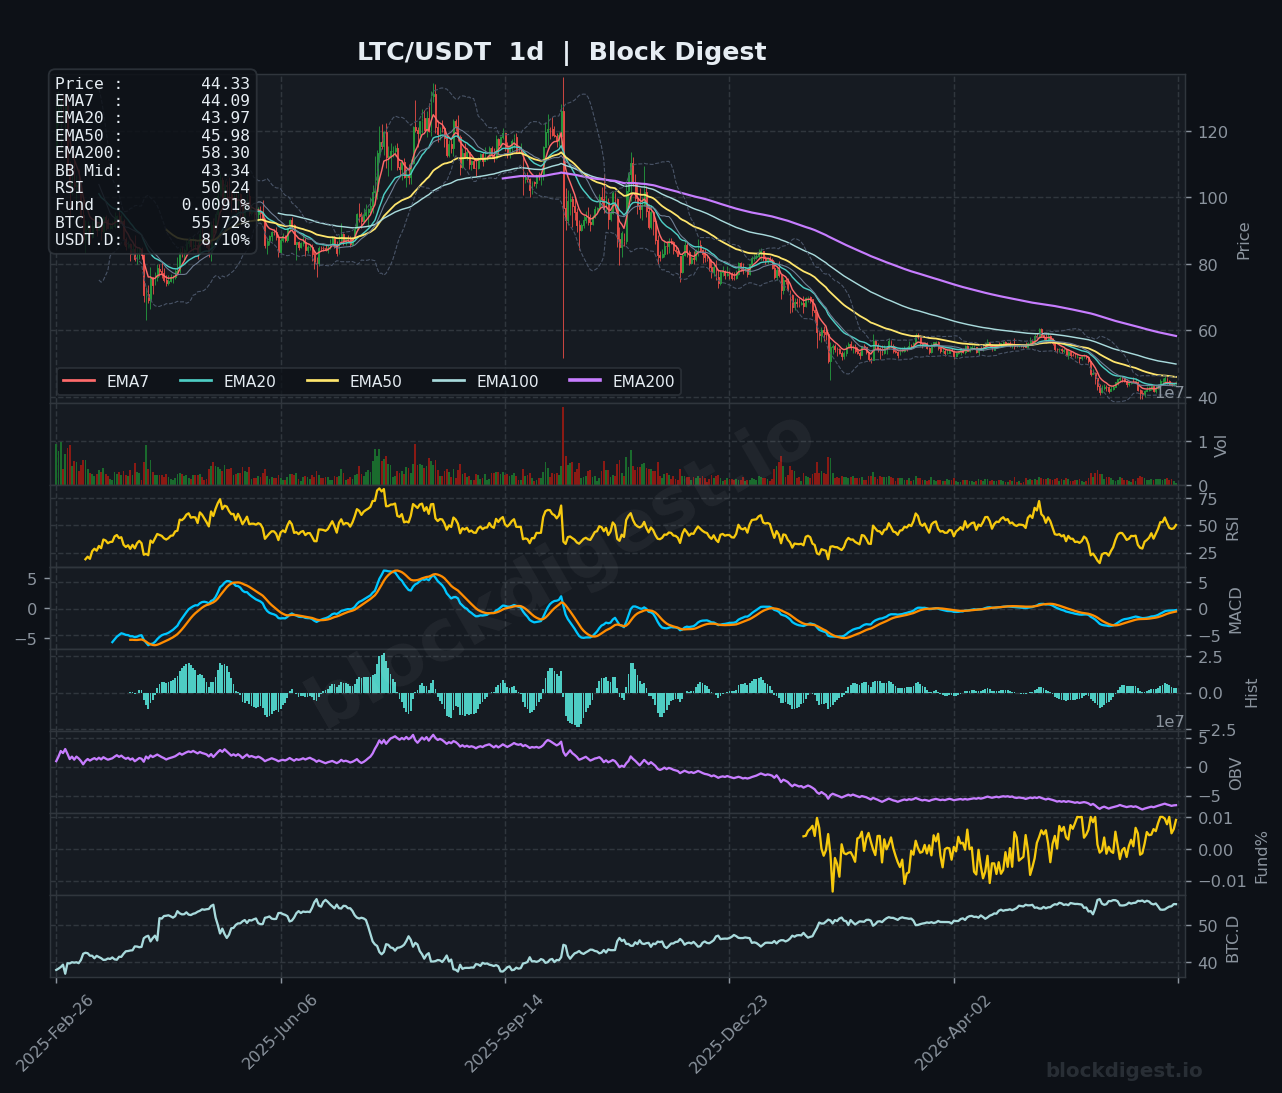
LTC is trading at $44.32, showing one of the more resilient near-term setups among the coins reviewed today, with the 1h EMA stack in a bullish alignment (EMA7 $44.27 > EMA20 $44.10 > EMA50 $43.99 > EMA200 $43.91) and RSI at 59.24 suggesting solid short-term momentum. On the 4h chart, RSI reads 54.11 and the MACD is creeping above zero following a sustained period of negative readings, while OBV has flattened and begun to turn higher — a tentative but encouraging shift. The daily chart shows RSI at an even 50.24, placing LTC at a pivot point; price is above the daily EMA7 ($44.09) and EMA20 ($43.97) but still trailing the EMA50 ($45.98) and far below the EMA200 ($58.30), capping the macro upside. Traders should watch the $45.50–$46.00 resistance zone, with $42.50–$43.00 representing near-term structural support.
TRON (TRX)
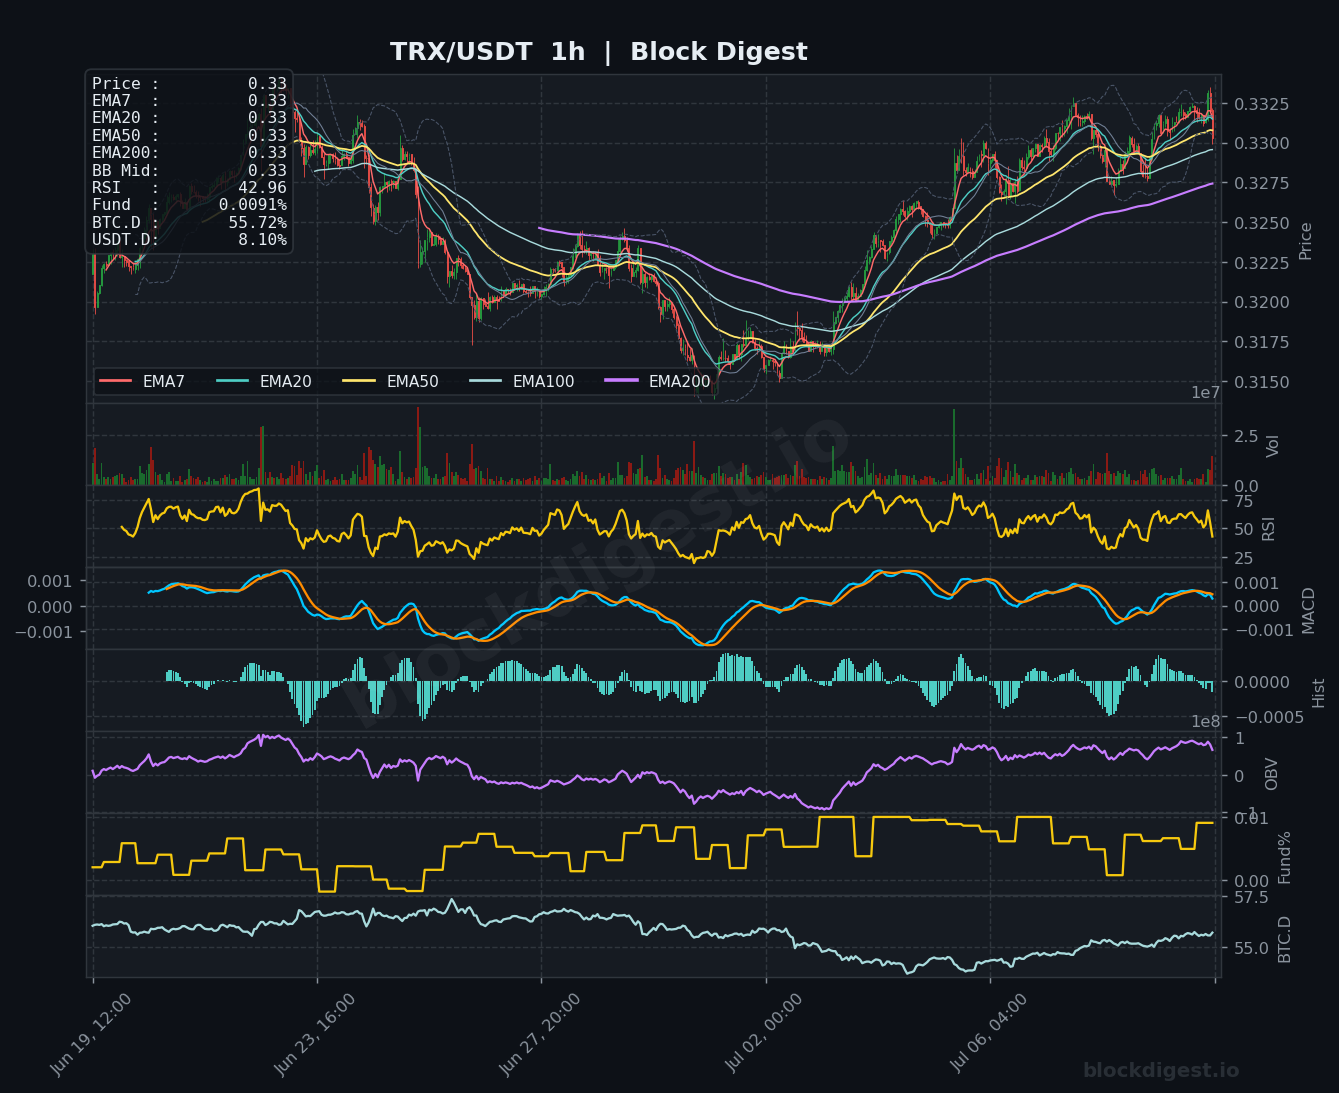
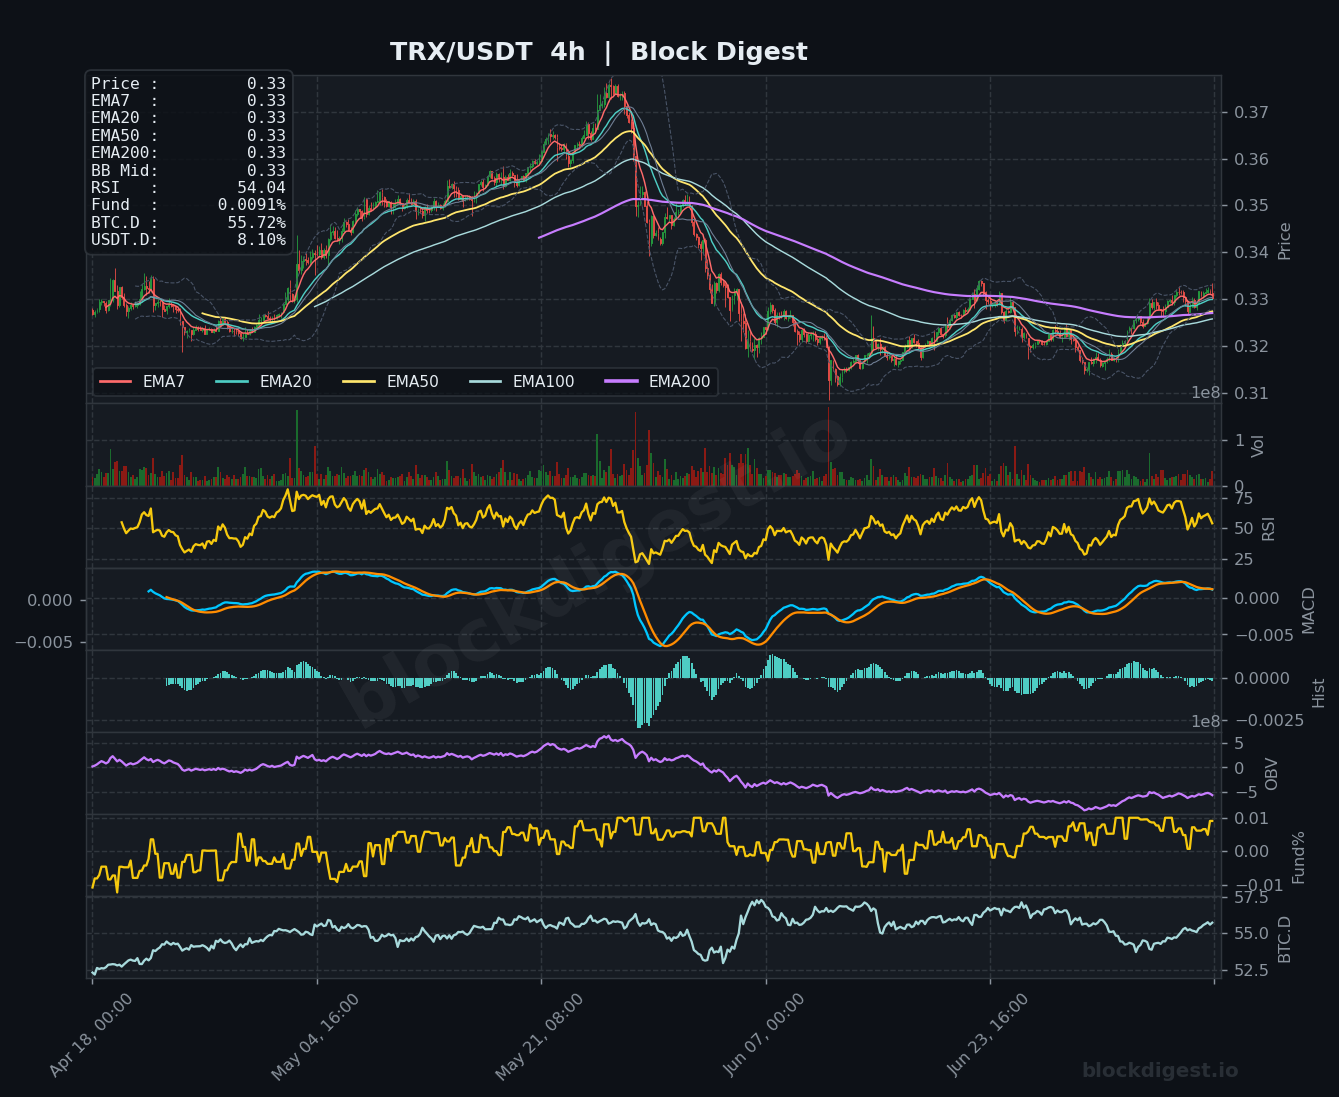
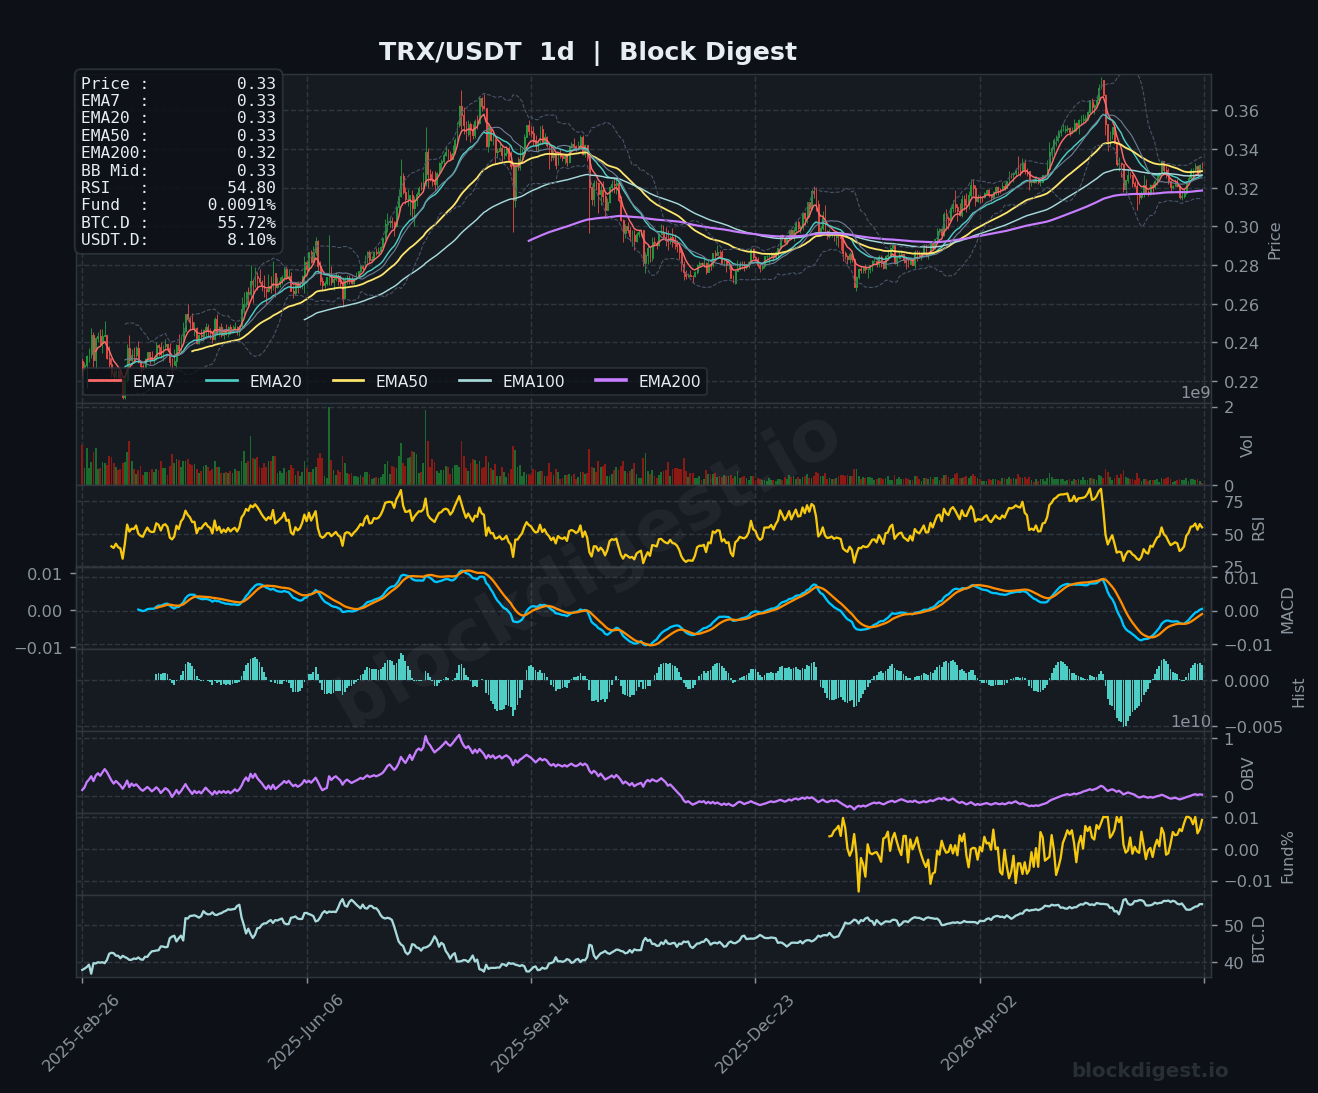
TRX is trading at $0.33, standing out as one of the relative strength stories in this group — the daily chart shows price above the EMA200 ($0.32), unlike most of its peers, and the daily RSI at 54.80 is in comfortably neutral-to-bullish territory. On the 1h chart, all EMAs are clustered at $0.33 with RSI at 42.96, suggesting a minor short-term pullback within the broader context of a recovery from lows near $0.315; the 4h MACD is hovering just above zero with a slightly positive histogram. OBV on the daily chart has been broadly stabilizing after a sustained decline, and the fact that TRX has retested and held the $0.32–$0.325 zone multiple times suggests structural demand at current levels. Key resistance sits at $0.335–$0.340; a breakout above that range could see TRX test $0.350+, while a drop below $0.320 would be a bearish signal.
Altcoin Outlook
The overall altcoin setup as of July 10, 2026 reflects a market in the early stages of a tentative recovery that has yet to earn full conviction — most assets remain significantly below their macro EMAs, and USDT dominance at 8.10% indicates that dry powder is still waiting for clearer signals. Among the six coins reviewed, TRX and LTC display the strongest relative technical setups, with LTC showing bullish short-term EMA alignment and TRX notably trading above its daily EMA200 — a distinction no other coin in this group can claim. DOGE and XRP present the weakest structural pictures, with both mired in sustained downtrends on the daily timeframe and declining OBV confirming continued distribution. The passage of the Crypto Clarity Act and sustained spot BTC ETF inflows would be the most significant catalysts to watch; until BTC dominance meaningfully rolls over from 55.70%, altcoins are likely to remain in a rangebound-to-mildly-bullish grind rather than a broad-based breakout rally.
Disclaimer: This analysis is for informational purposes only and does not constitute financial advice. Cryptocurrency markets are highly volatile and unpredictable. All trading decisions should be made based on your own research and risk tolerance. Block Digest is not responsible for any financial losses incurred as a result of acting on this content.
Stay Ahead of the Market
Follow BlockDigest for crypto market intelligence, research and real-time updates.


