Altcoin Daily Analysis — May 11, 2026
Altcoin Daily Roundup – May 11, 2026
Market Context
The altcoin market is displaying mixed momentum as Bitcoin dominance hovers at 54.50%, maintaining a relatively neutral stance that neither significantly favors nor pressures altcoins. USDT dominance at 6.83% suggests moderate risk appetite in the crypto market, indicating that capital is being deployed into risk assets but without extreme euphoria. The broader altcoin landscape shows varying levels of strength, with several major tokens consolidating near key technical levels while others demonstrate clear directional bias.
Solana (SOL)
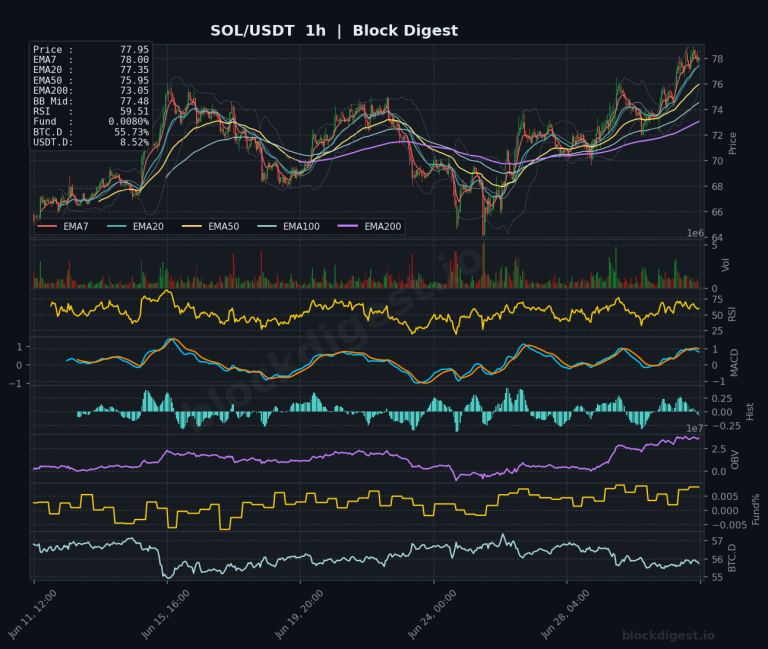
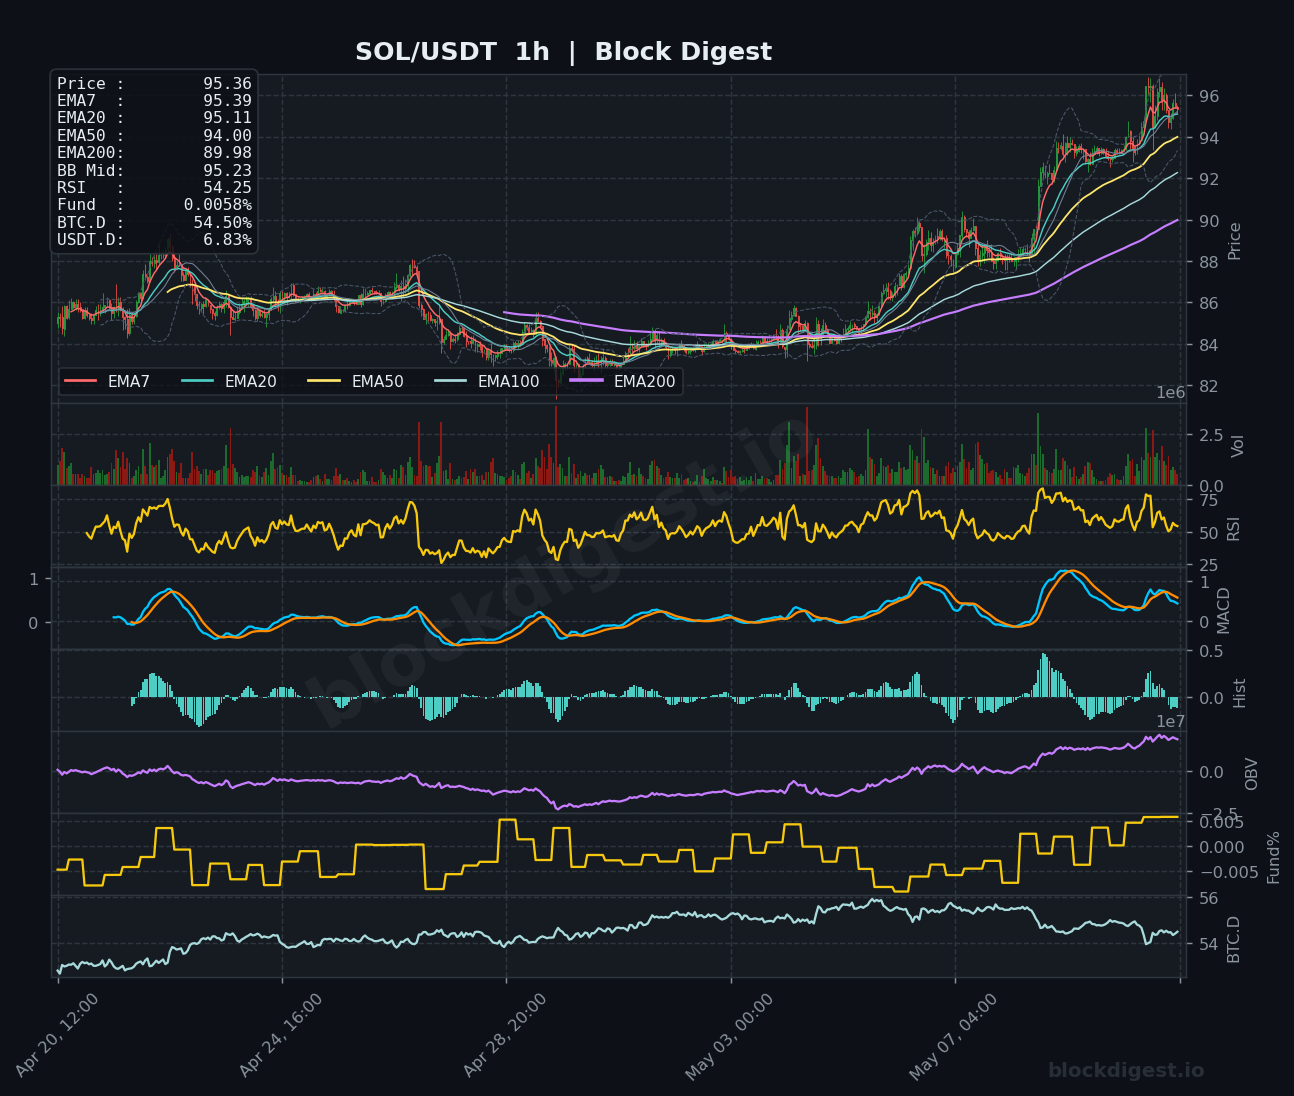
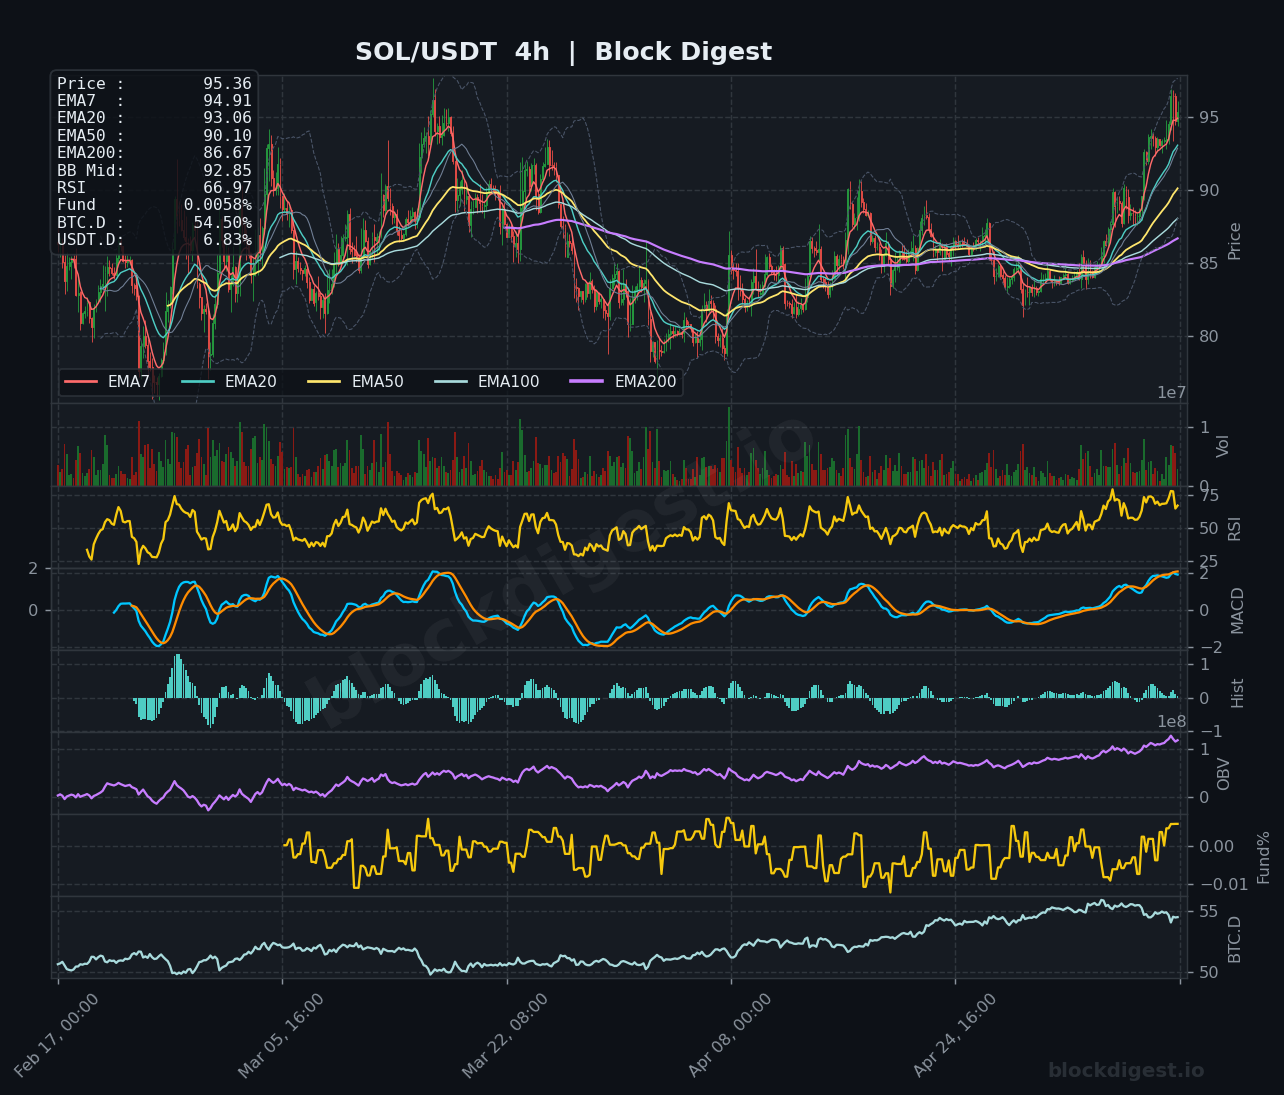
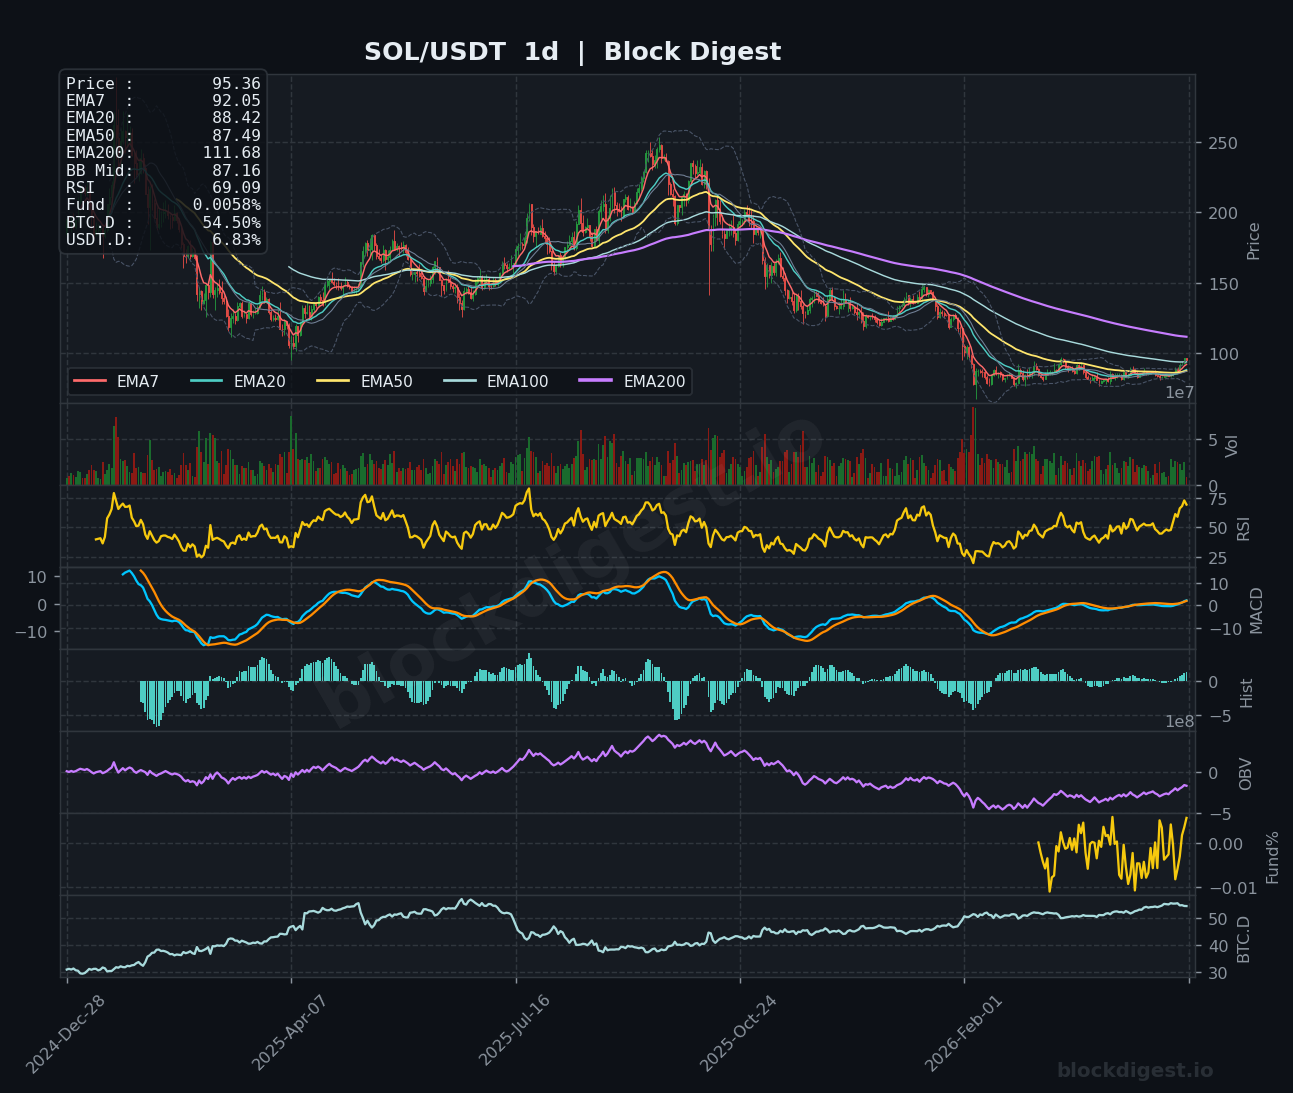
Solana is trading at $95.36, showing impressive bullish momentum across all timeframes with price firmly above its full moving average stack. The 1-hour chart displays strong upward pressure with the RSI at 54.25, indicating room for further gains before entering overbought territory. On the 4-hour timeframe, SOL exhibits a textbook bullish setup with RSI at 66.97 and MACD trending positively, while price recently broke above the $93-94 resistance zone. The daily chart reveals a significant recovery from previous lows, with SOL now trading above all major moving averages and RSI at 69.09, though approaching overbought levels that may trigger short-term consolidation. Key resistance lies at $96-97, with immediate support established at $92-93, and the short-term bias remains decidedly bullish as long as SOL holds above the $90 psychological level.
XRP (XRP)
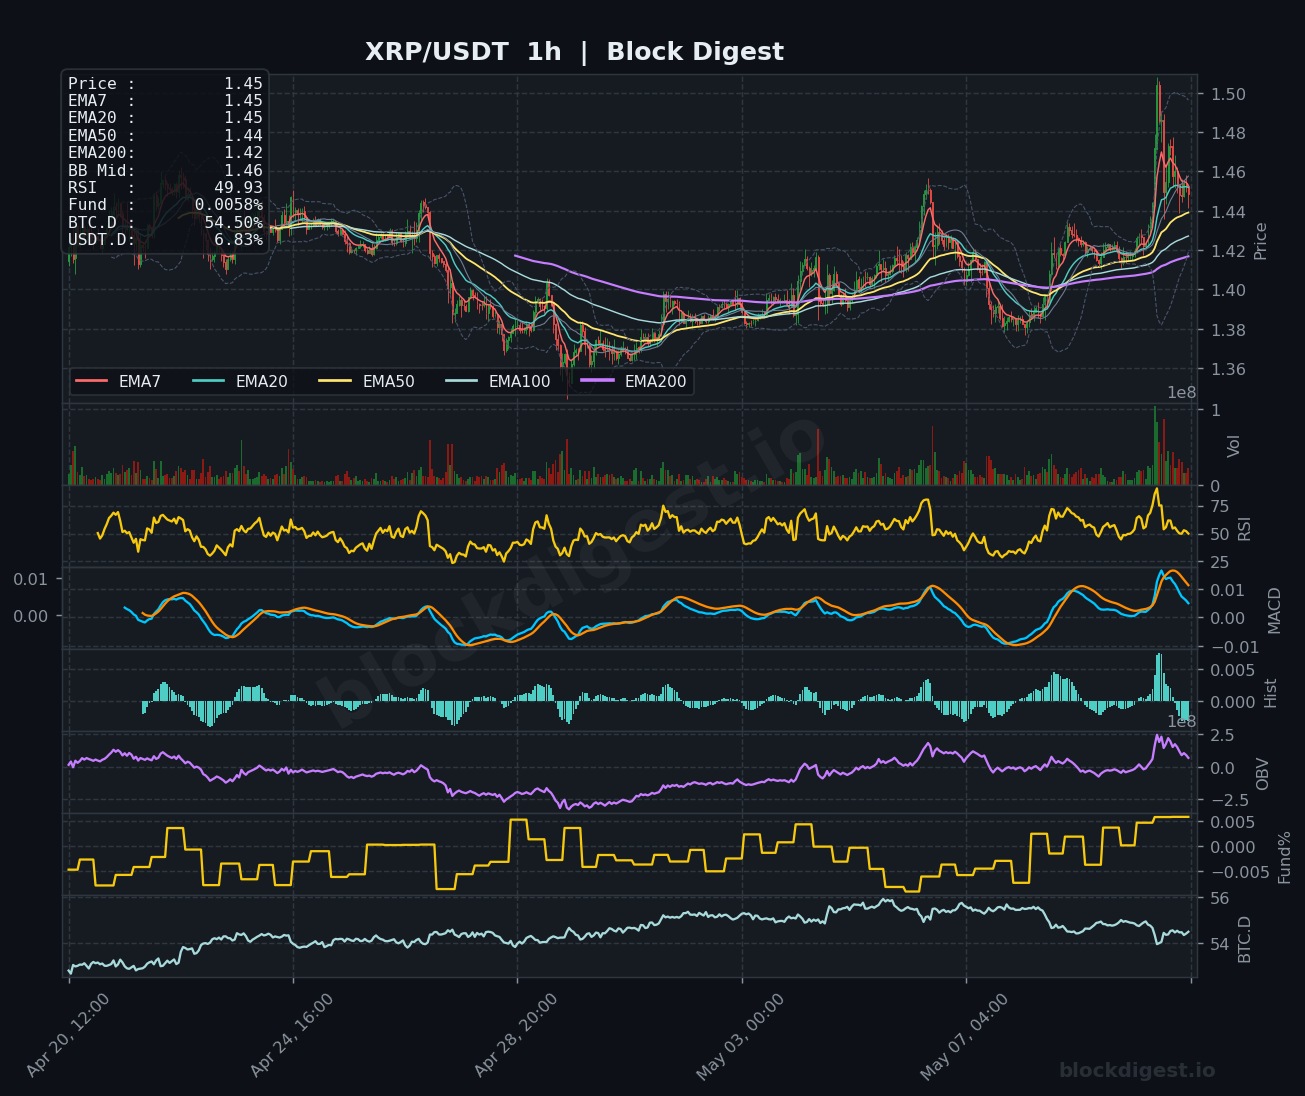
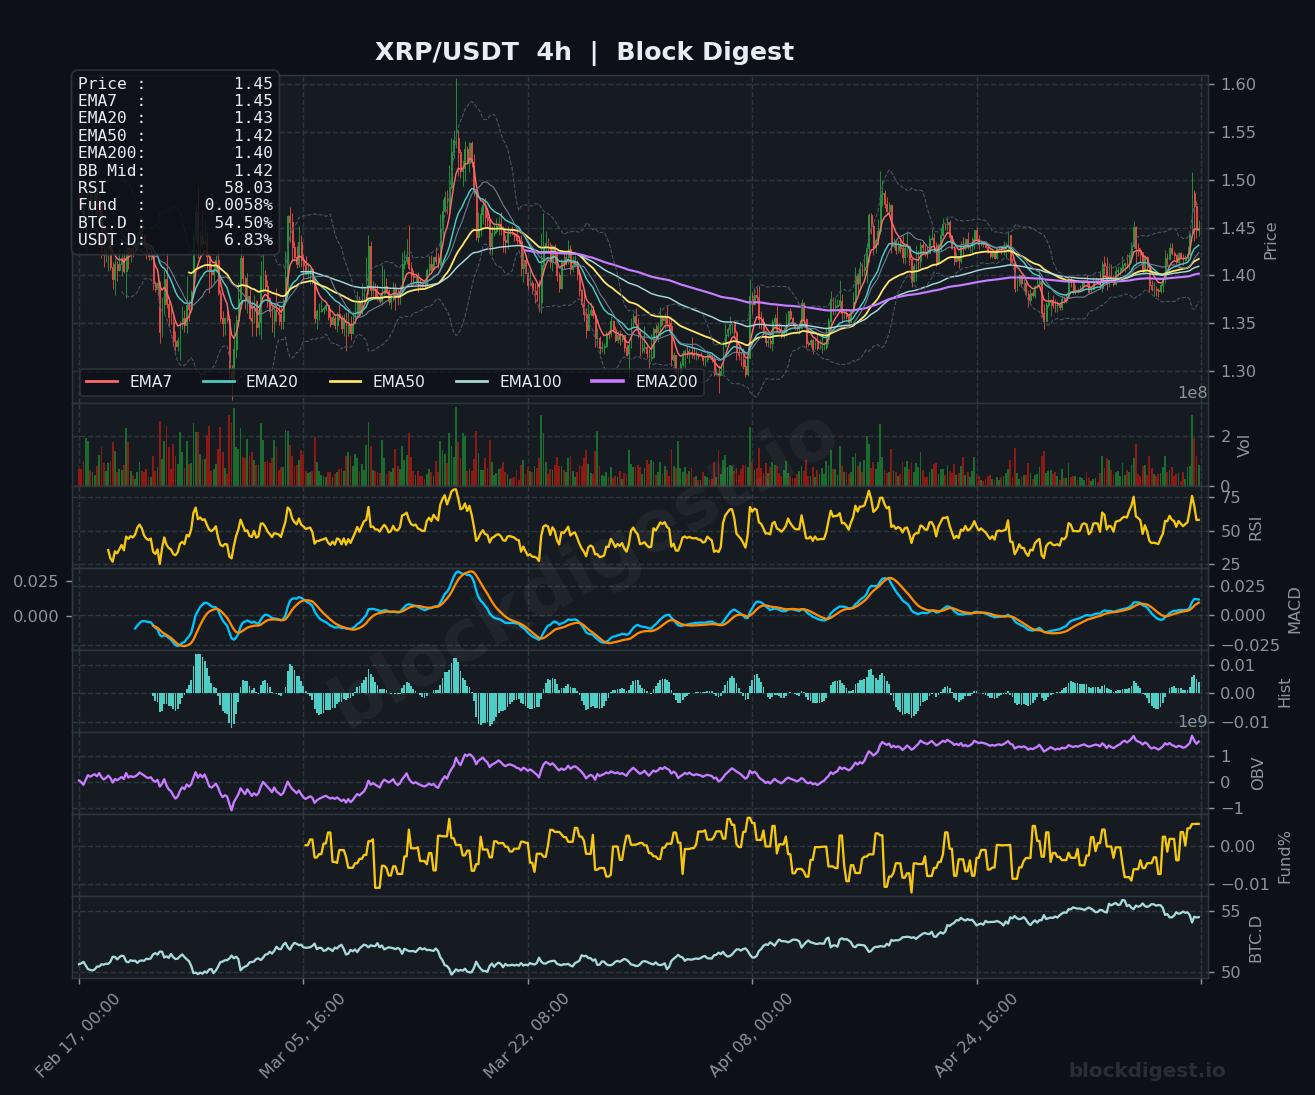
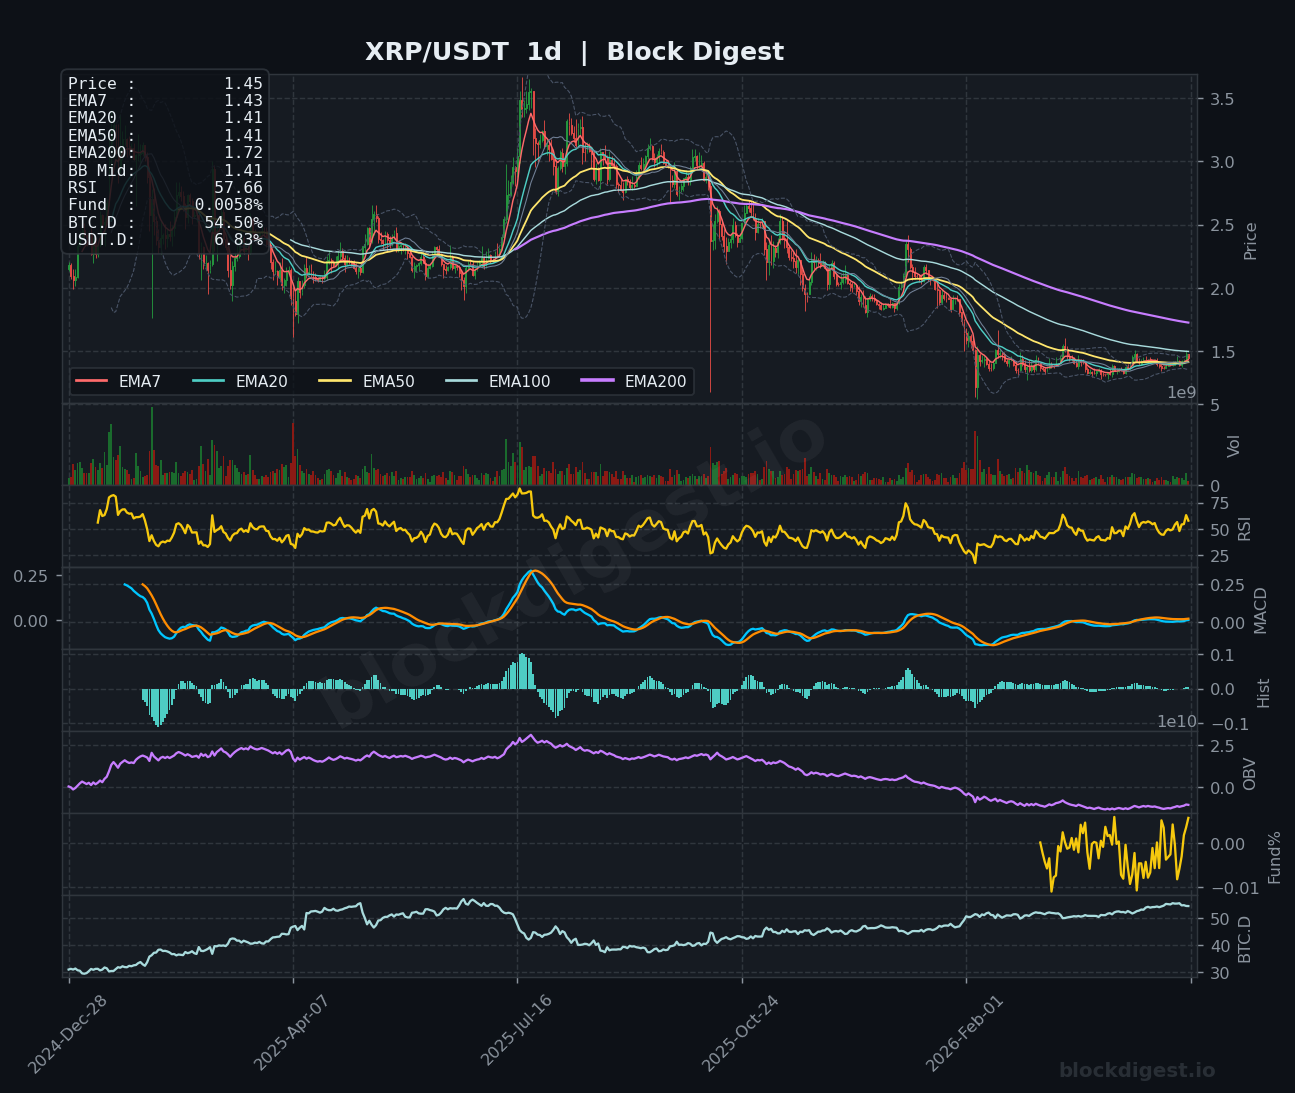
XRP is currently priced at $1.45, displaying neutral to slightly bullish characteristics with price action consolidating in a tight range. The 1-hour chart shows price hovering at the $1.45 level with RSI at 49.93, suggesting equilibrium between buyers and sellers with limited directional conviction. The 4-hour perspective reveals XRP testing the upper boundary of its recent consolidation range around $1.45-1.46, with RSI at 58.03 indicating mild bullish pressure and MACD showing a potential positive crossover. On the daily timeframe, XRP appears to be forming a base above the $1.40 support level, with RSI at 57.66 and price trading above short-term moving averages but still below the EMA200 at $1.72, which represents a significant overhead resistance. The immediate bias is neutral-to-bullish, with a break above $1.48 likely to trigger further upside toward $1.55, while failure to hold $1.42 could lead to a retest of the $1.38 support zone.
BNB (BNB)
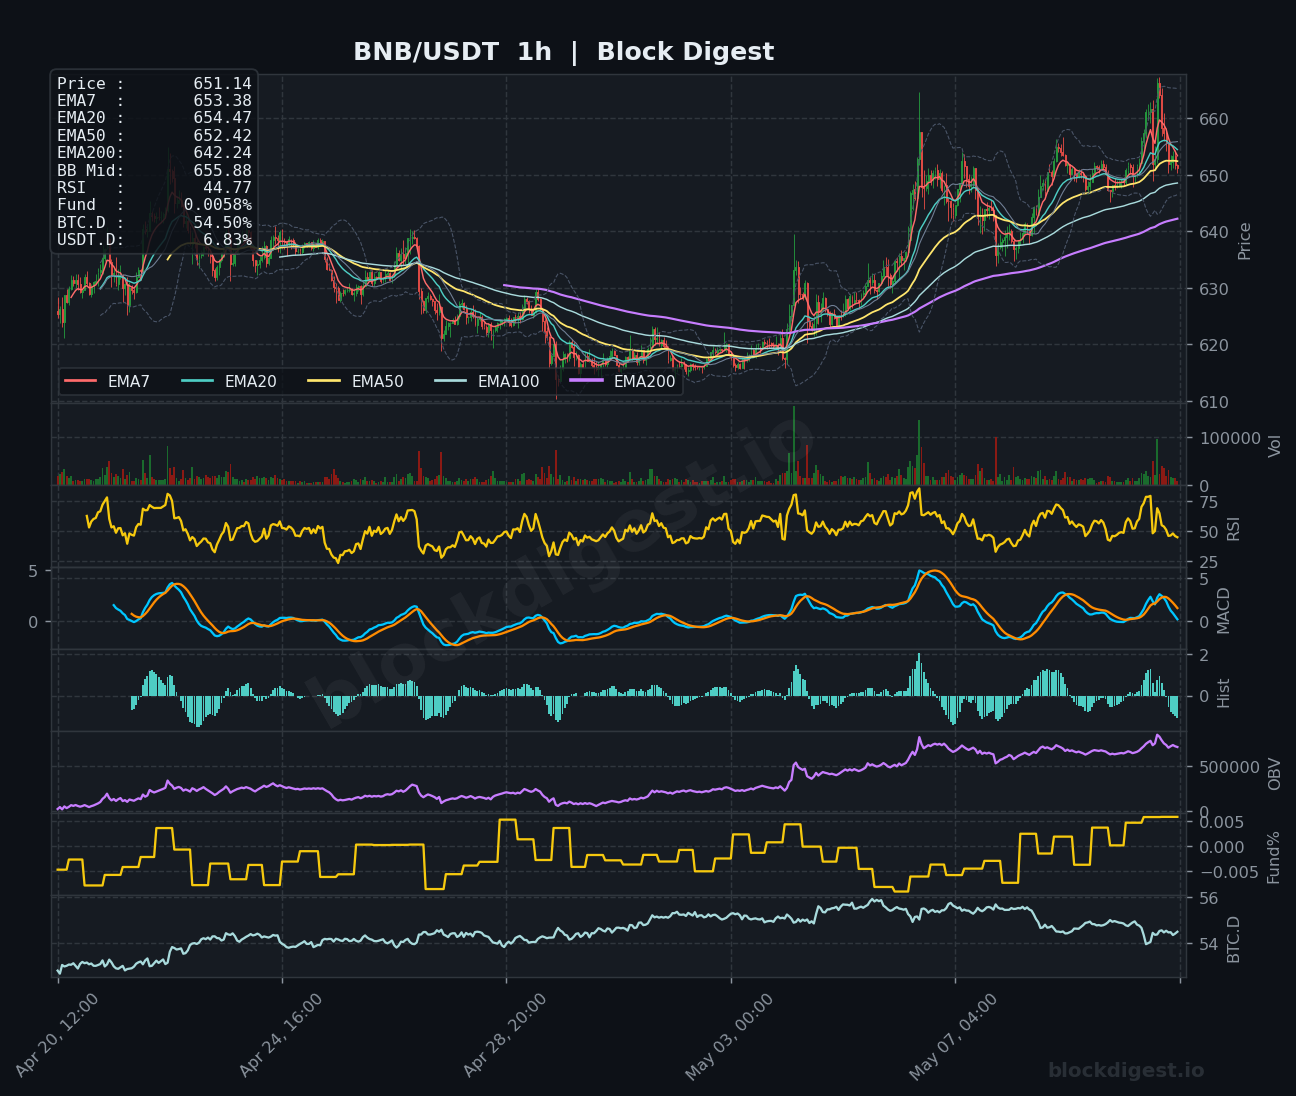
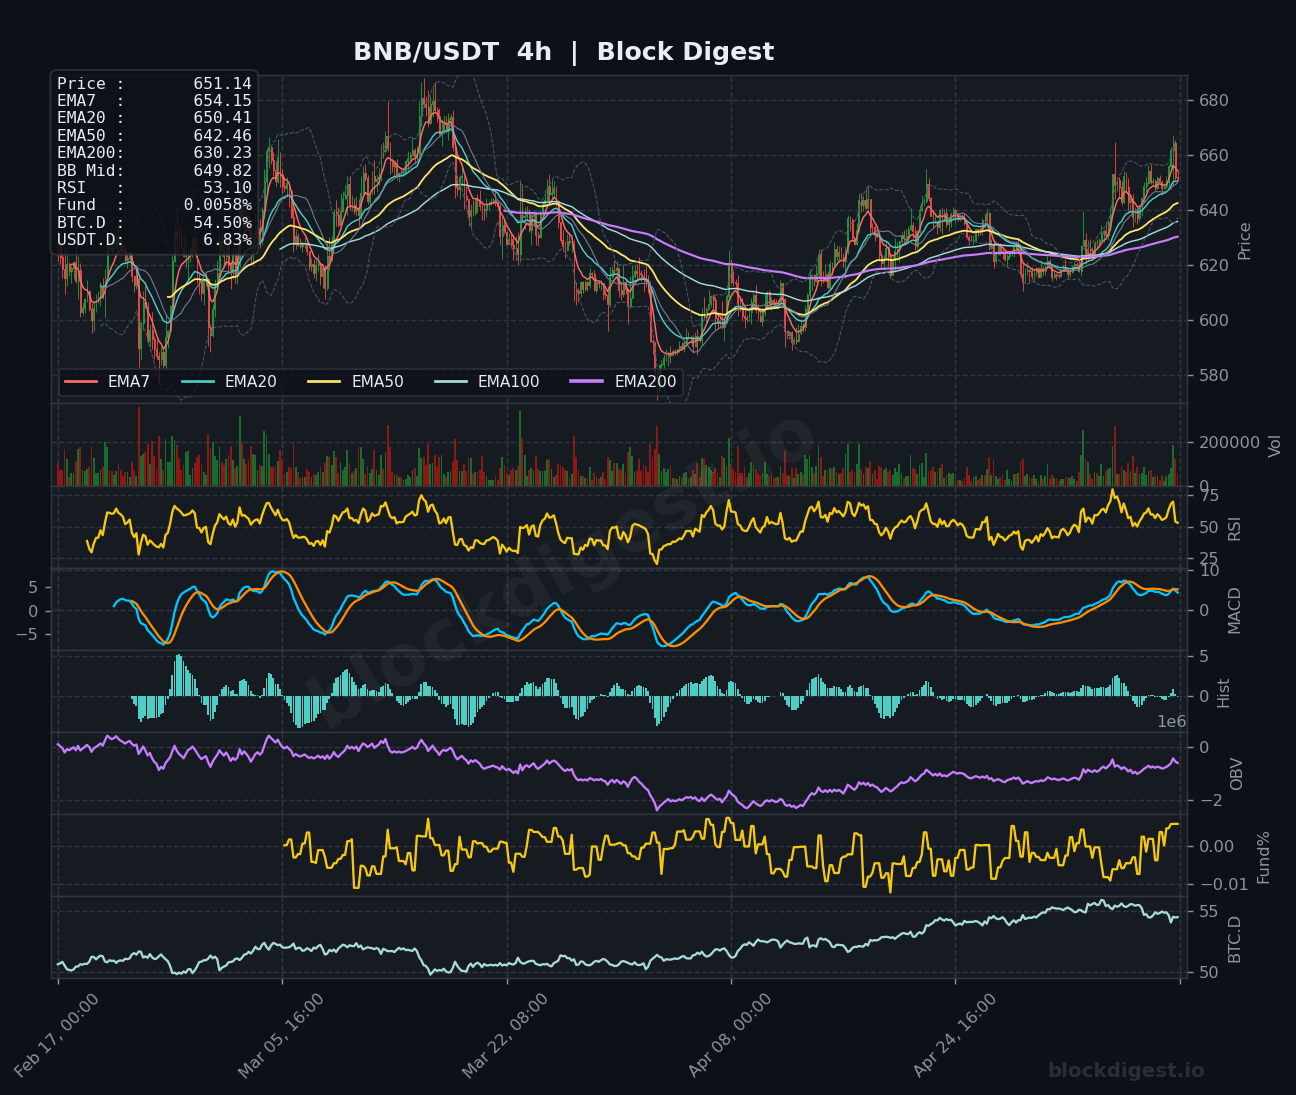
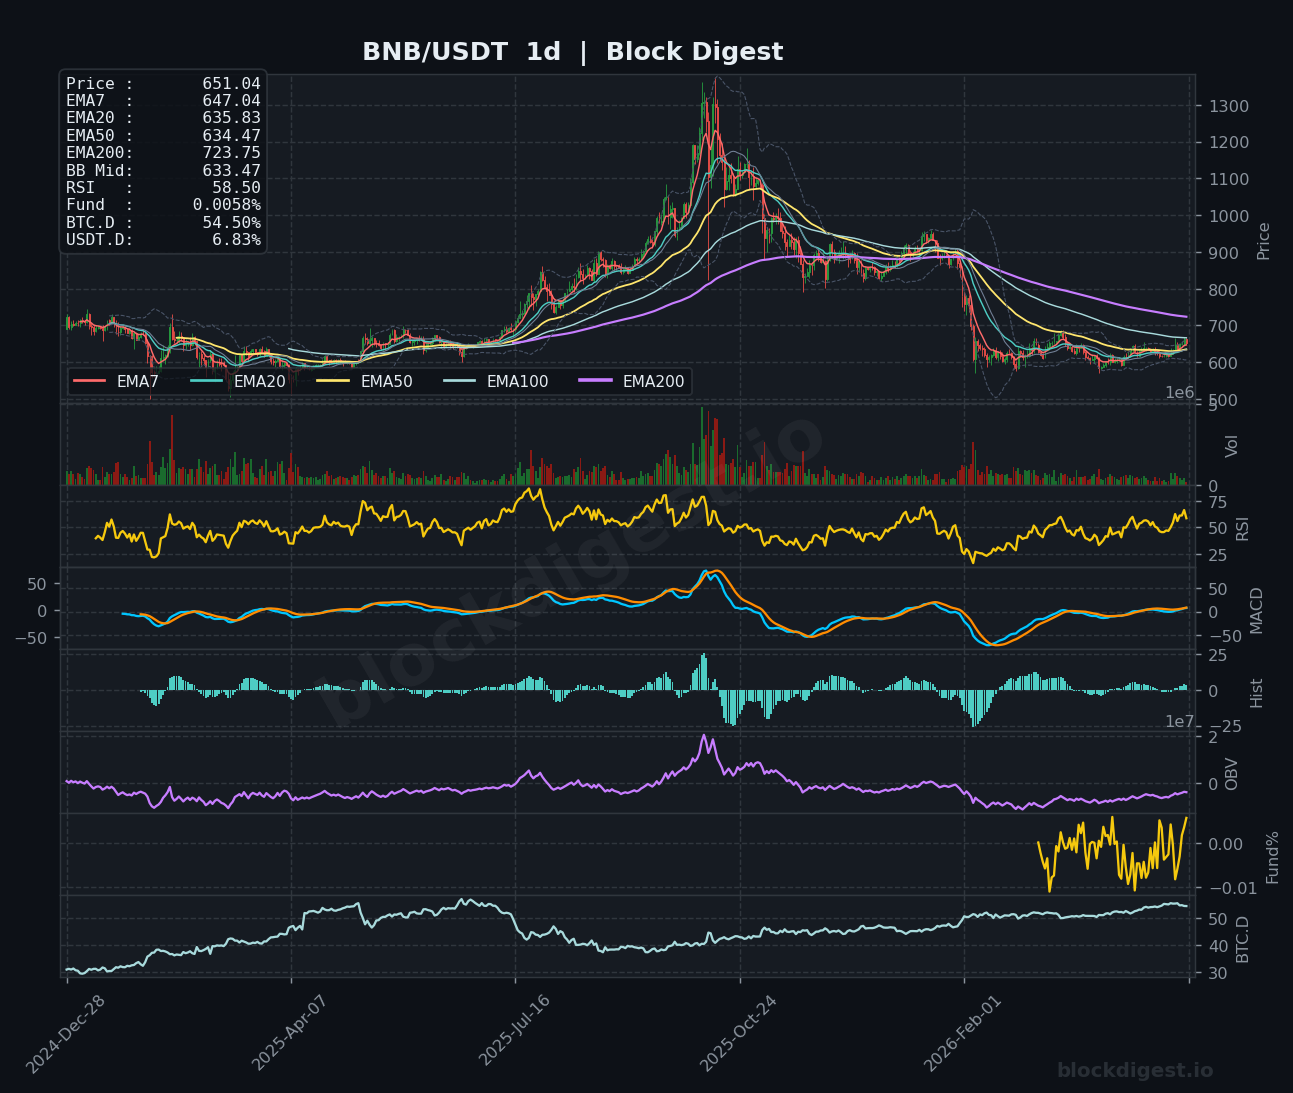
BNB is trading at $651.14, demonstrating choppy price action with signs of consolidation after recent volatility. The 1-hour chart shows BNB forming a tight range with RSI at 44.77, suggesting slight bearish pressure in the very short term with price struggling to maintain momentum above $655. The 4-hour timeframe reveals BNB oscillating around the $650 level with RSI at 53.10, indicating neutrality as bulls and bears battle for control near the psychologically important $650 mark. On the daily chart, BNB appears to be forming a rounding bottom pattern with RSI at 58.50, showing gradual accumulation despite trading well below its historical highs, with the EMA200 at $723.75 representing a major resistance barrier. Key support is established at $630-640, with resistance at $665-670, and the short-term bias remains neutral to slightly bullish, contingent on BNB’s ability to break and hold above $660 to confirm renewed upside momentum.
Dogecoin (DOGE)
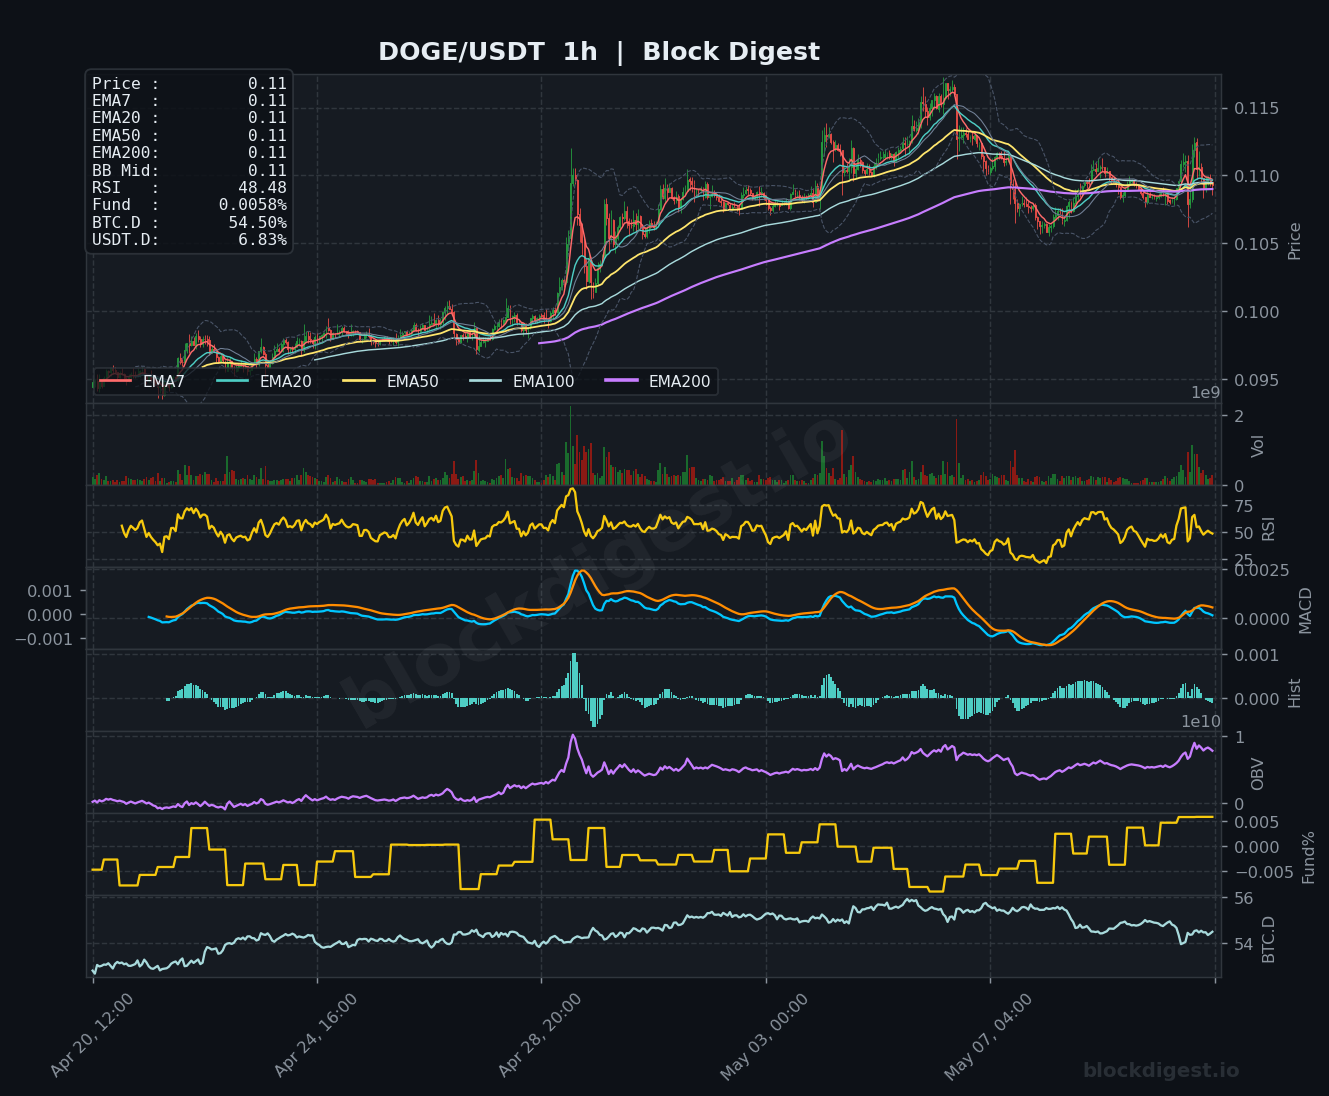
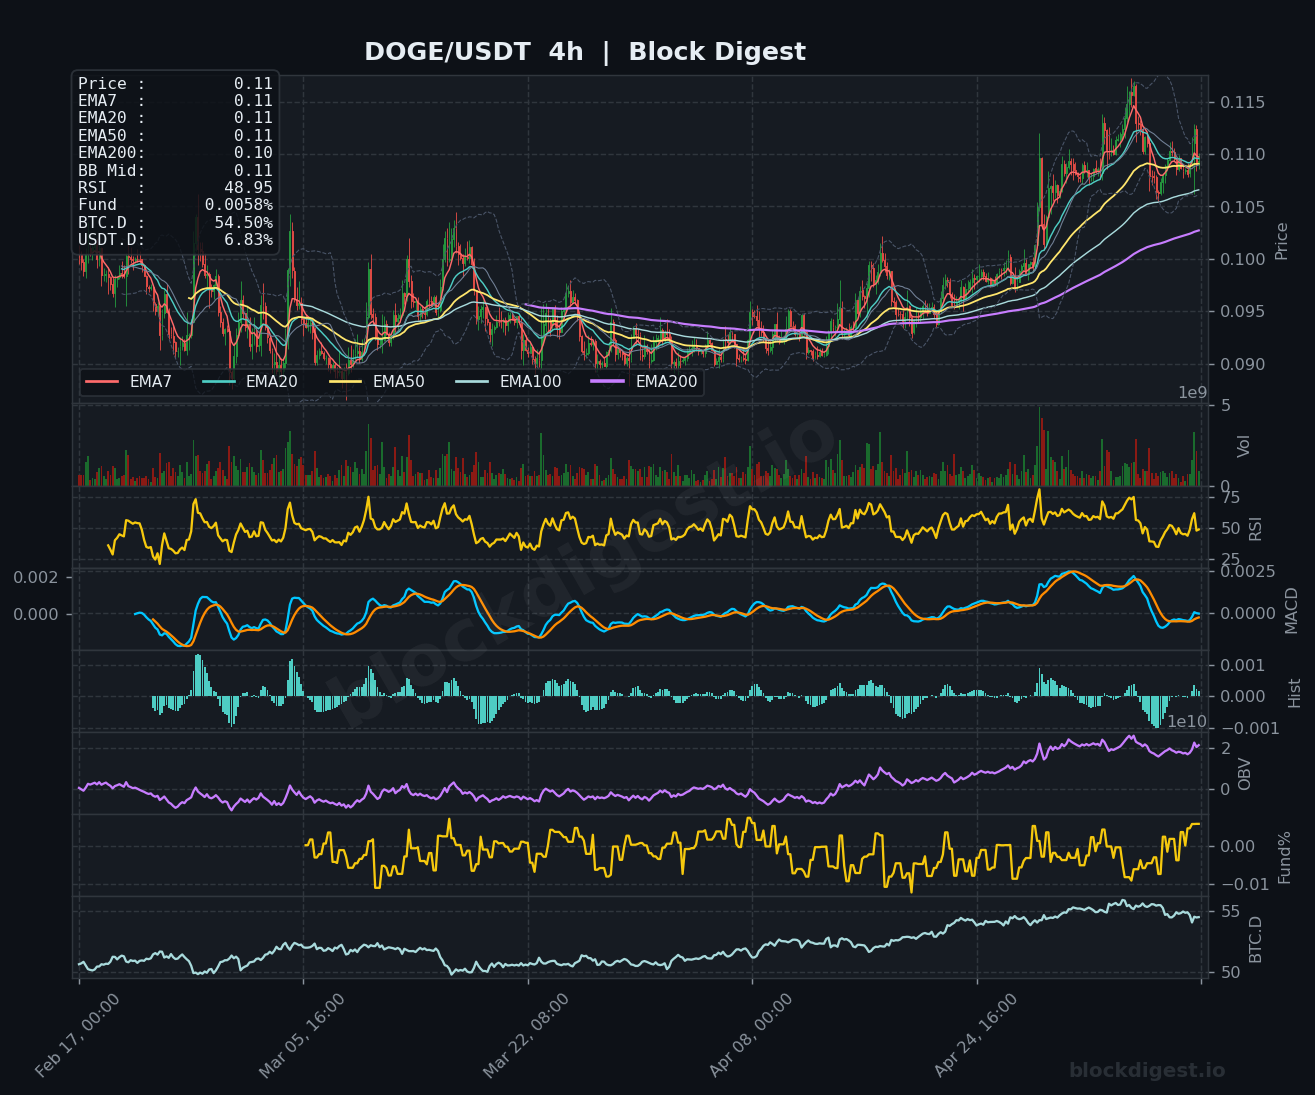
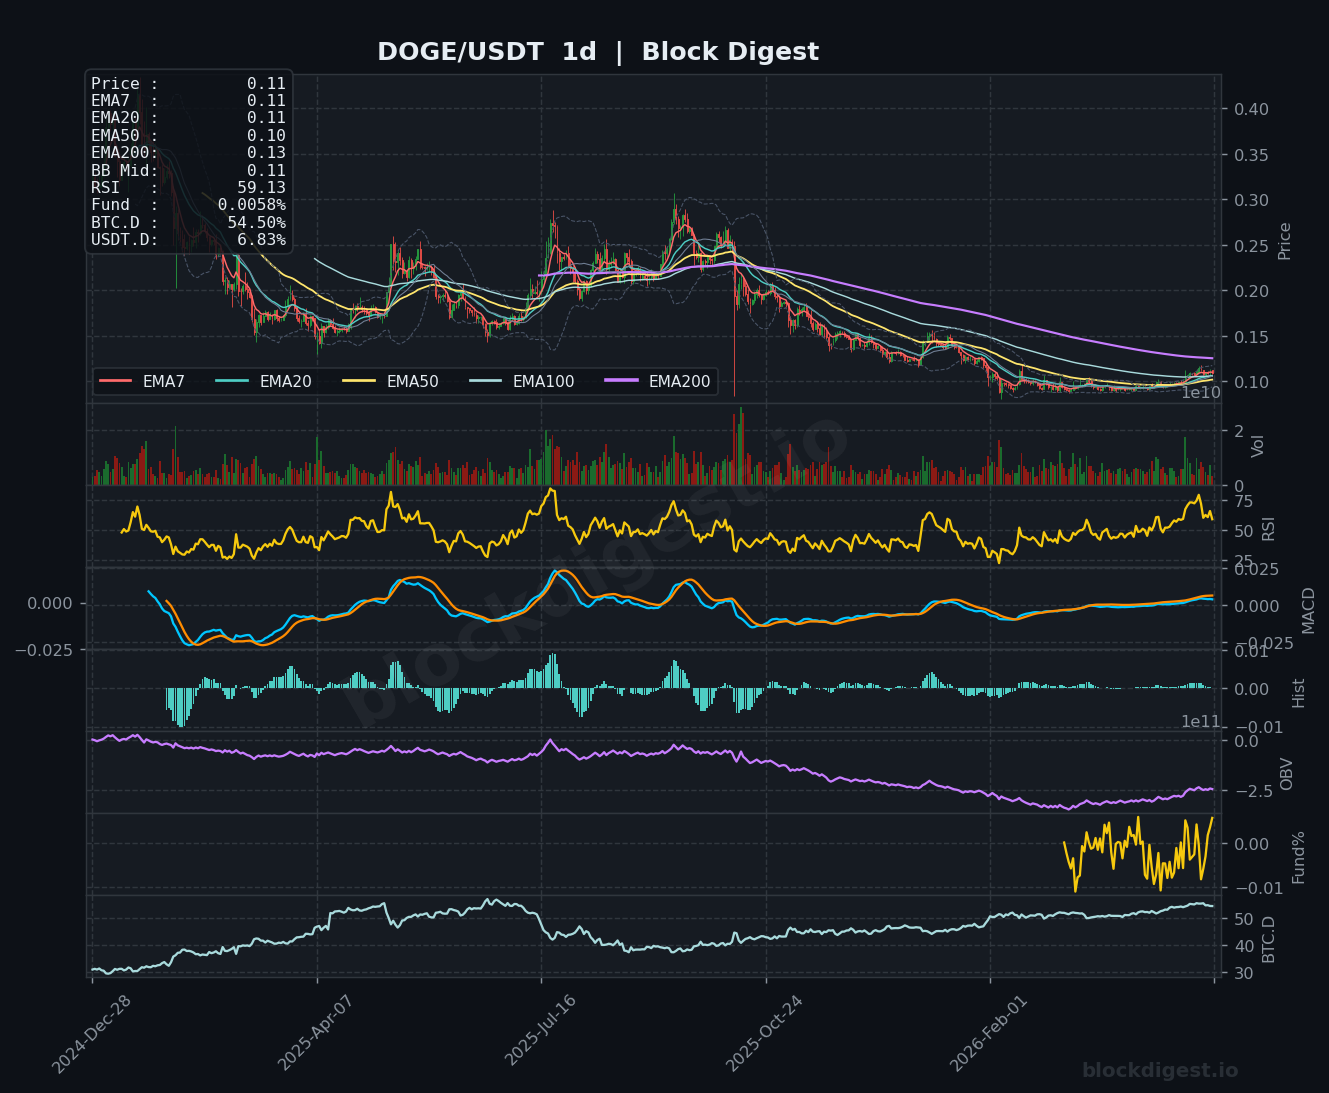
Dogecoin is currently priced at $0.11, exhibiting weak price action with bearish undertones across multiple timeframes. The 1-hour chart displays DOGE consolidating tightly around $0.11 with RSI at 48.48, showing neither strong buying nor selling pressure but with a slight defensive posture. The 4-hour perspective reveals DOGE struggling to maintain altitude, with RSI at 48.95 and MACD showing fading momentum, as price continues to test the psychological $0.11 level without conviction. The daily chart paints a concerning picture, with DOGE trading in a prolonged downtrend channel and RSI at 59.13, though price remains compressed in a narrow range between $0.10 and $0.11, suggesting accumulation or distribution is underway. Immediate support lies at $0.108-0.109, with resistance at $0.112-0.113, and the short-term bias leans neutral to slightly bearish unless DOGE can reclaim and hold above $0.115, which would signal a potential trend reversal.
Litecoin (LTC)
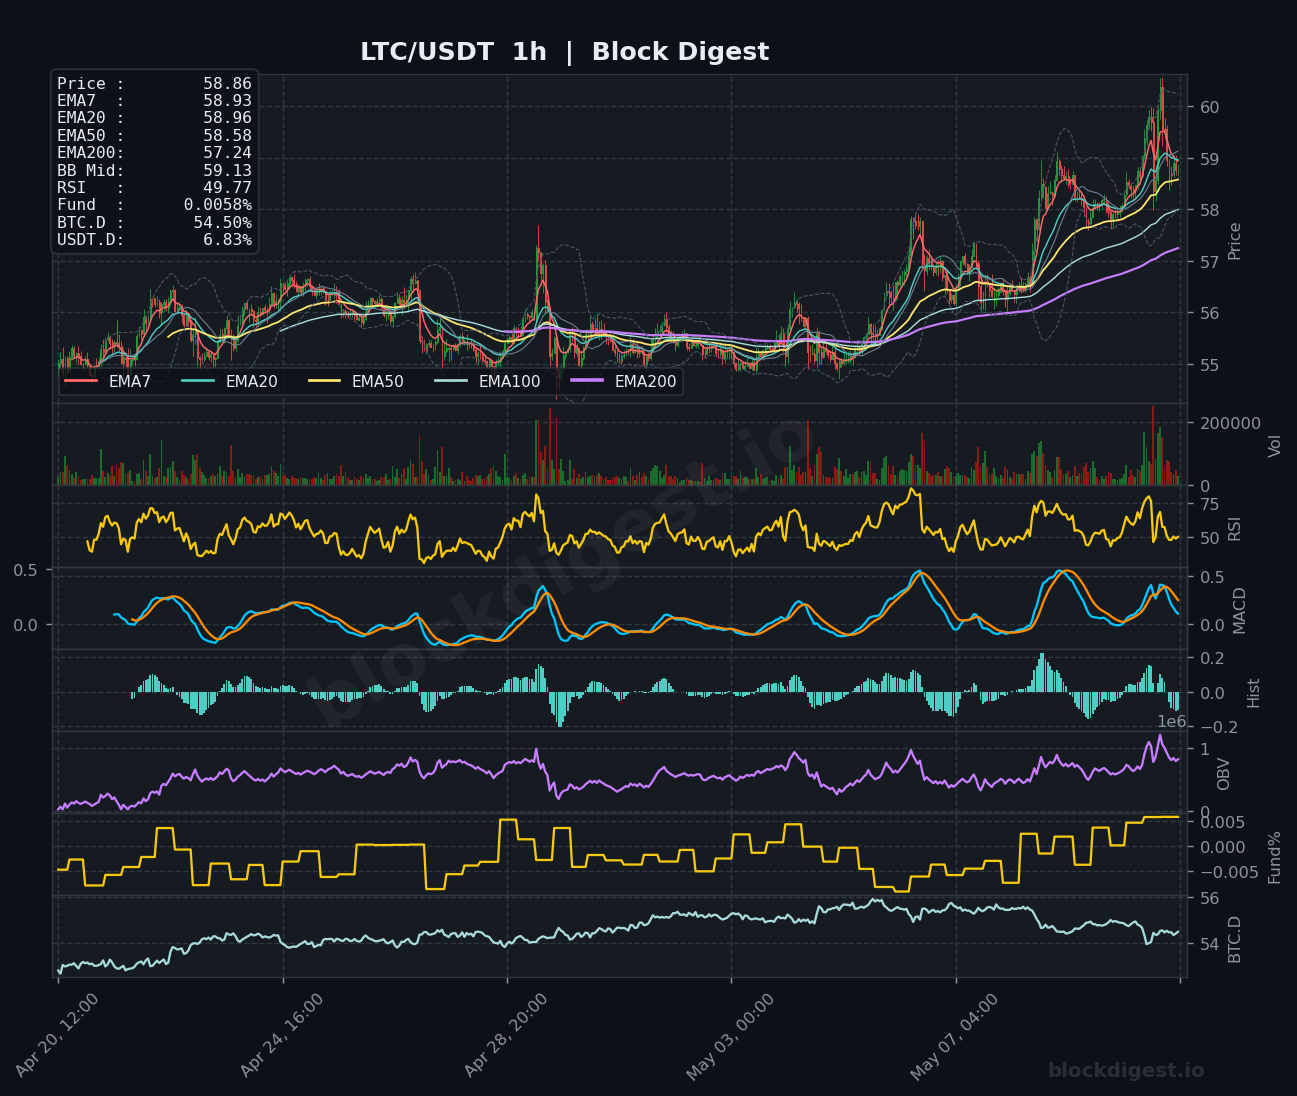
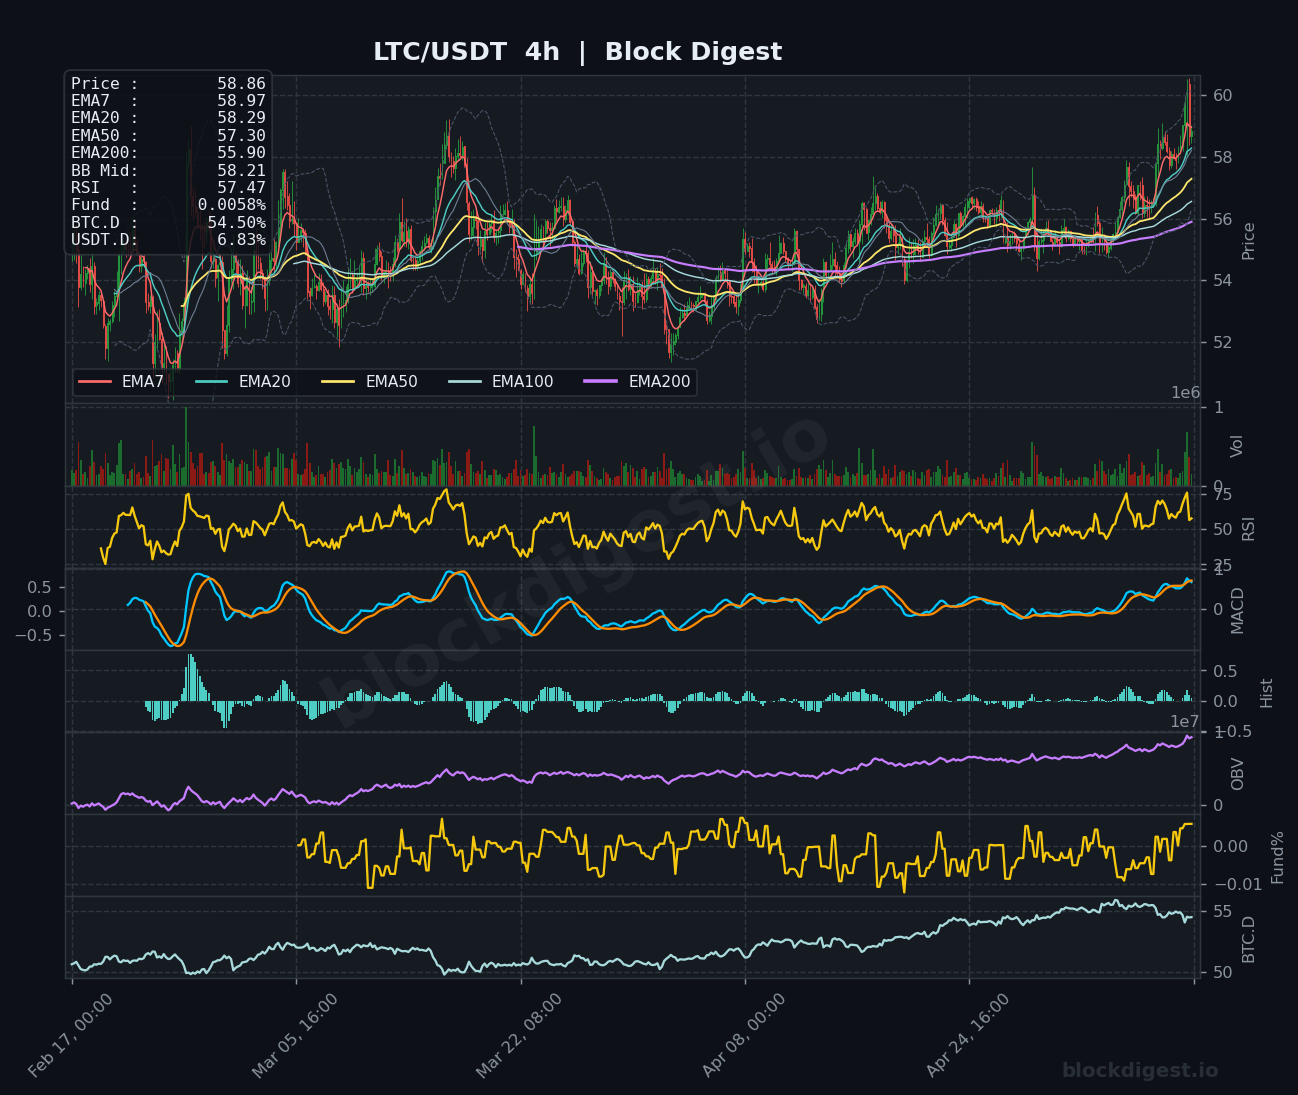
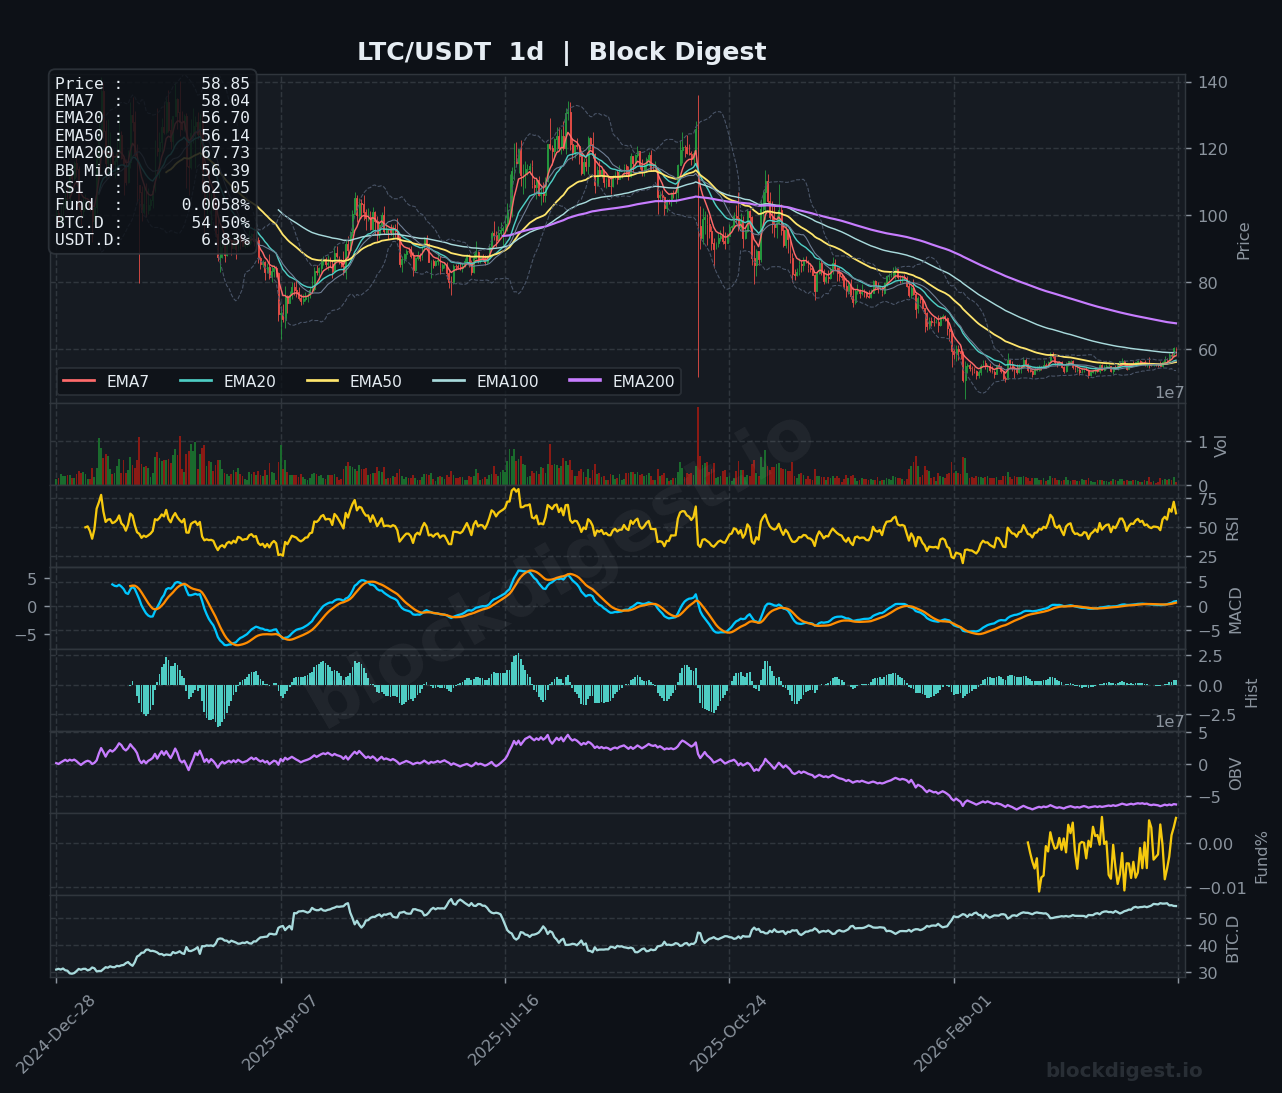
Litecoin is trading at $58.86, showing recent strength with bullish momentum building across timeframes. The 1-hour chart displays LTC pushing higher with RSI at 49.77, indicating balanced conditions with potential for continued upside as buyers step in at current levels. On the 4-hour chart, LTC demonstrates solid bullish structure with RSI at 57.47 and price breaking above the $58 resistance level, with MACD showing positive momentum as moving averages begin to align bullishly. The daily timeframe reveals LTC recovering from deep oversold conditions, with RSI at 62.05 and price now trading above key short-term moving averages, though still facing significant resistance from the EMA200 at $67.73. Key support is established at $56-57, with immediate resistance at $60-61, and the short-term bias is bullish, particularly if LTC can sustain momentum above $59 and target the $62-65 zone in the coming sessions.
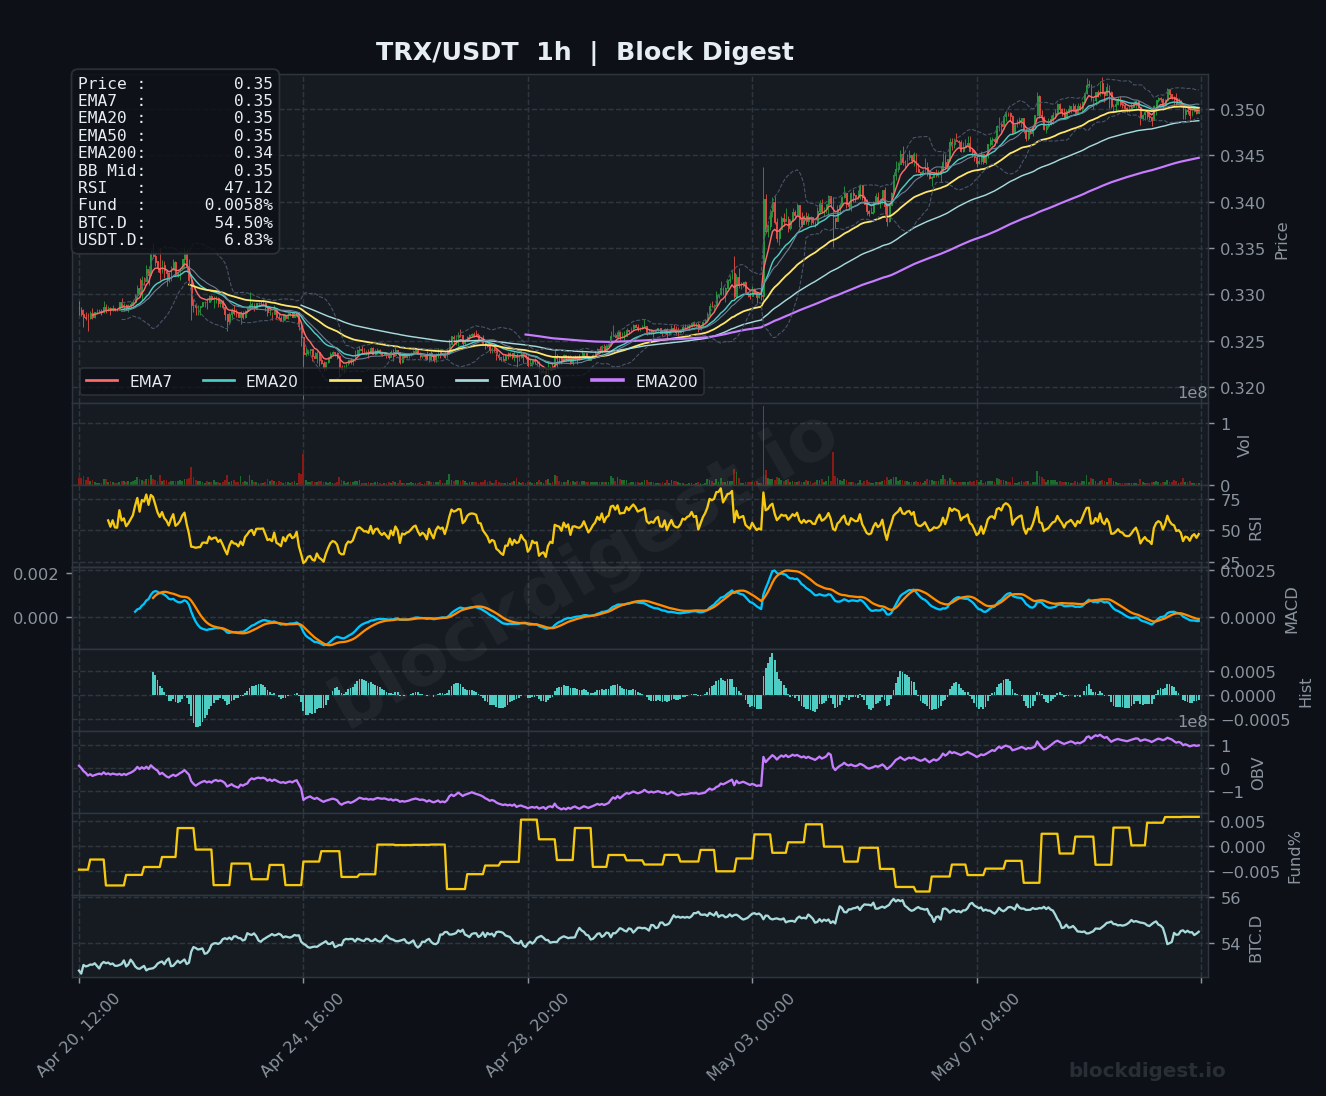
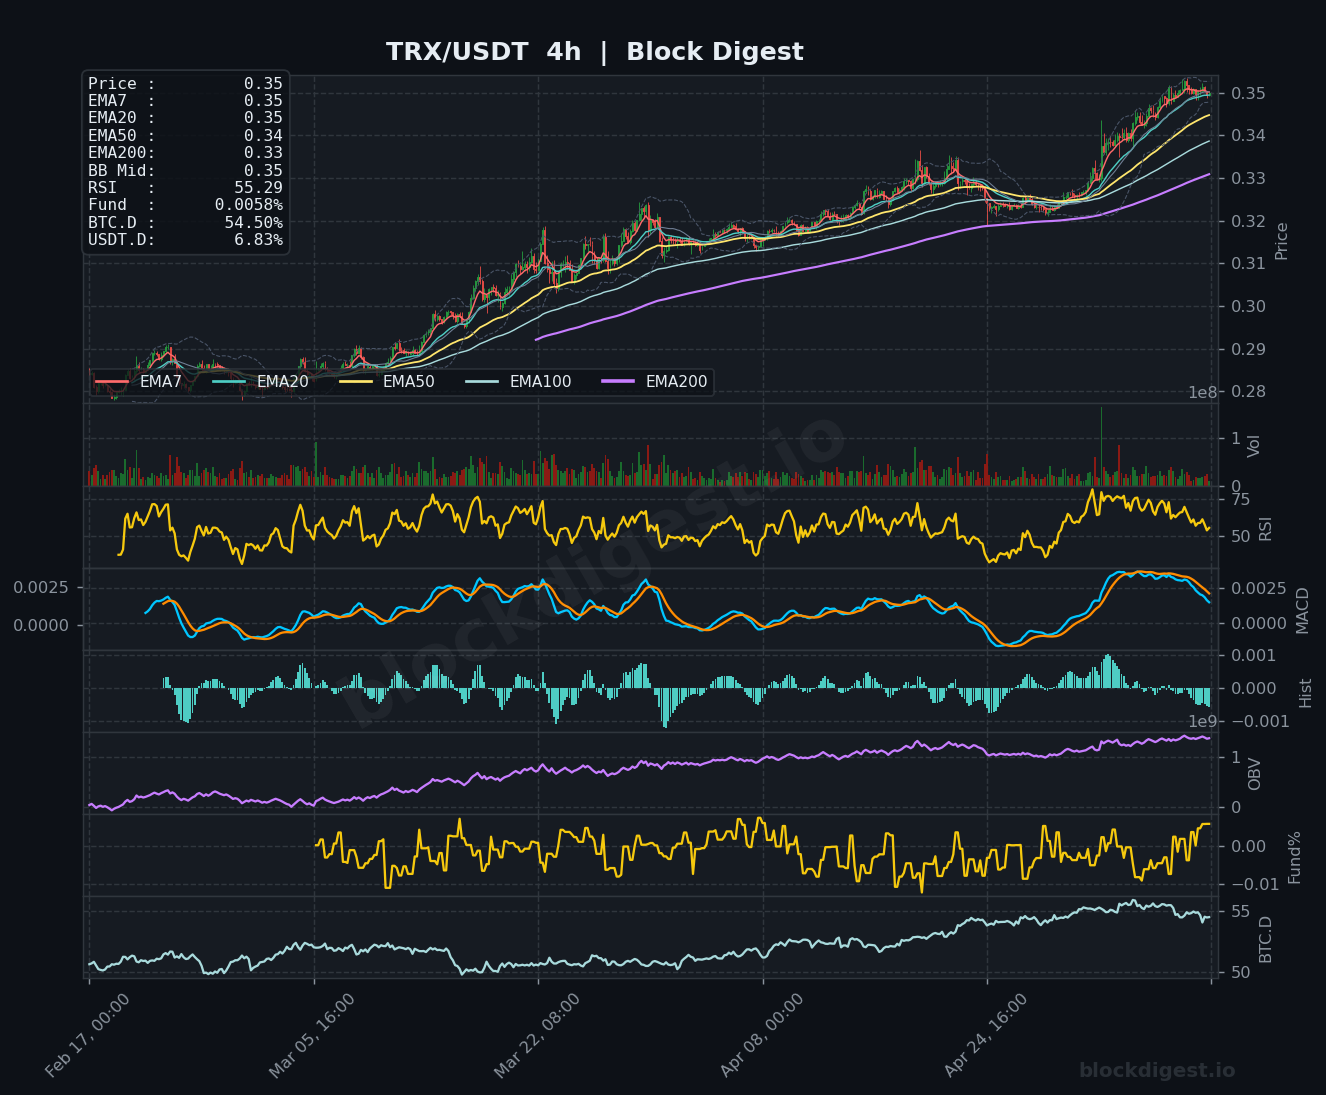
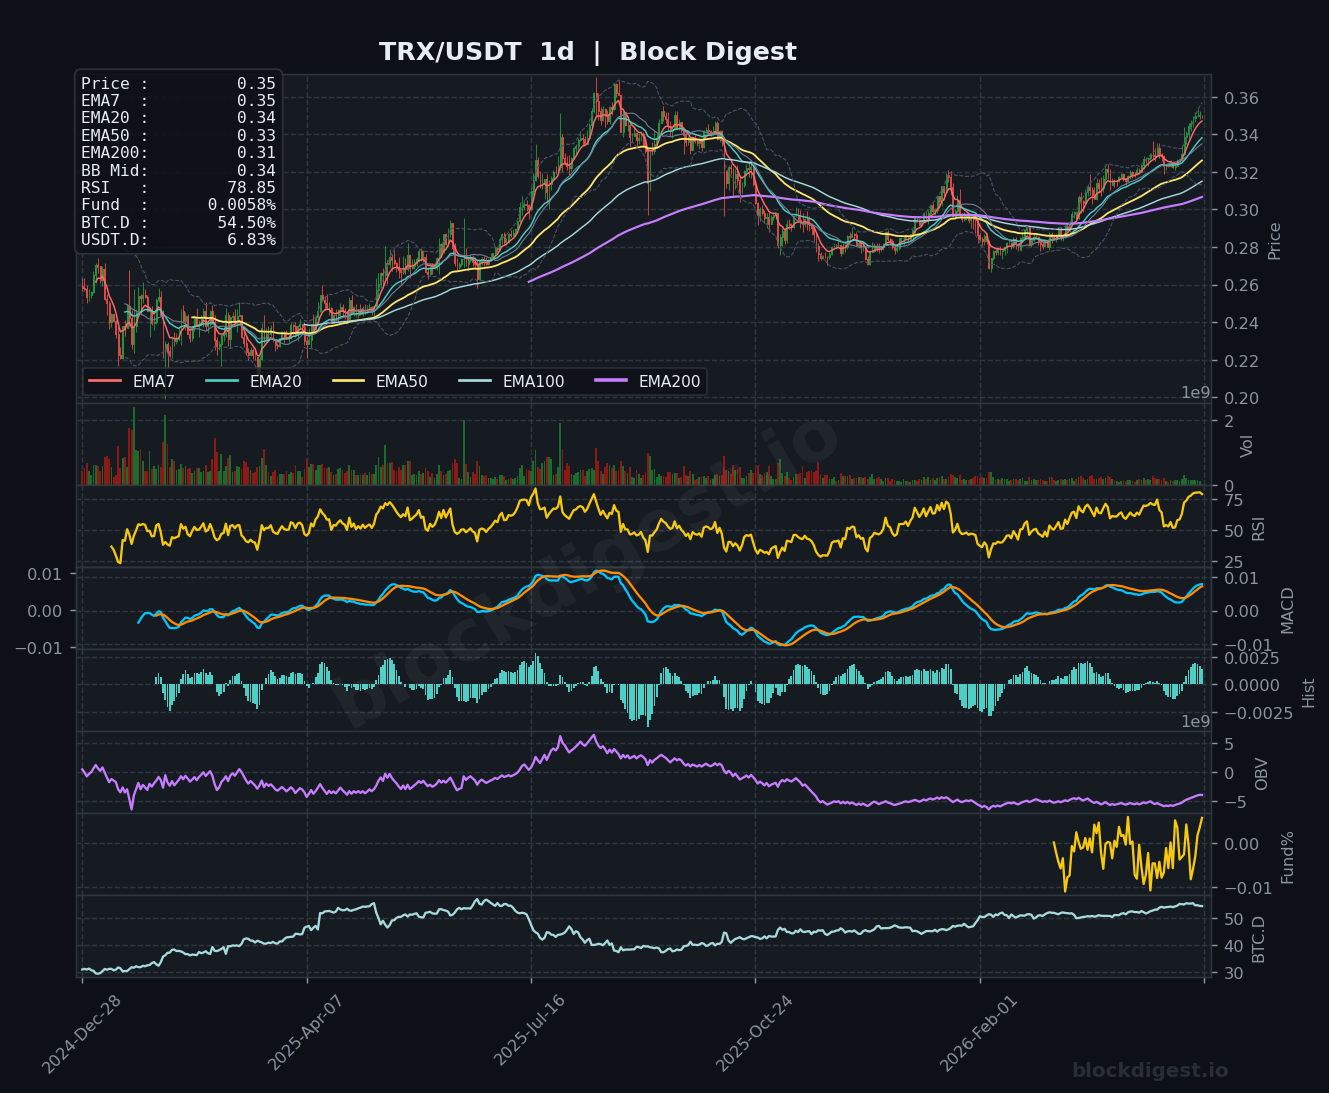
TRON (TRX)
TRON is currently priced at $0.35, exhibiting signs of exhaustion after a sustained uptrend as price consolidates near recent highs. The 1-hour chart shows TRX losing some momentum with RSI at 47.12, suggesting profit-taking after the recent rally, with price pulling back from the $0.355 level. The 4-hour perspective displays TRX in a mature uptrend with RSI at 55.29, though price action is showing signs of consolidation with tighter ranges and reduced volume, indicating potential distribution or pause before the next move. On the daily chart, TRX exhibits impressive long-term strength with RSI at 78.85, approaching overbought territory as price trades well above all major moving averages in a well-established uptrend channel. Immediate support is located at $0.345-0.348, with resistance at $0.358-0.360, and the short-term bias remains cautiously bullish, though traders should be alert to potential pullbacks given the elevated RSI readings on higher timeframes.
Altcoin Outlook
The altcoin market presents a tale of diverging strengths, with clear leaders and laggards emerging across the major tokens. SOL, LTC, and TRX demonstrate the strongest technical setups, displaying bullish momentum, healthy RSI readings, and price action above key moving averages, making them favorable for continuation plays. Conversely, DOGE exhibits the weakest profile, trading in a prolonged downtrend with limited catalysts for reversal, while XRP and BNB occupy middle ground with neutral setups requiring clear directional breaks to establish tradable trends. Critical factors to monitor include Bitcoin’s ability to maintain stability around current levels (as BTC.D at 54.50% suggests) and any shifts in USDT.D that could signal changing risk appetite across the broader crypto market, which would significantly impact altcoin performance in the sessions ahead.
Disclaimer: This analysis is for informational purposes only and does not constitute financial advice. Cryptocurrency markets are highly volatile and unpredictable. All trading decisions should be made based on your own research and risk tolerance. Block Digest is not responsible for any financial losses incurred as a result of acting on this content.