Altcoin Daily Analysis: Bitcoin Dominance at 55.28% Suppresses Altcoin Rally
Market Context
Bitcoin dominance sits at approximately 55.28%, a relatively elevated level that continues to suppress broad altcoin outperformance, while USDT.D holding near 7.99% suggests risk appetite remains cautious but not in full flight-to-safety mode. The altcoin space has experienced a sustained corrective phase across most major assets, with the recent bounce off multi-month lows appearing tentative rather than impulsive. Until BTC dominance shows a decisive rollover, altcoin bulls will face structural headwinds regardless of short-term recovery attempts.
Solana (SOL)
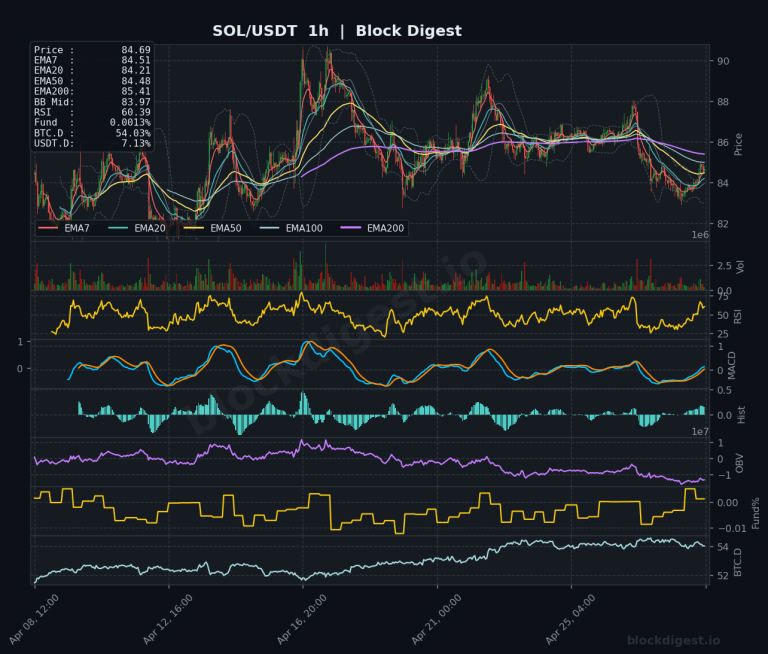
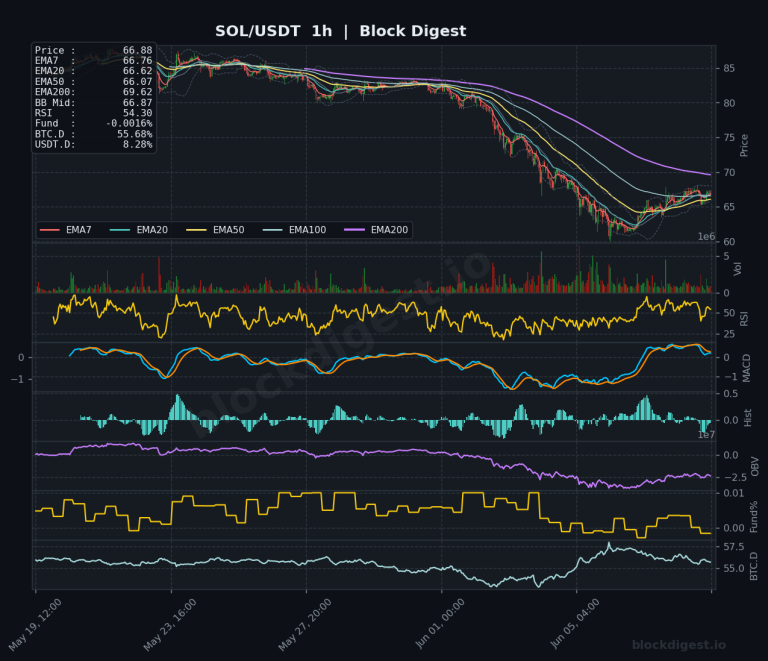
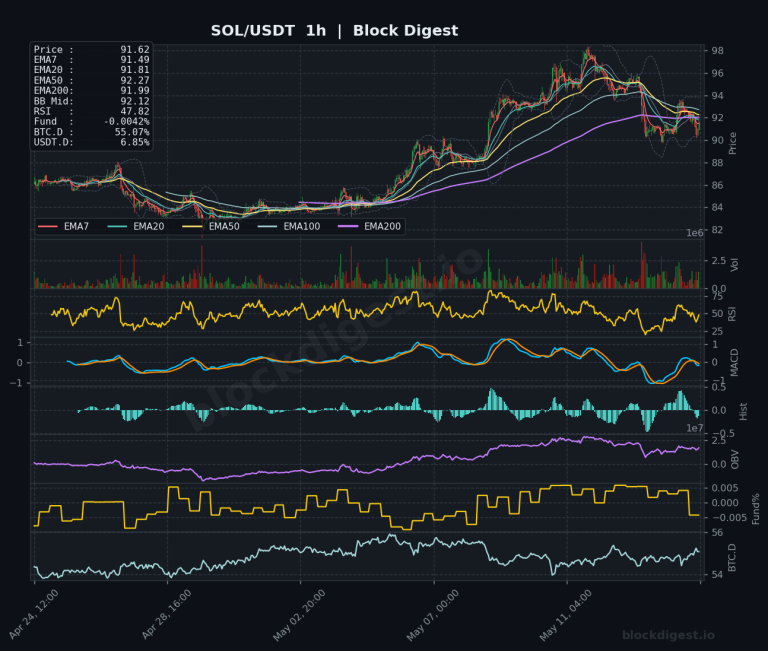
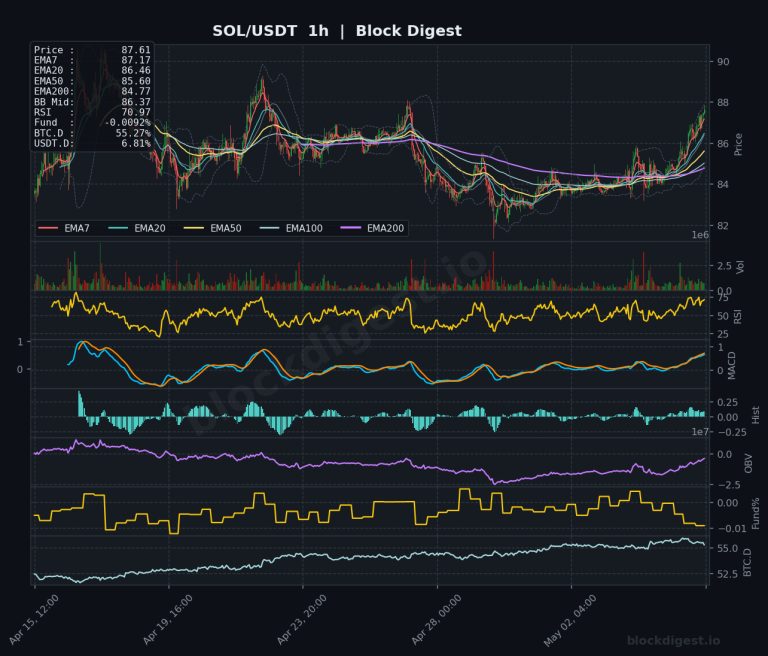
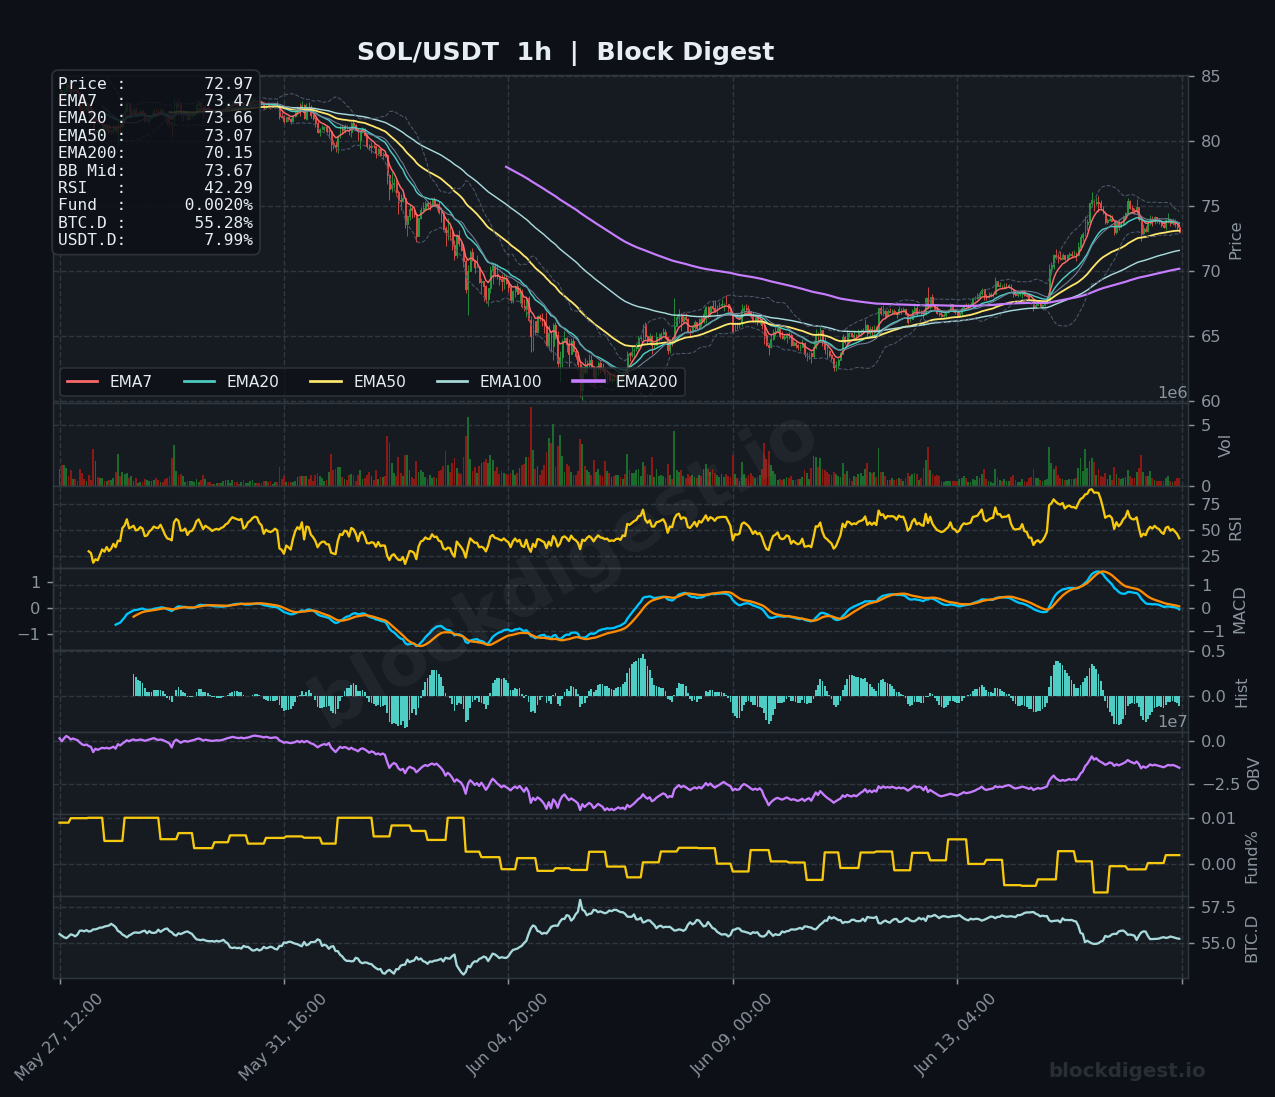
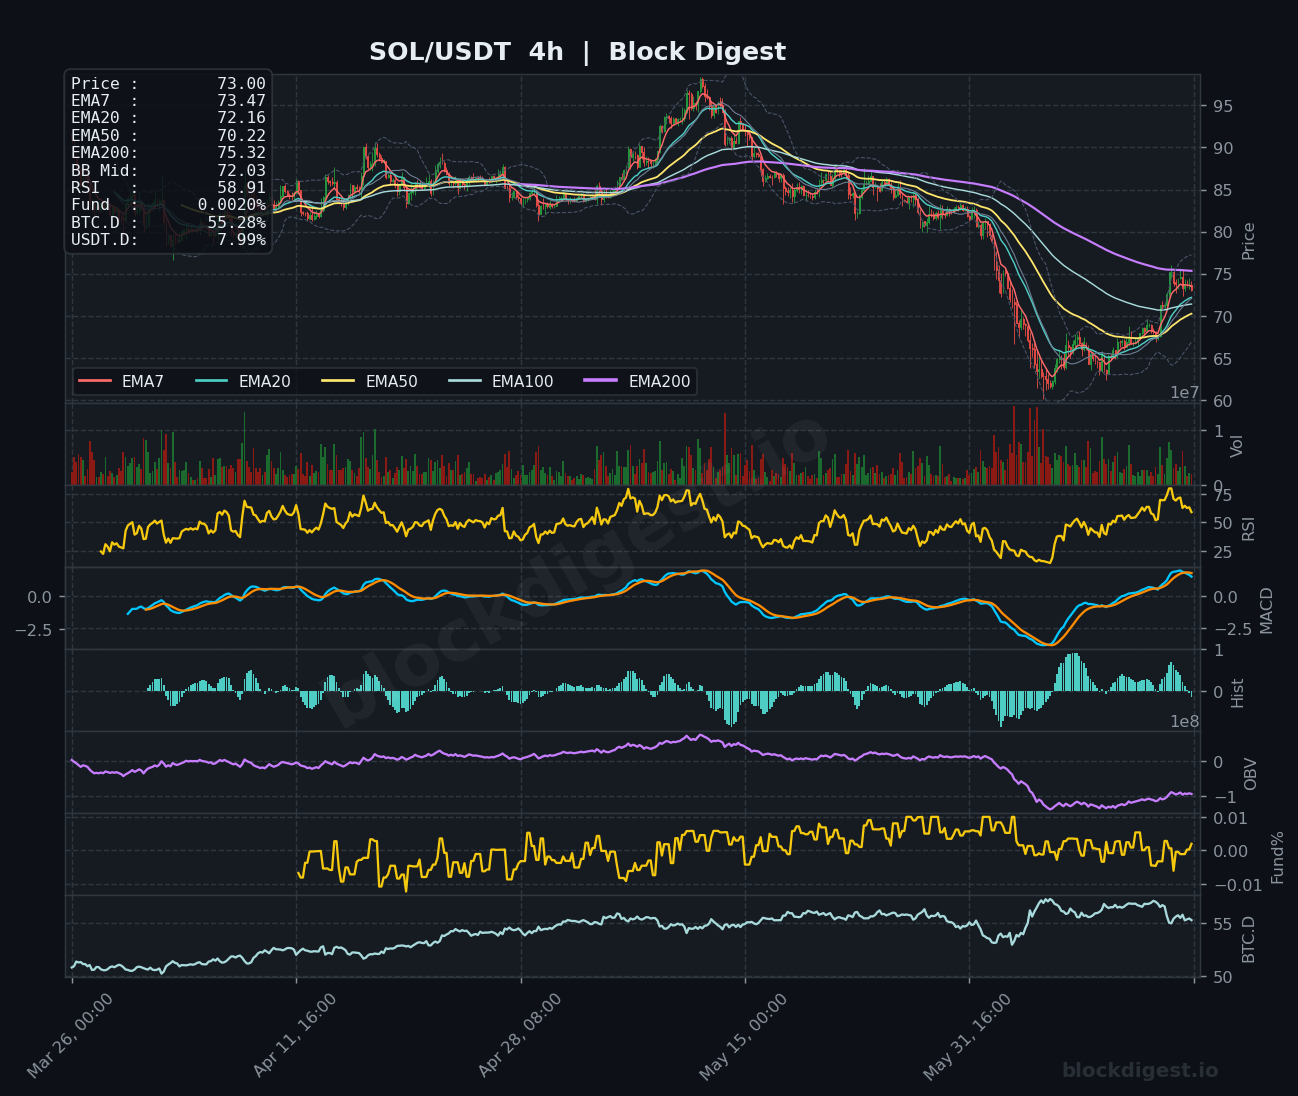
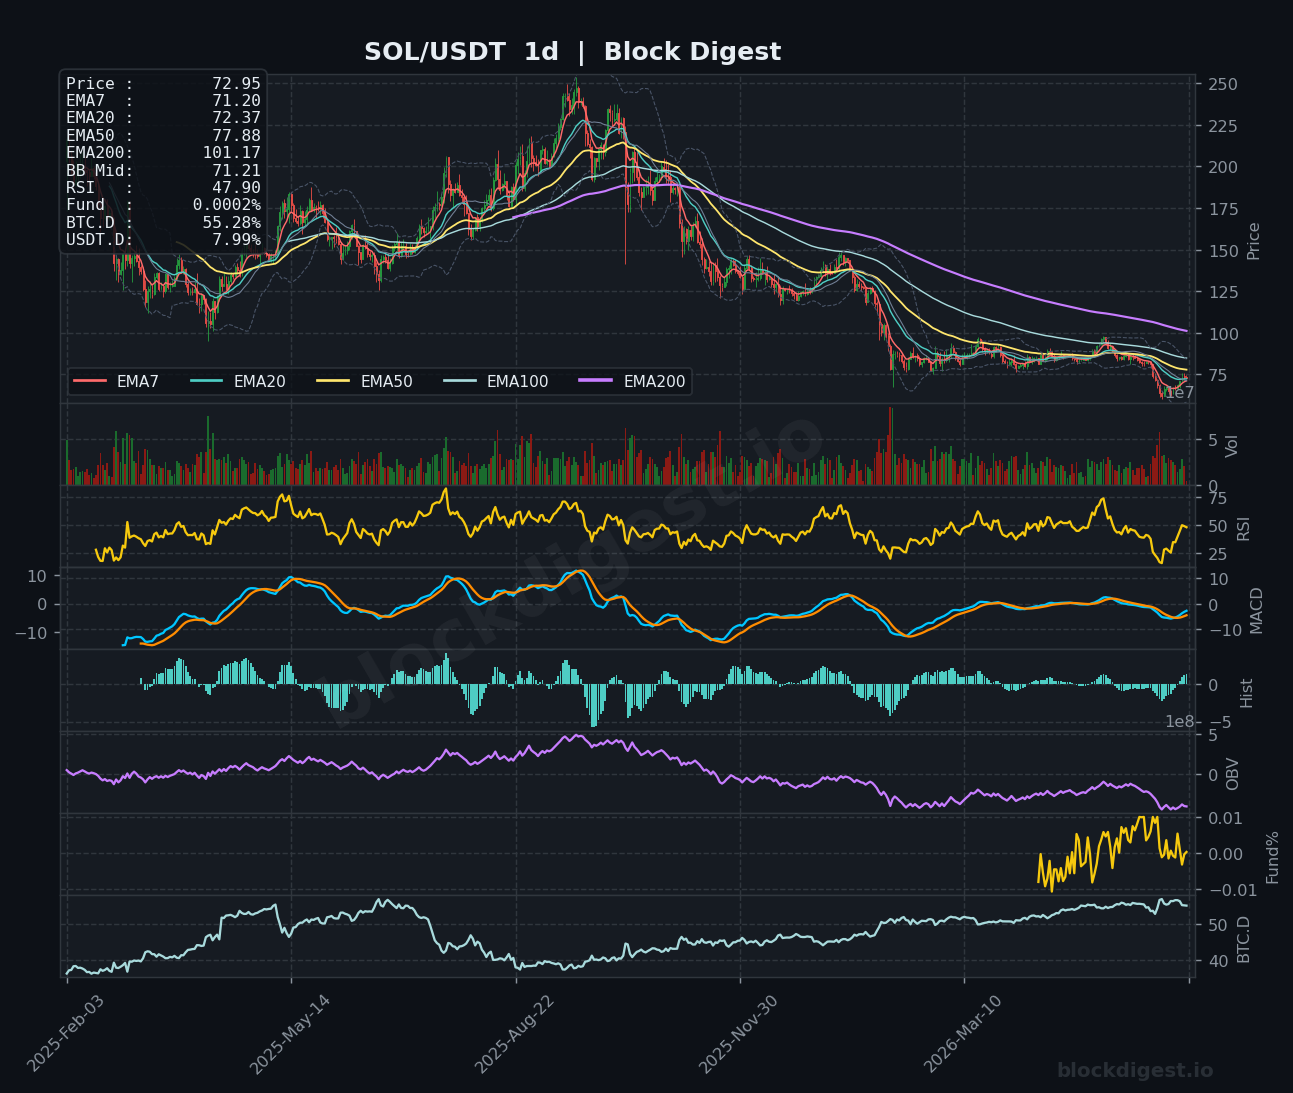
SOL is trading at $72.95–$73.00, having bounced off lows near $64–$65 but now facing resistance from a cluster of short-term EMAs between $73.07 and $73.66 on the 1h chart. The 4h frame shows price still trading well below the EMA200 at $75.32, with the MACD attempting a bullish crossover but still in early recovery territory and RSI at 58.91 — indicating momentum has partially recovered but is not yet conclusive. On the daily, SOL remains deeply beneath both the EMA50 ($77.88) and EMA200 ($101.17), with RSI at 47.90 sitting just below the neutral 50 level and OBV continuing a multi-month downtrend, highlighting persistent distribution pressure. The short-term bias is cautiously neutral-to-bearish, with $75–$76 acting as the key overhead resistance zone and $68–$69 as critical support to hold.
XRP (XRP)
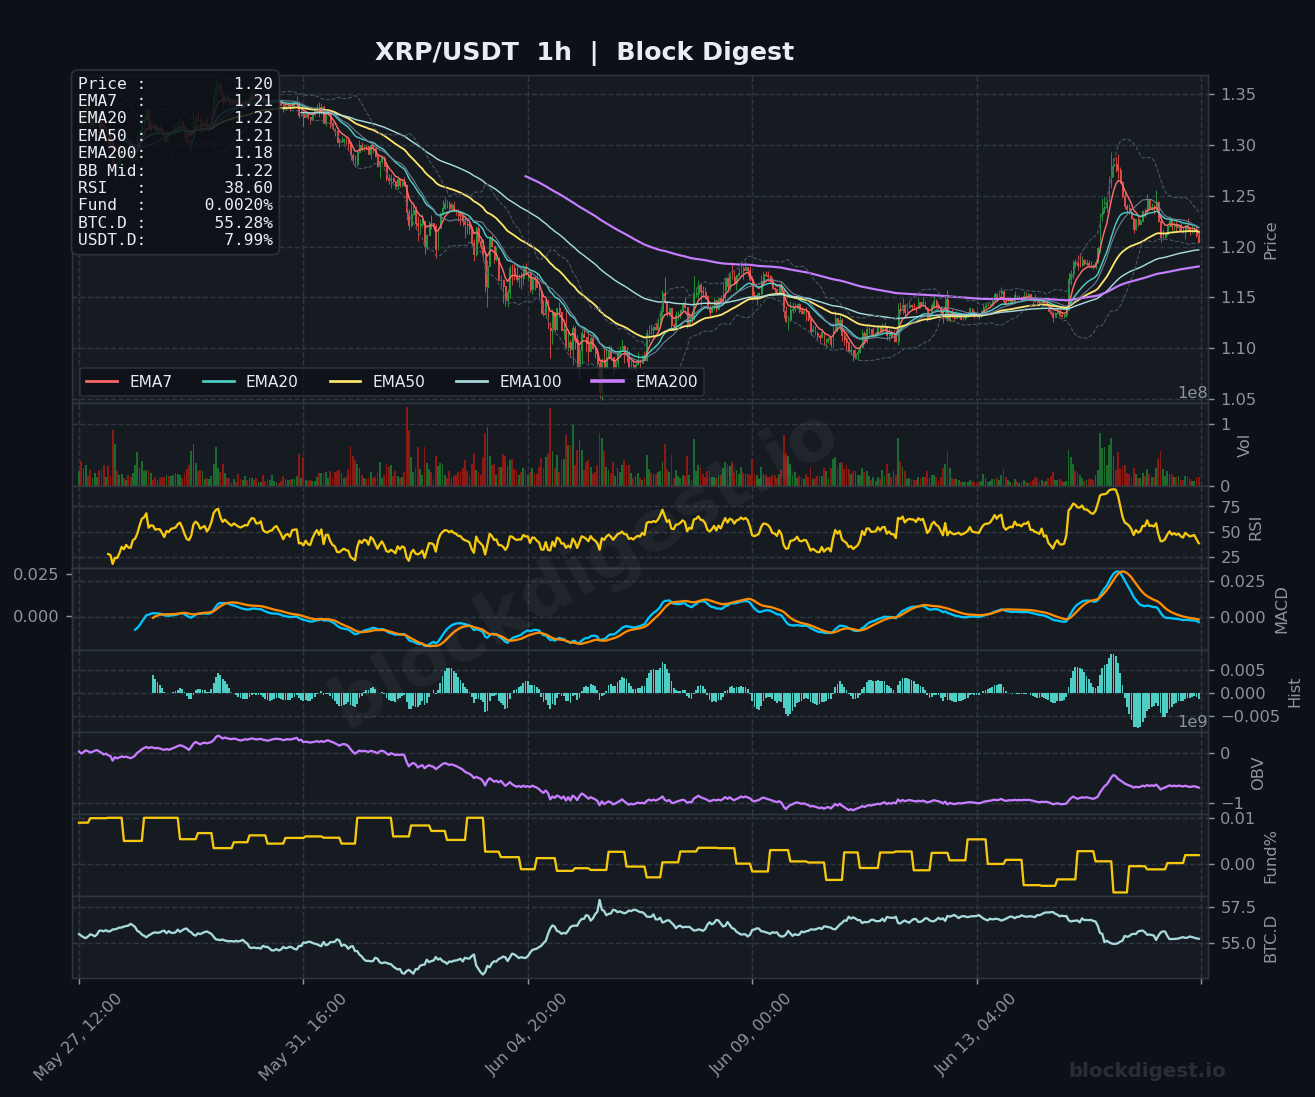
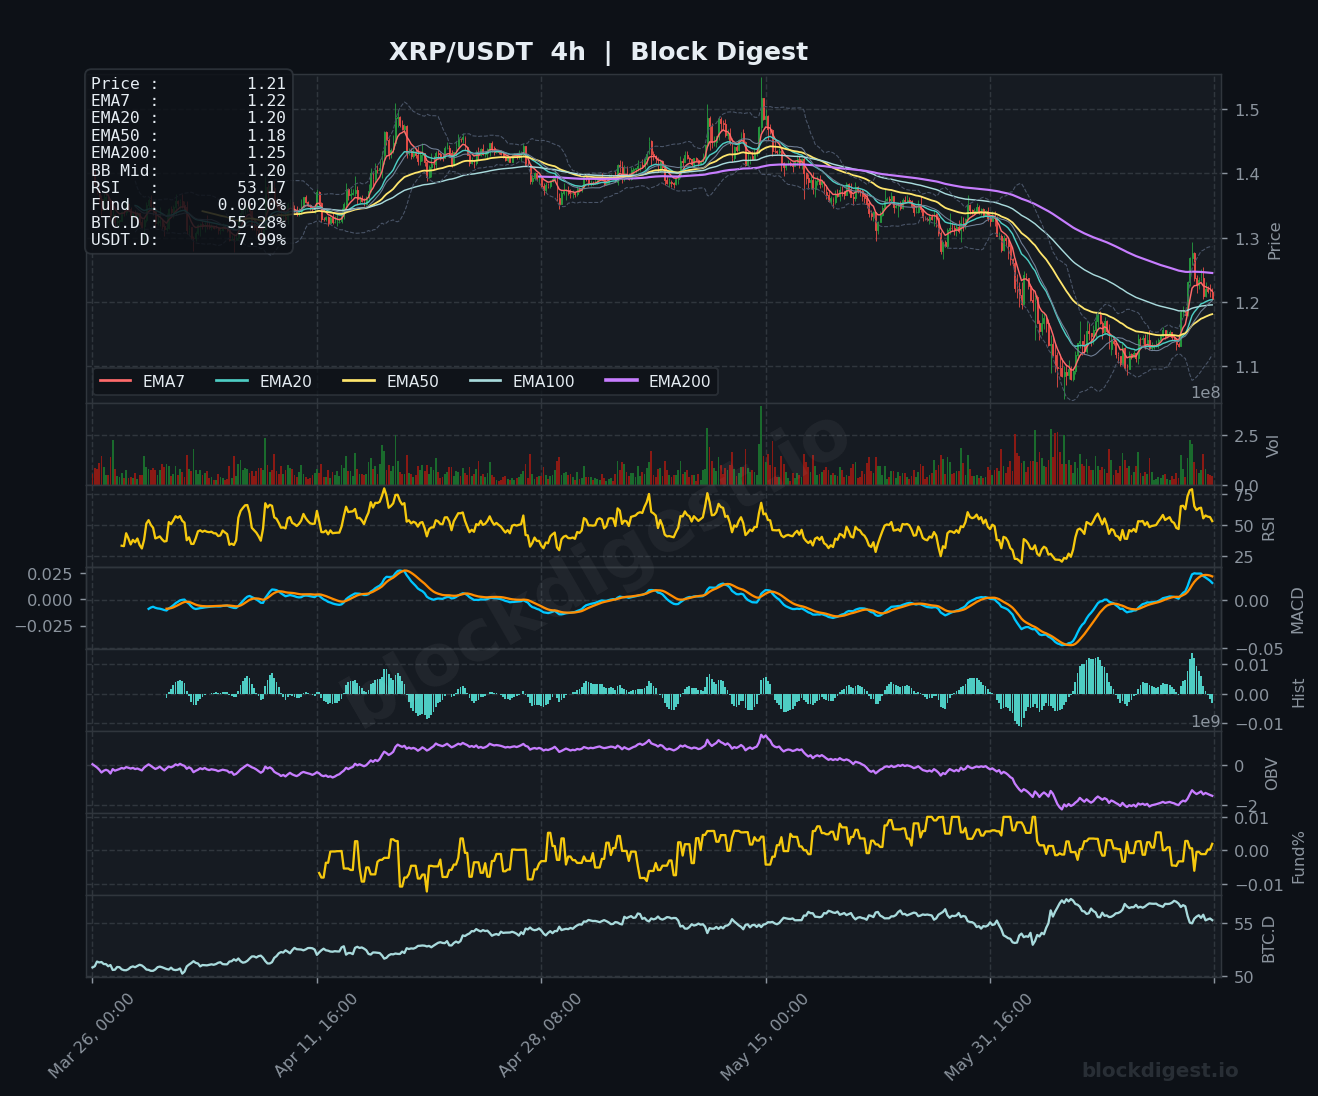
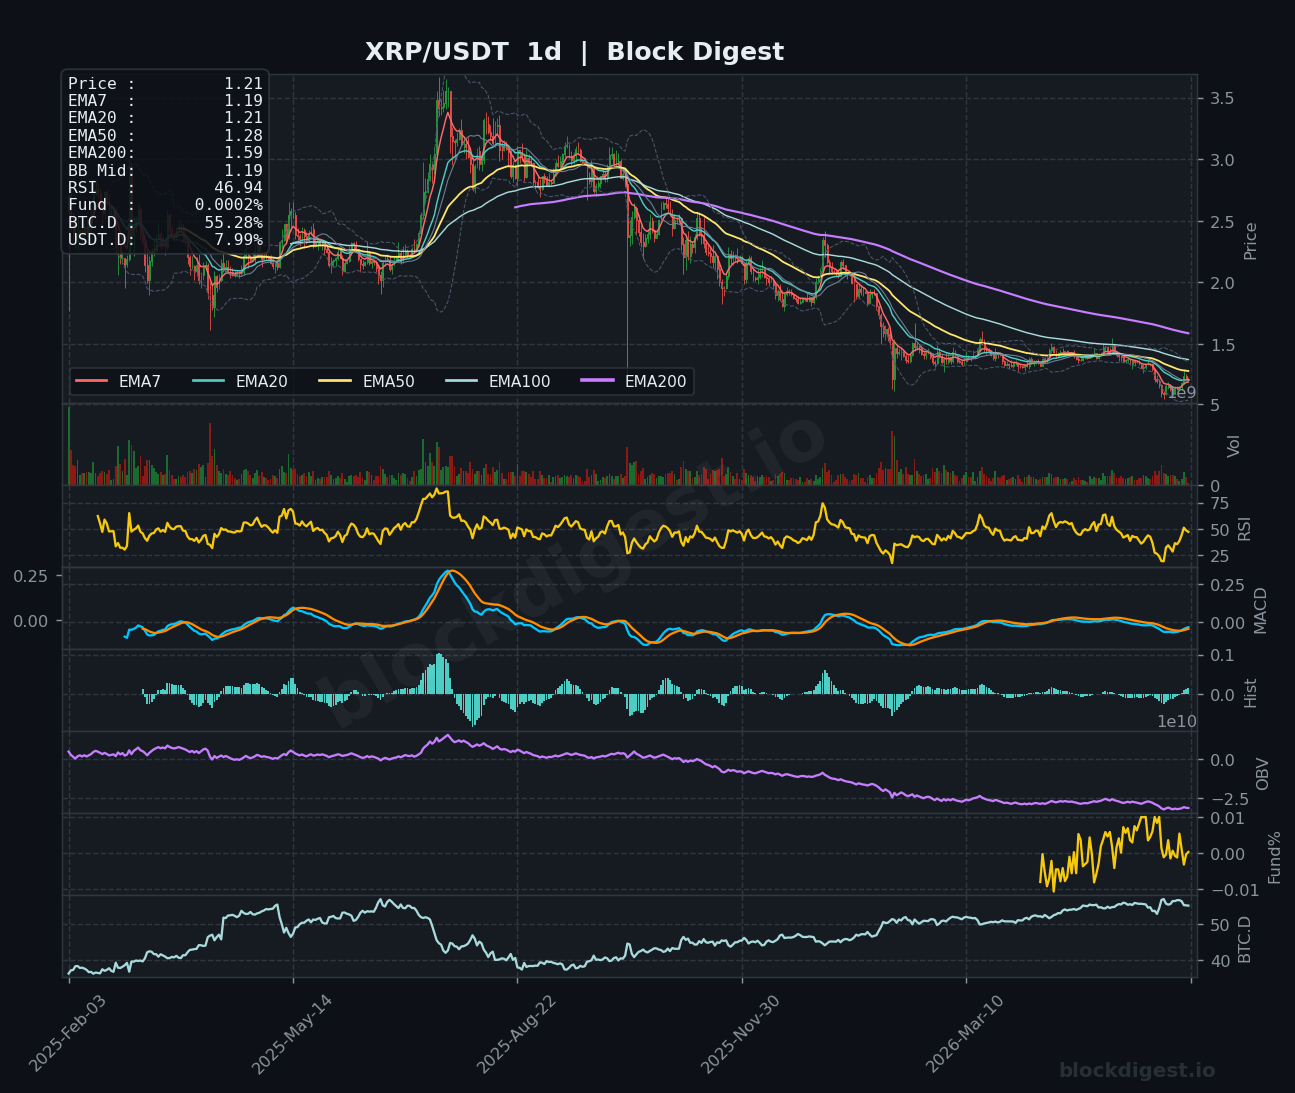
XRP is trading at $1.20–$1.21, consolidating after a spike toward $1.30 that failed to sustain momentum, and is now pulling back below the EMA7 ($1.21) and EMA20 ($1.22) on the 1h chart with RSI sliding to 38.60, signaling weakening near-term momentum. The 4h chart shows the MACD attempting a bullish crossover from negative territory, with RSI at 53.17 reflecting a moderate recovery, though price remains capped below the descending EMA200 at $1.25. On the daily timeframe, XRP trades below the EMA50 ($1.28) and far beneath the EMA200 ($1.59), while the OBV trend remains in persistent decline — a bearish signal for sustained accumulation. The short-term bias is neutral-to-bearish, with $1.25 representing the next key resistance and $1.10–$1.12 as the critical downside support zone to monitor.
BNB (BNB)
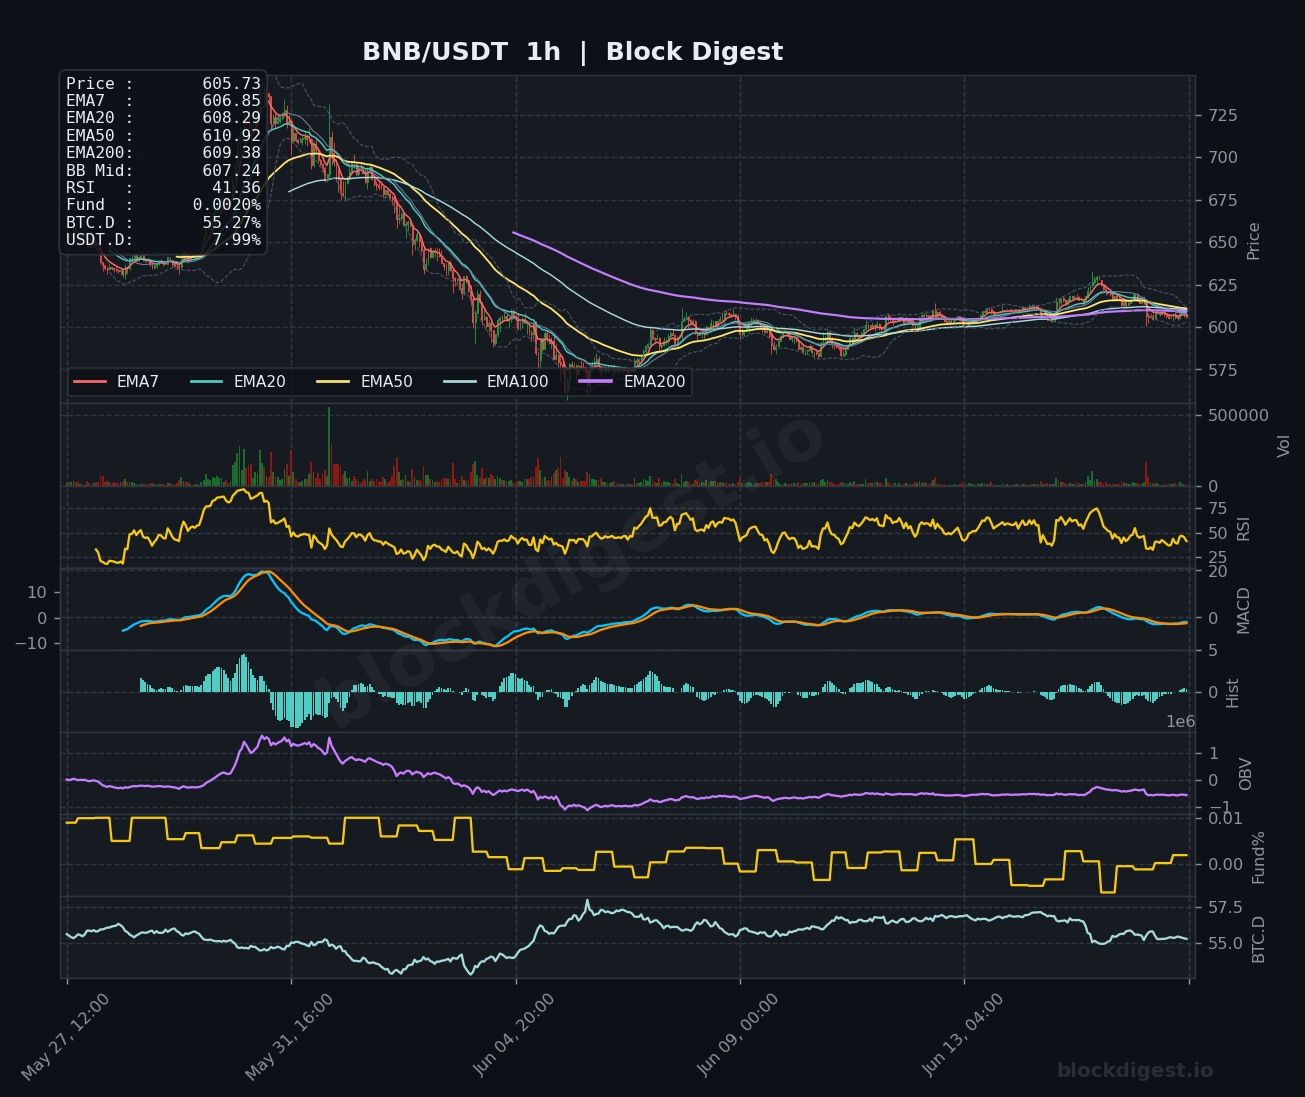
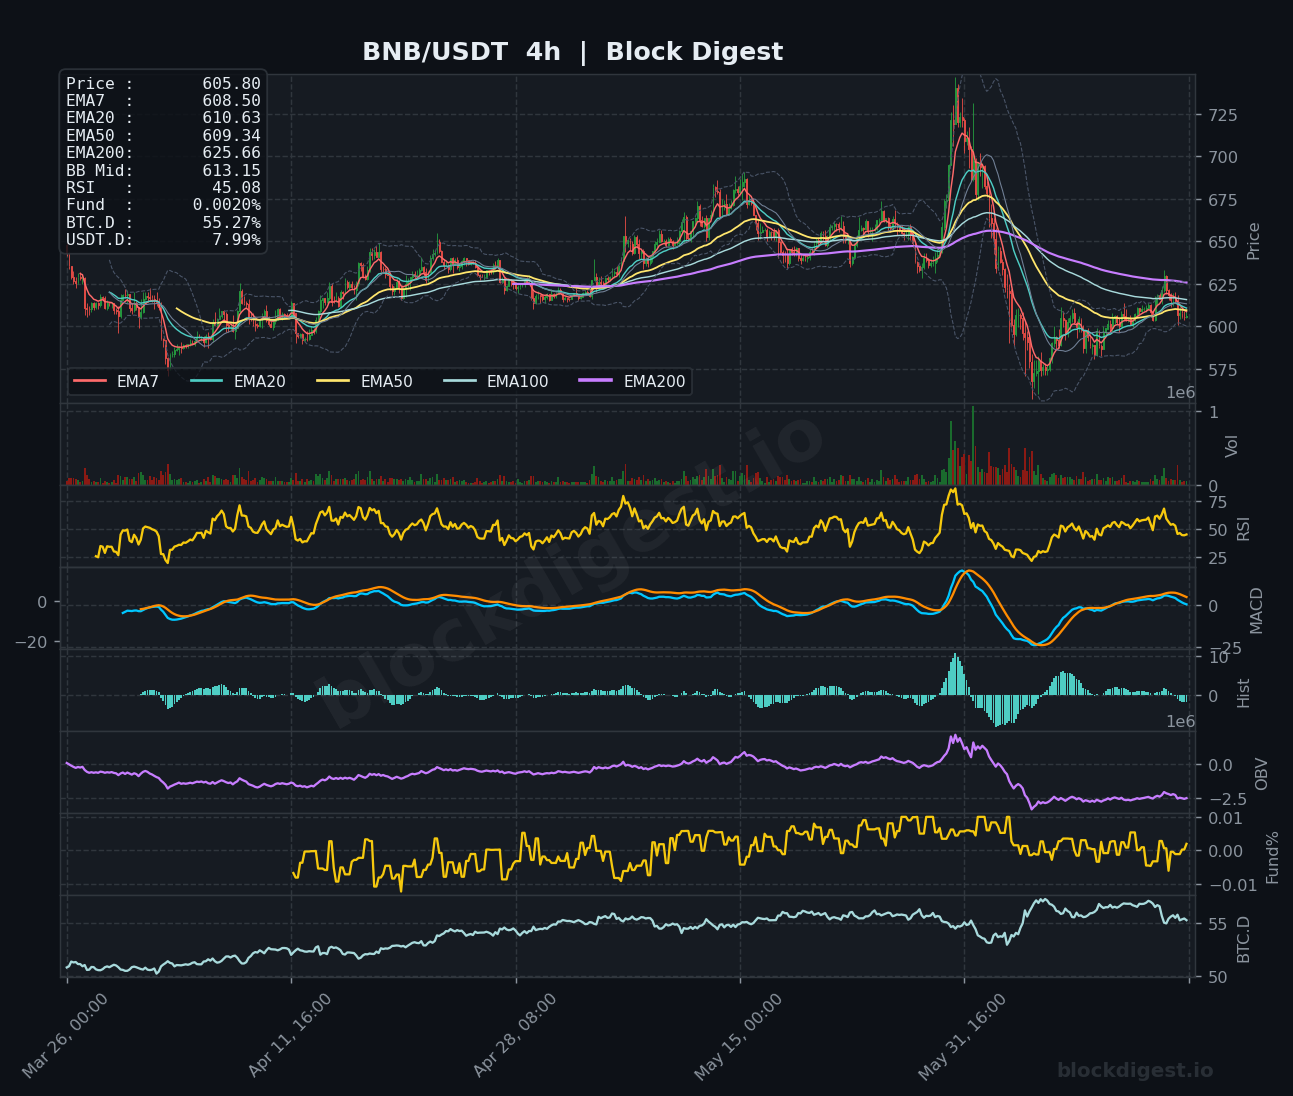
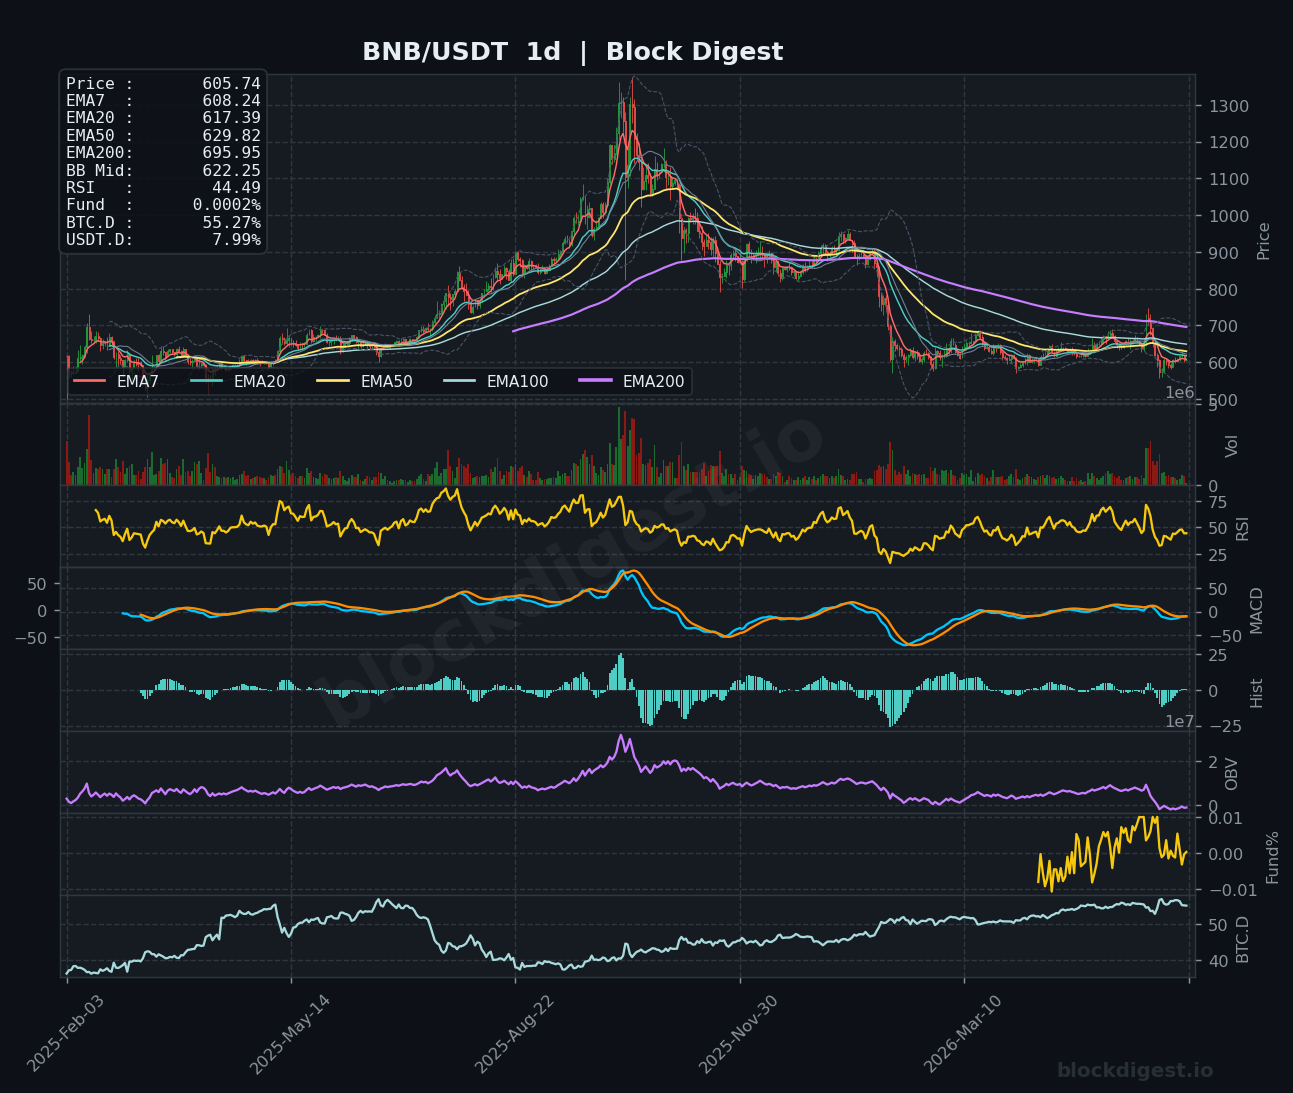
BNB is currently trading at $605.73, struggling to reclaim its short-term EMAs, with the EMA7 ($606.85), EMA20 ($608.29), EMA50 ($610.92), and EMA200 ($609.38) on the 1h chart all clustered tightly just above the current price in a bearish stacked configuration. The 4h RSI at 45.08 is below neutral while the MACD has been gradually recovering from deeply negative levels, suggesting the worst of the selling pressure may be behind it, but conviction on the upside remains limited. On the daily chart, BNB trades below both the EMA20 ($617.39) and EMA50 ($629.82), with the EMA200 at $695.95 representing a massive macro overhead hurdle and daily RSI at 44.49 confirming a subdued recovery attempt. Key support sits at $590–$595, and a clean reclaim of the $620–$630 region would be needed to shift the intermediate-term bias from bearish to neutral.
Dogecoin (DOGE)
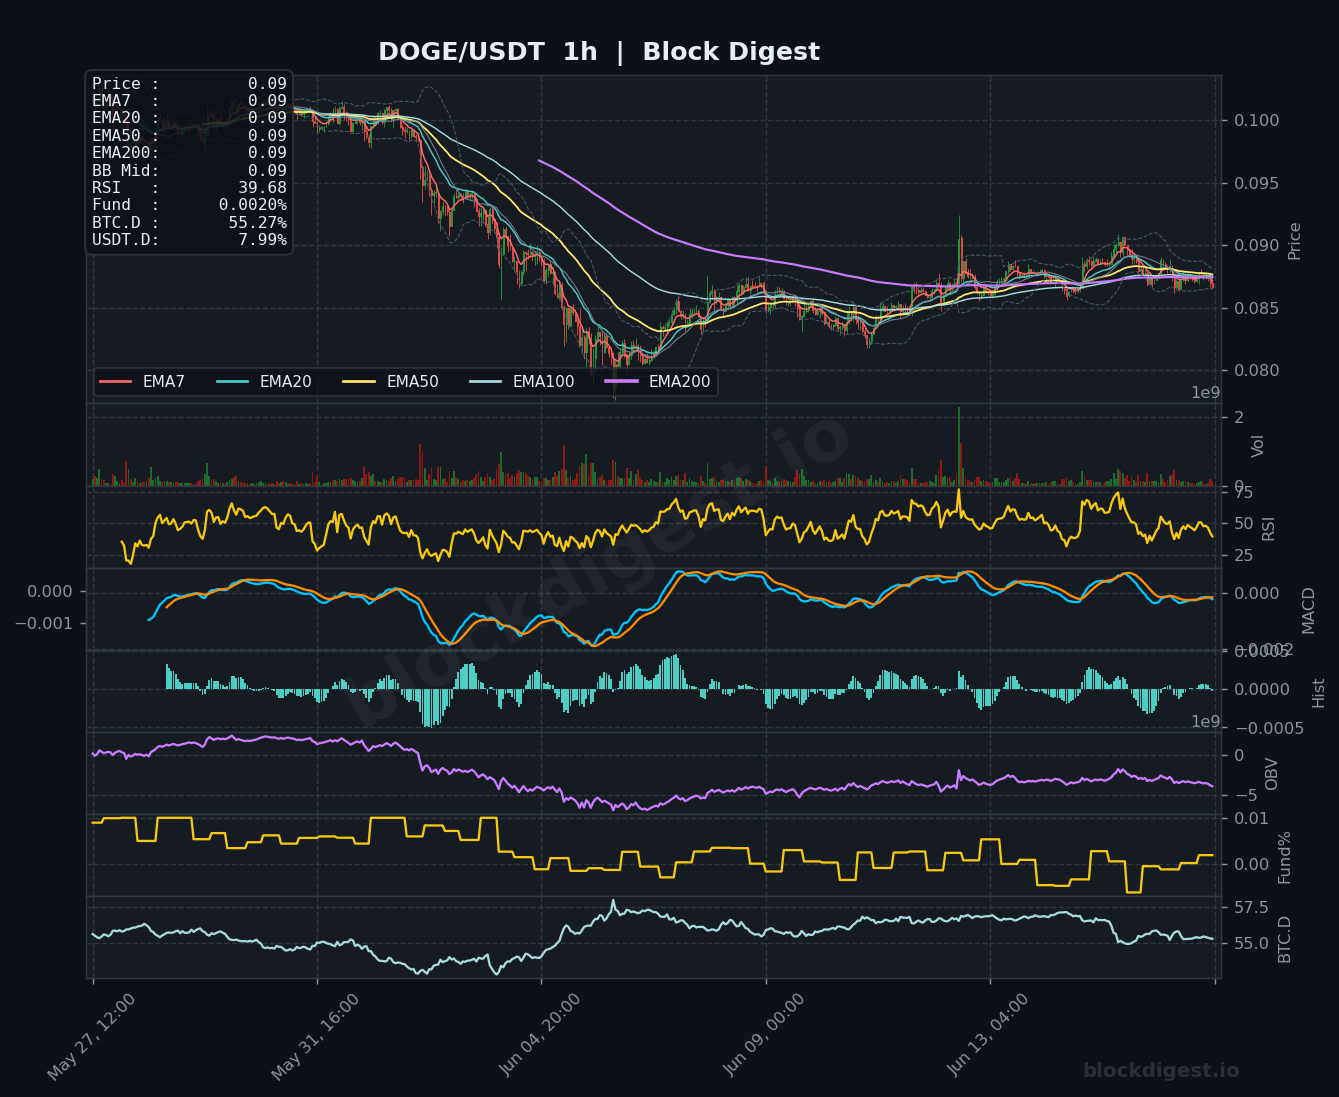
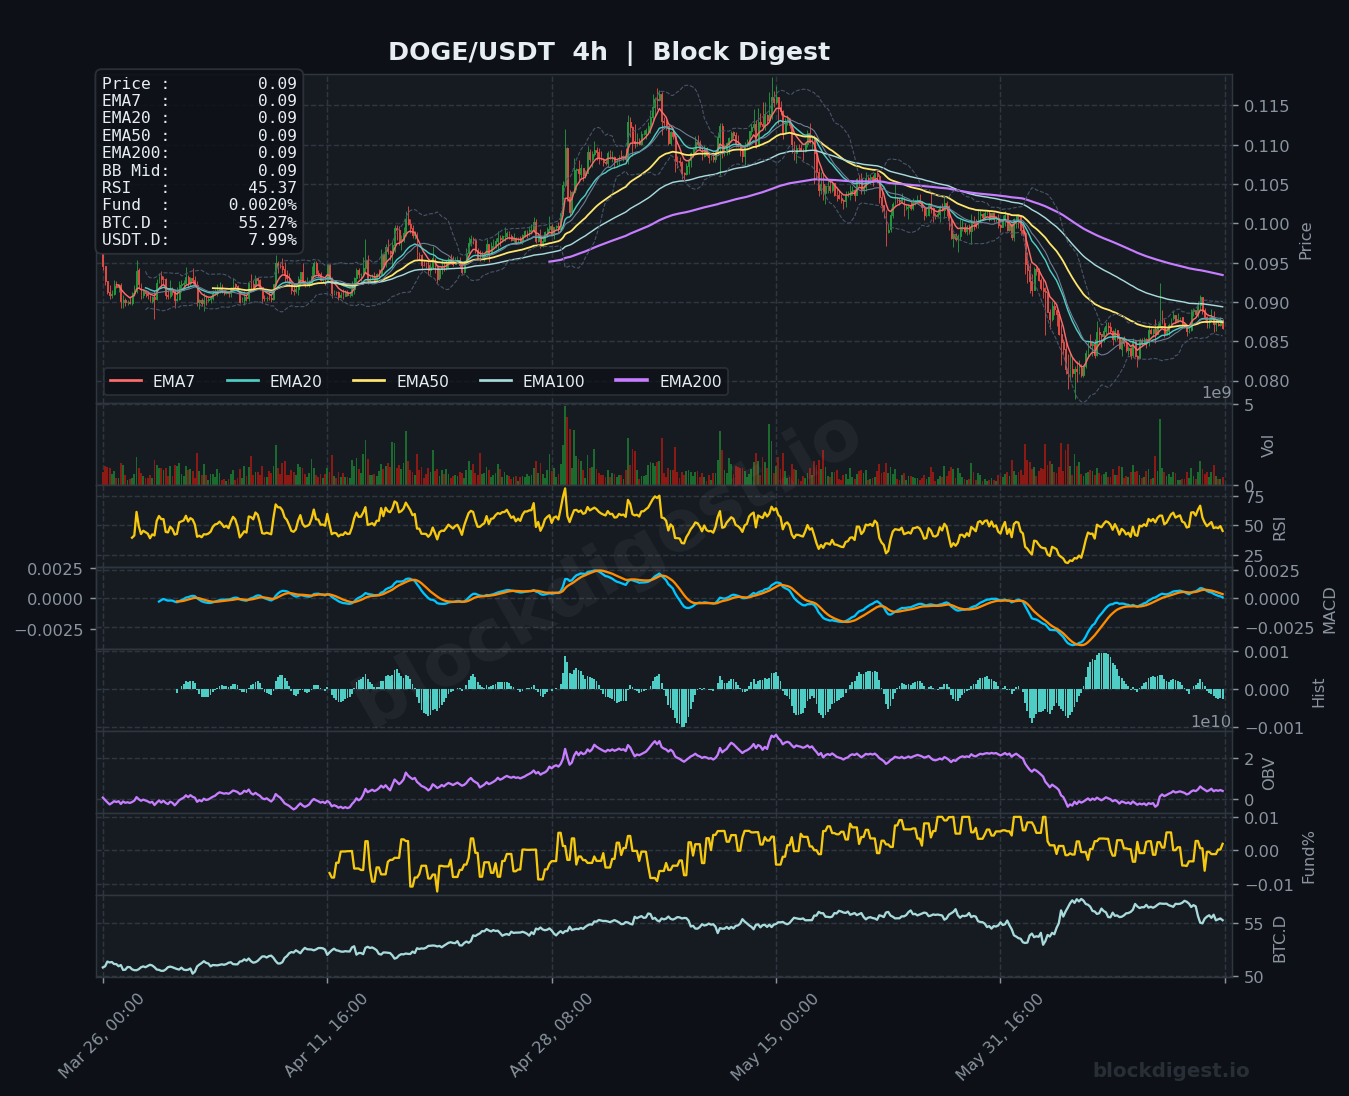
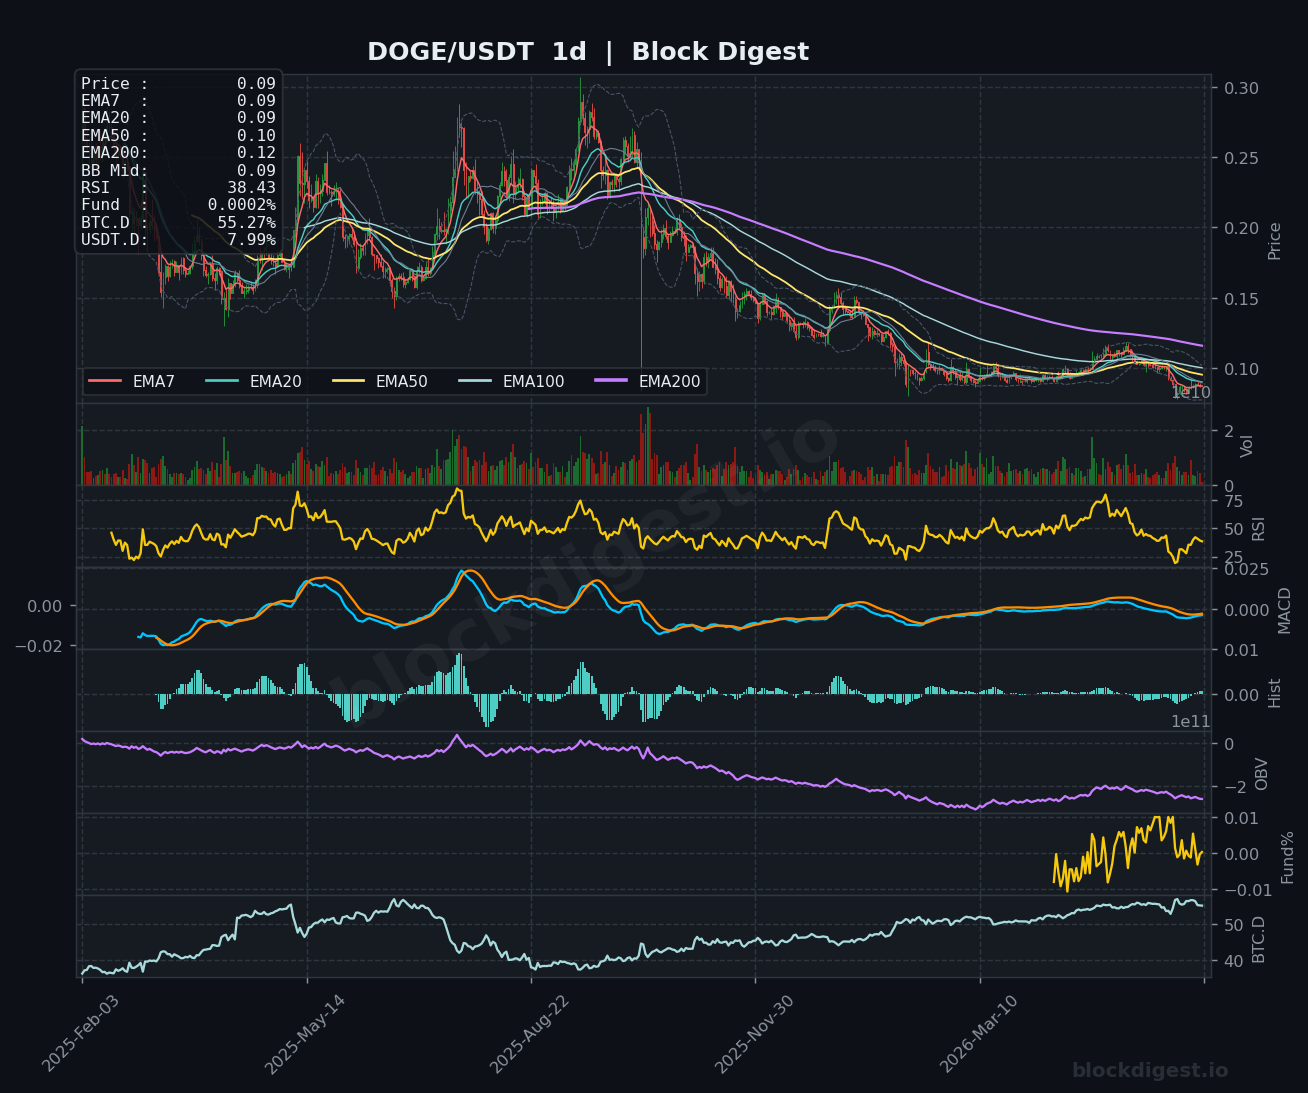
DOGE is trading at $0.09, essentially flat and compressing within an extremely tight range where all short-term EMAs (EMA7 through EMA200) converge at the same $0.09 level on both the 1h and 4h charts, reflecting a period of extreme consolidation and low directional conviction. The 1h RSI at 39.68 and the daily RSI at 38.43 both reside in mildly oversold territory, which could provide a floor for prices, but the daily OBV continues to trend downward, suggesting distribution is still ongoing. On the 4h, the MACD has recently crossed back toward zero from negative territory, offering a faint bullish signal, though the daily MACD remains in a bearish configuration near zero. The overall bias is bearish-to-neutral; a decisive break above $0.092–$0.095 would be needed to suggest any meaningful recovery, while a breakdown below $0.083–$0.084 would expose the pair to further downside.
Litecoin (LTC)
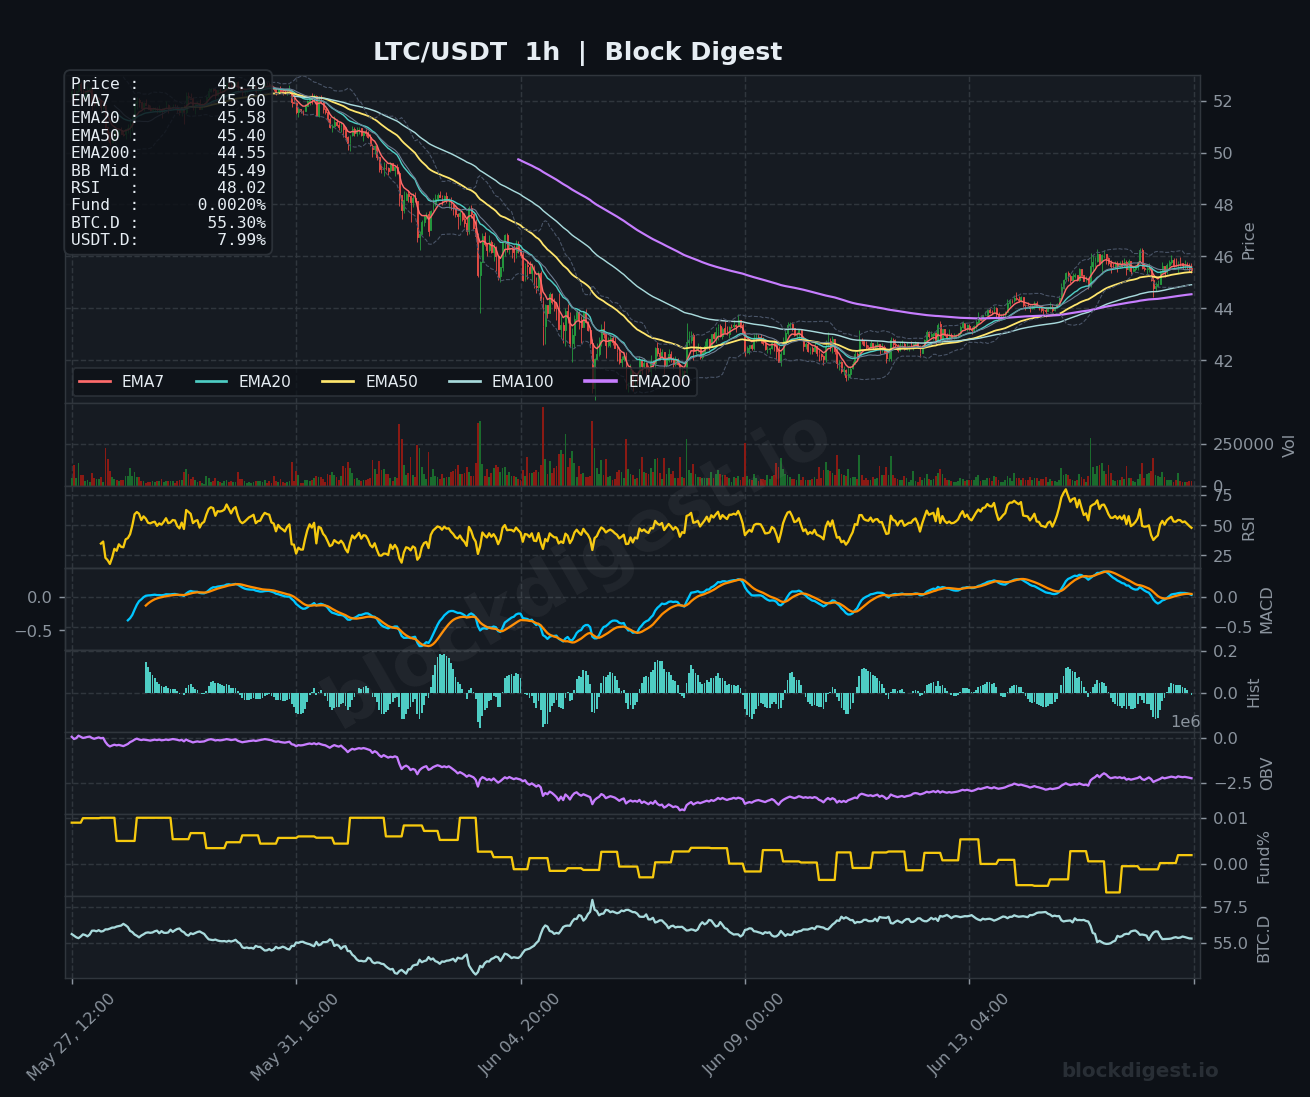
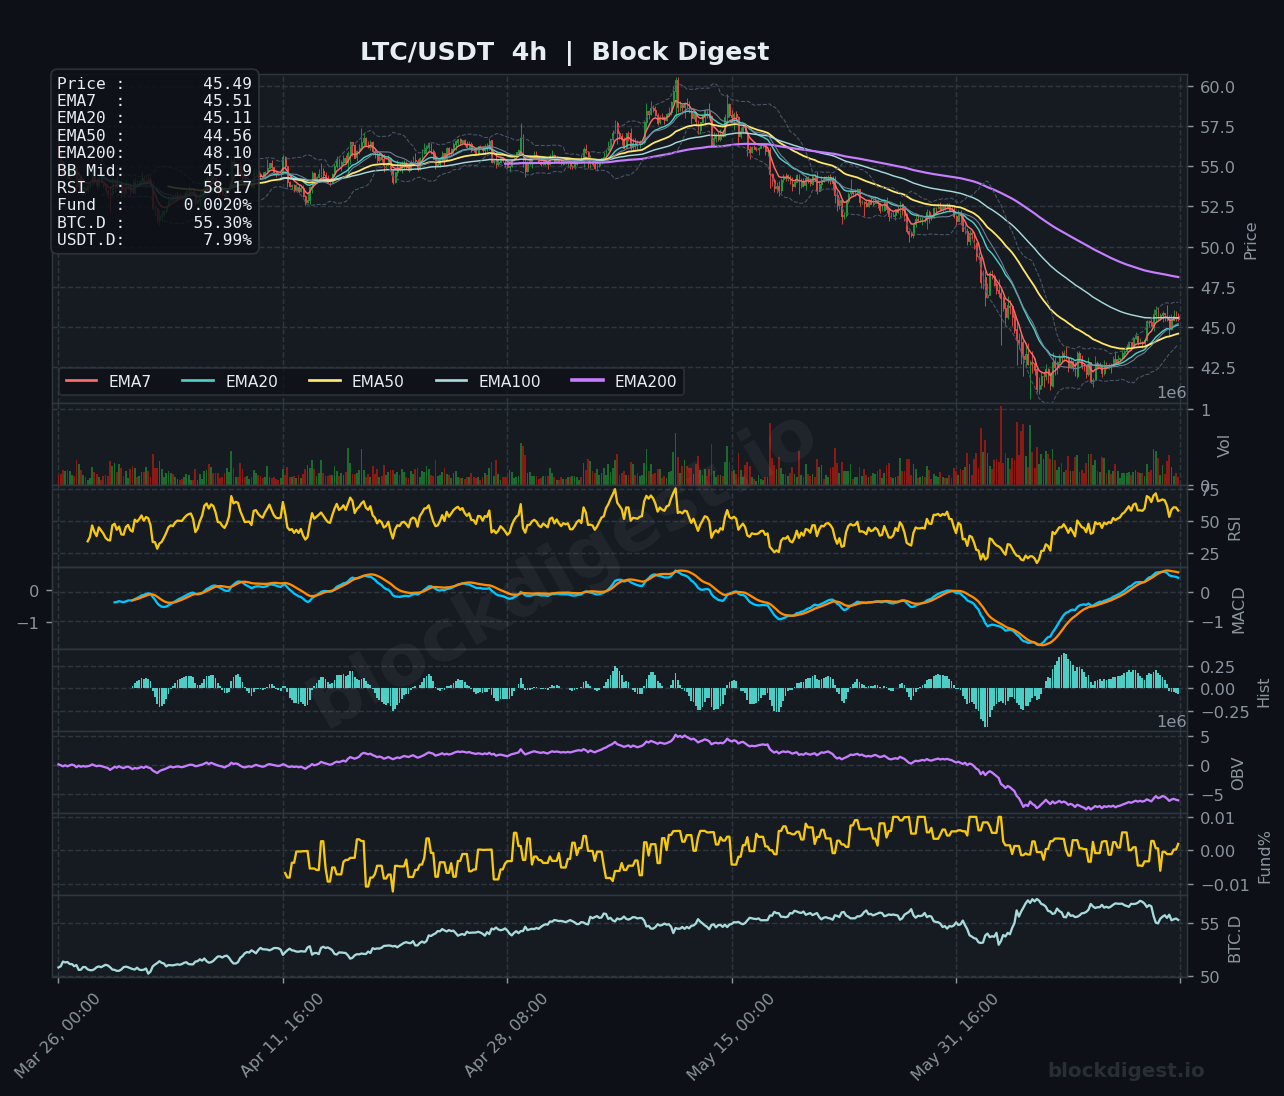
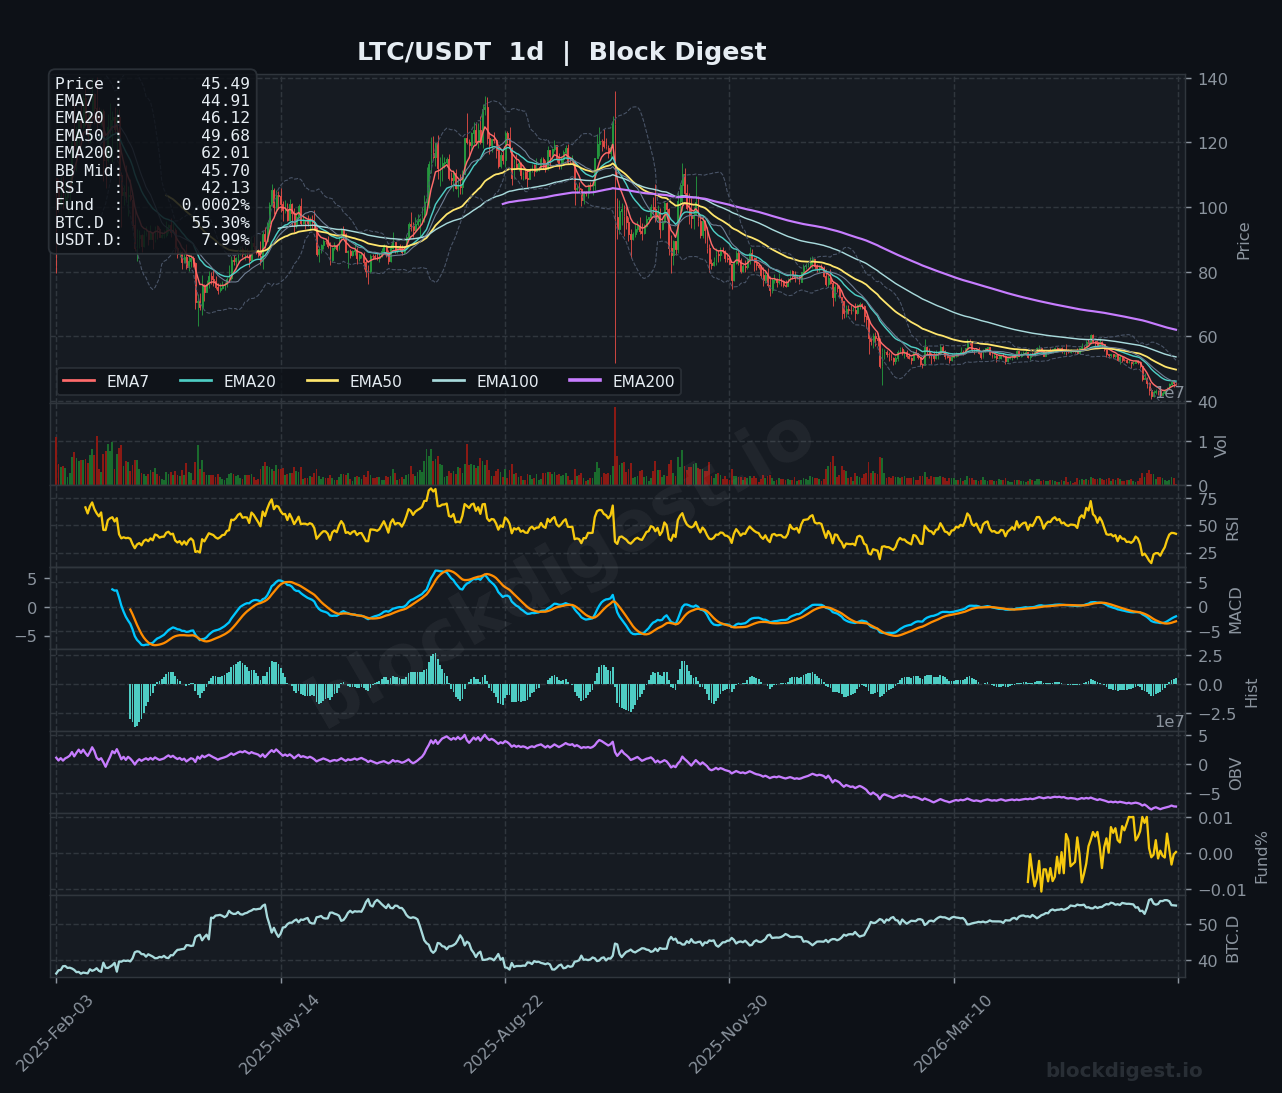
LTC is trading at $45.49, recovering from lows near $42 but now testing near-term resistance at the EMA7 ($45.60) and EMA20 ($45.58) on the 1h chart, with RSI at 48.02 hovering just below neutral. The 4h frame offers one of the more constructive signals in today’s review, with RSI at 58.17 above the midline and the MACD making a bullish crossover from deeply negative territory — evidence of genuine momentum recovery on the intermediate timeframe. However, the daily chart remains firmly bearish, with LTC trading below the EMA20 ($46.12), EMA50 ($49.68), and a distant EMA200 at $62.01, while the daily RSI at 42.13 and declining OBV indicate the macro trend has not yet reversed. The short-term bias tilts cautiously bullish given the 4h setup, but $47–$48 is firm resistance, and a failure there risks a re-test of the $42 support floor.
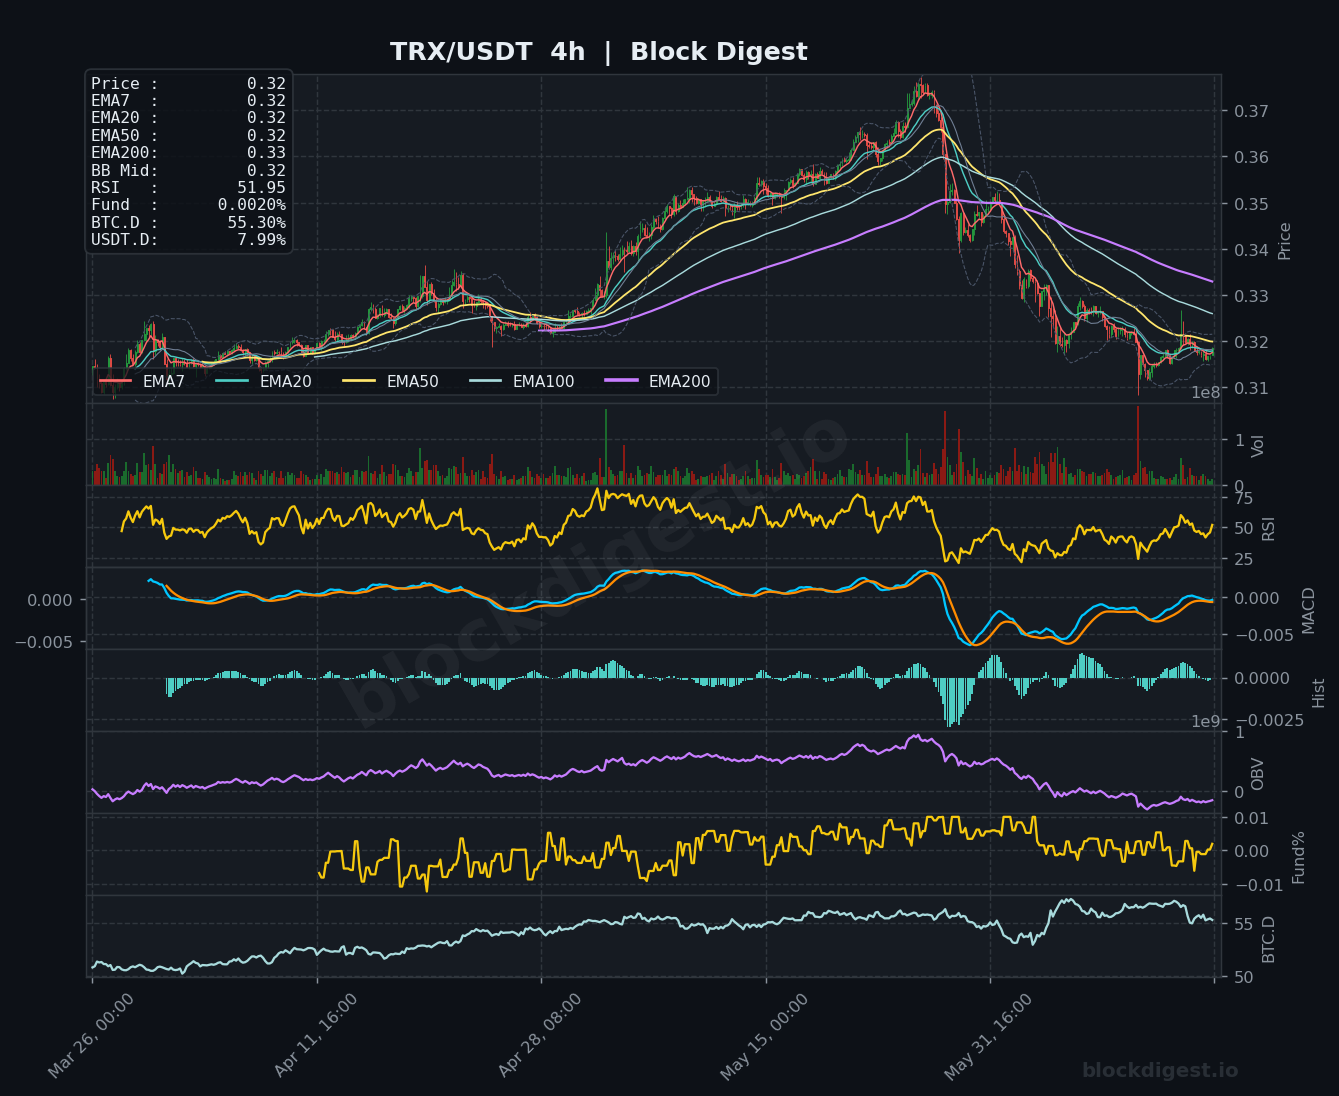
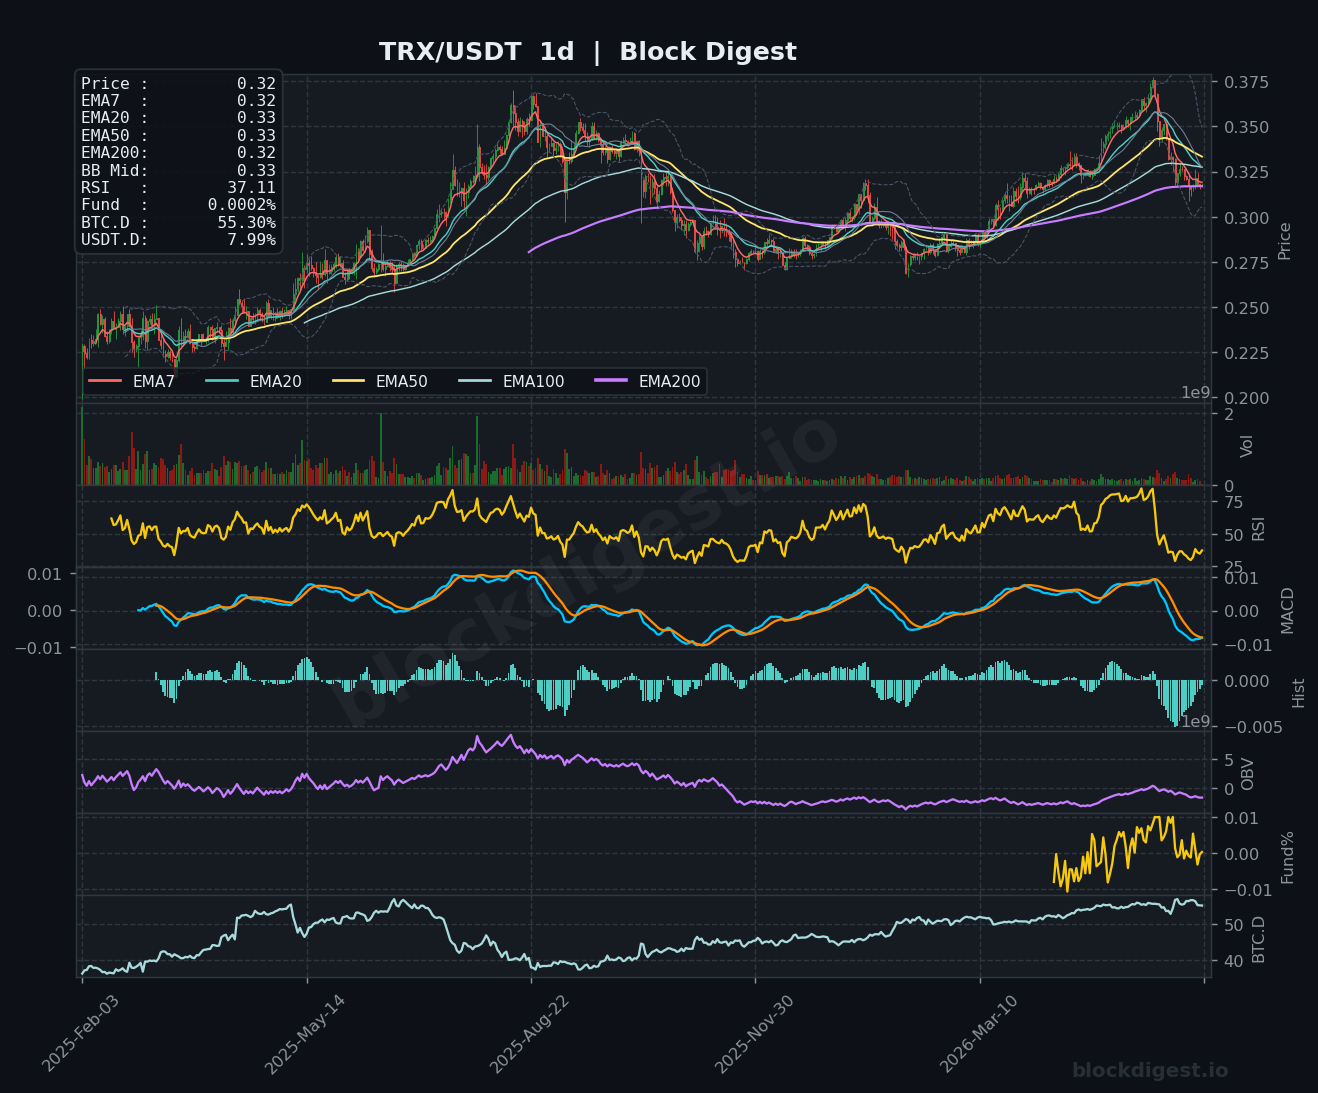
TRON (TRX)
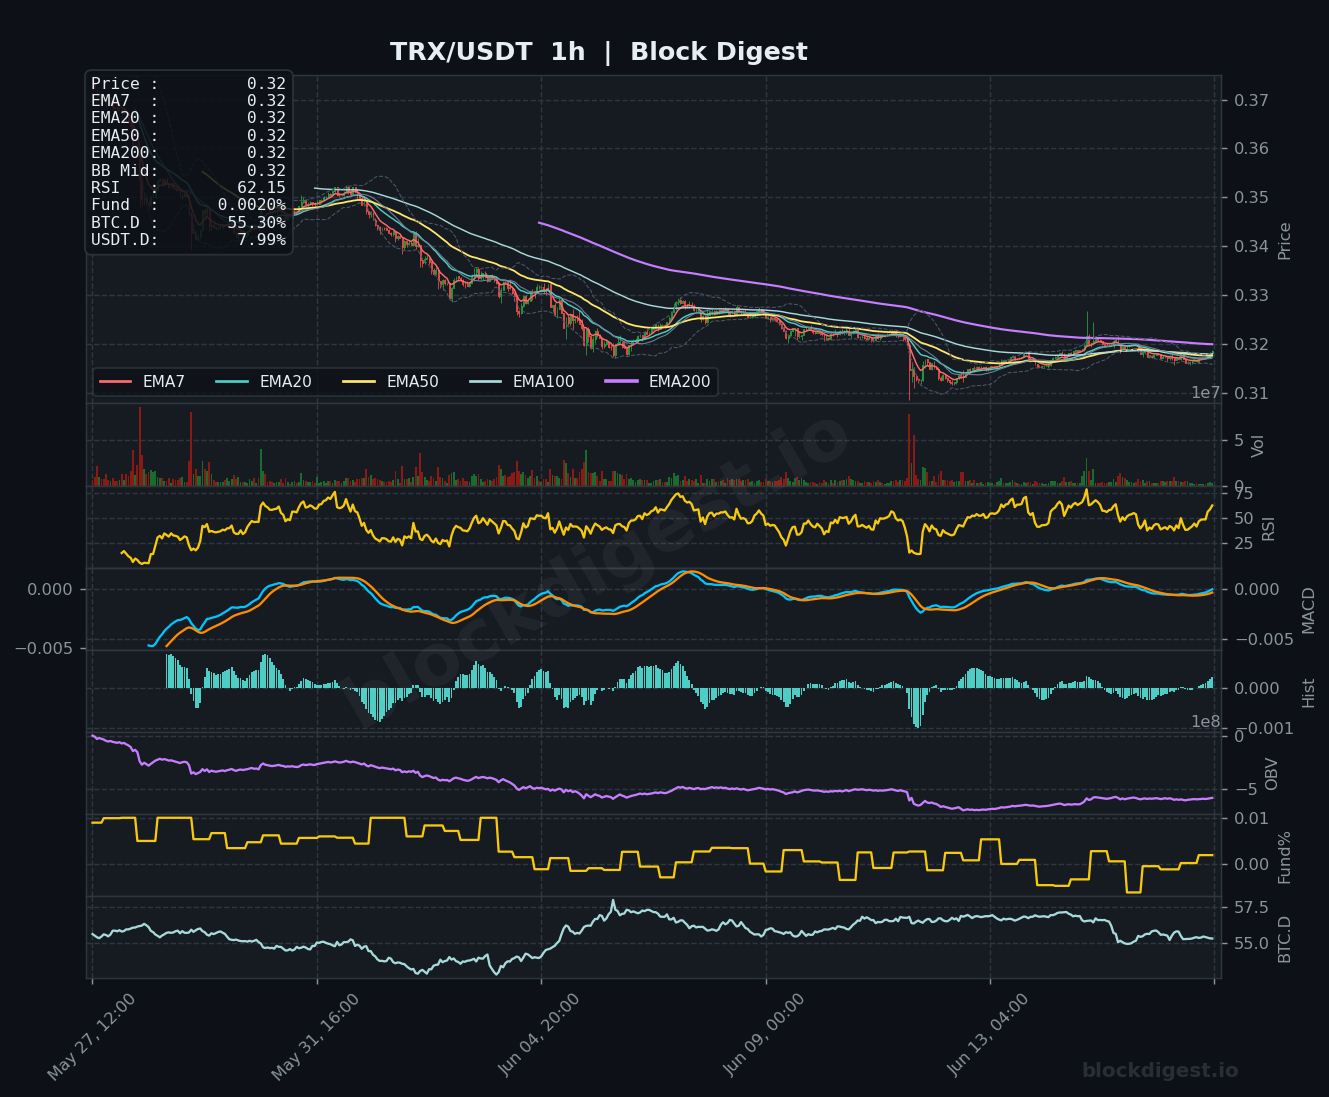
TRX is trading at $0.32, with all EMAs from EMA7 through EMA100 clustered tightly at the same $0.32 level on the 1h chart, indicating a similar consolidation pattern to DOGE but with a notably stronger 1h RSI reading of 62.15 — the highest RSI among all six assets reviewed today. The 4h chart shows TRX has declined sharply from its recent highs near $0.375, with the MACD recovering but still negative and RSI at 51.95, suggesting the intermediate trend is in a recovery attempt but not yet firmly bullish. On the daily, TRX’s RSI has dropped to 37.11 with the MACD crossing bearish and OBV showing a sustained downtrend since the recent peak, confirming that the macro structure has turned over. Key support lies at $0.310–$0.315, and the $0.33–$0.335 zone represents immediate overhead resistance where sellers have been active.
Altcoin Outlook
The broader altcoin market remains in a corrective phase as of June 17, 2026, with most major assets trading well below their macro EMAs and OBV trends confirming sustained distribution rather than accumulation across nearly all pairs reviewed. Among the six assets, Litecoin presents the strongest intermediate-term setup based on its 4h MACD crossover and RSI above 58, while TRX’s elevated 1h RSI offers a short-term speculative lean — though both are undermined by weak daily structures. DOGE and XRP show the most uniformly bearish configurations across all three timeframes, making them the least appealing for near-term long exposure. Traders should watch for a meaningful decline in BTC dominance below 54% and USDT.D softening below 7.5% as the key macro triggers that could catalyze a more sustained altcoin recovery.
Disclaimer: This analysis is for informational purposes only and does not constitute financial advice. Cryptocurrency markets are highly volatile and unpredictable. All trading decisions should be made based on your own research and risk tolerance. Block Digest is not responsible for any financial losses incurred as a result of acting on this content.