
Market Context
The broader altcoin market is operating under notable pressure as BTC dominance sits at 55.78%, reflecting continued capital concentration in Bitcoin at the expense of altcoin performance. USDT dominance at 8.19% remains elevated, signaling a cautious risk-off posture among market participants who are keeping a meaningful portion of capital sidelined. The overall technical picture across the altcoin complex points to a corrective phase following rallies earlier in the cycle, with most major alts trading well below their key daily EMAs and struggling to attract sustained buying volume.
Solana (SOL)
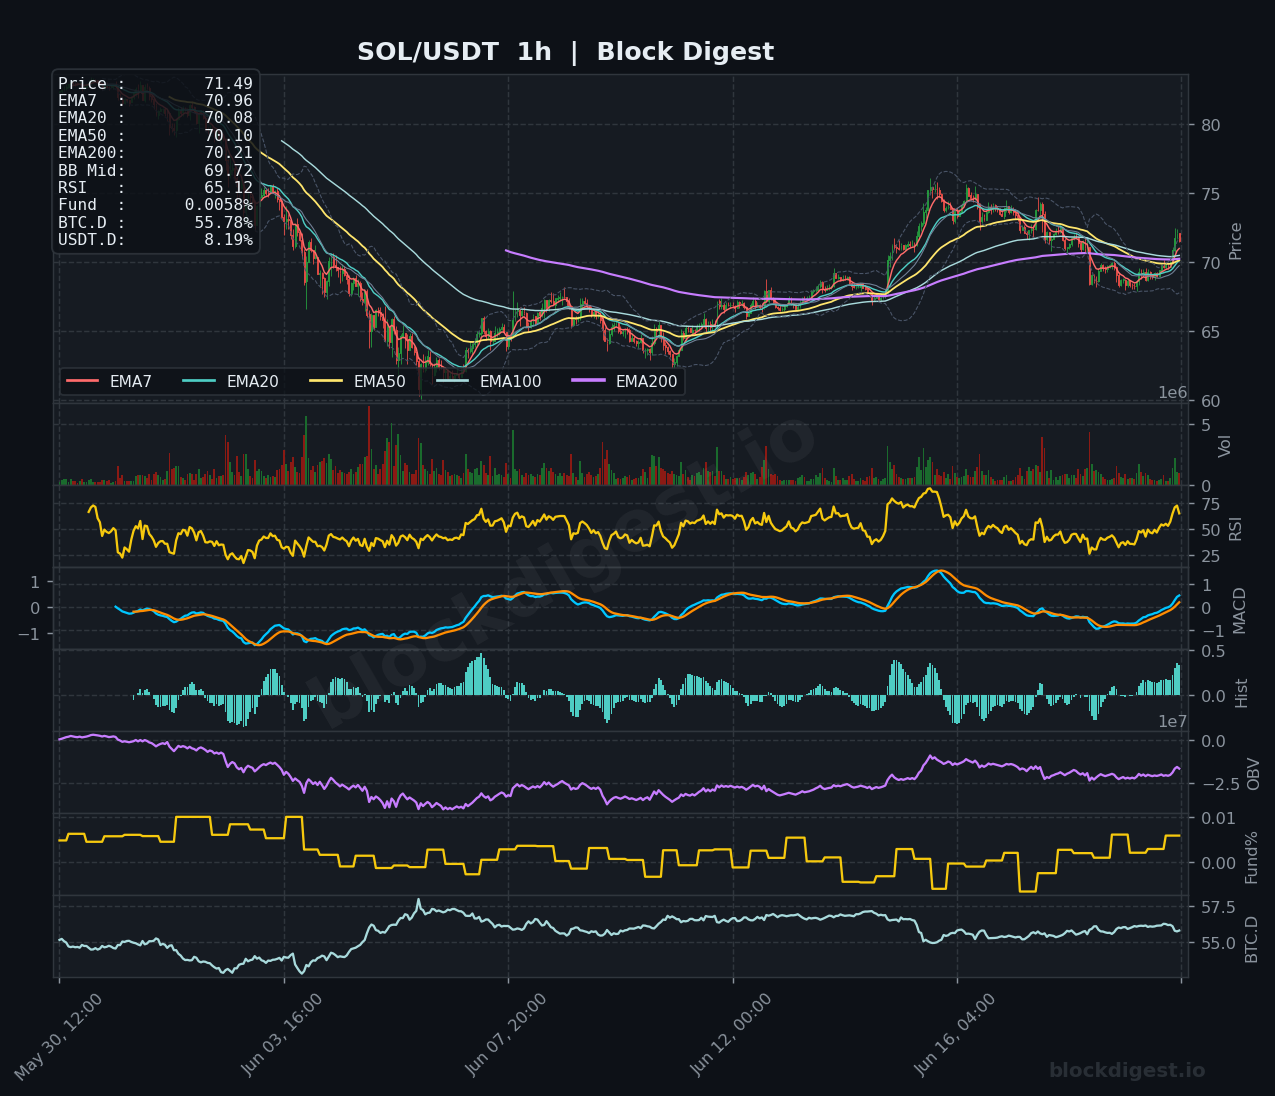
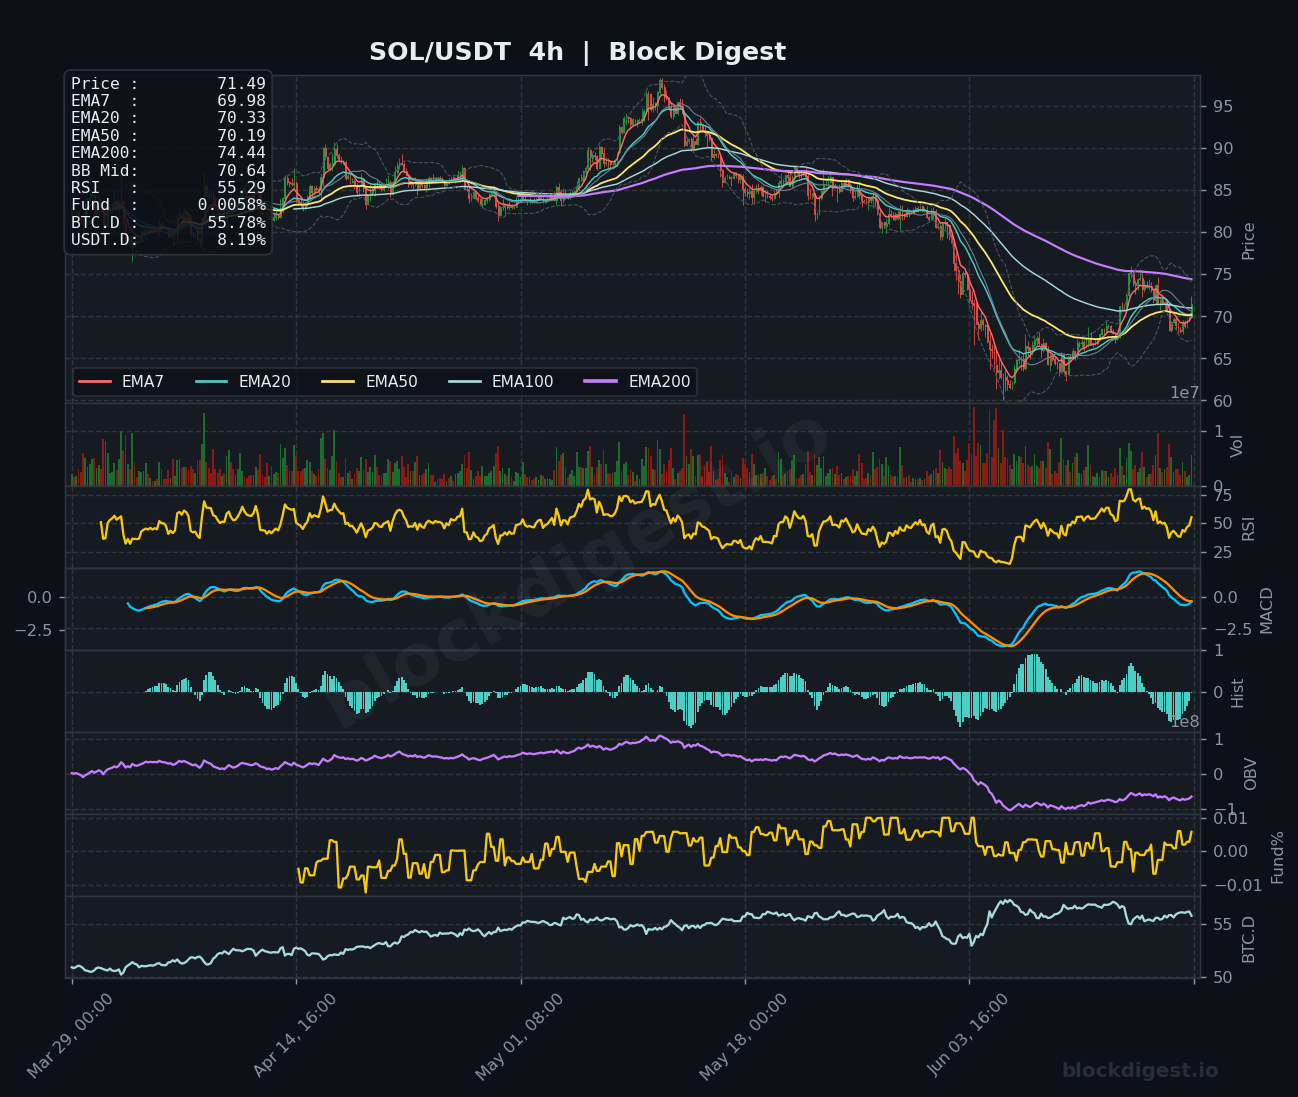
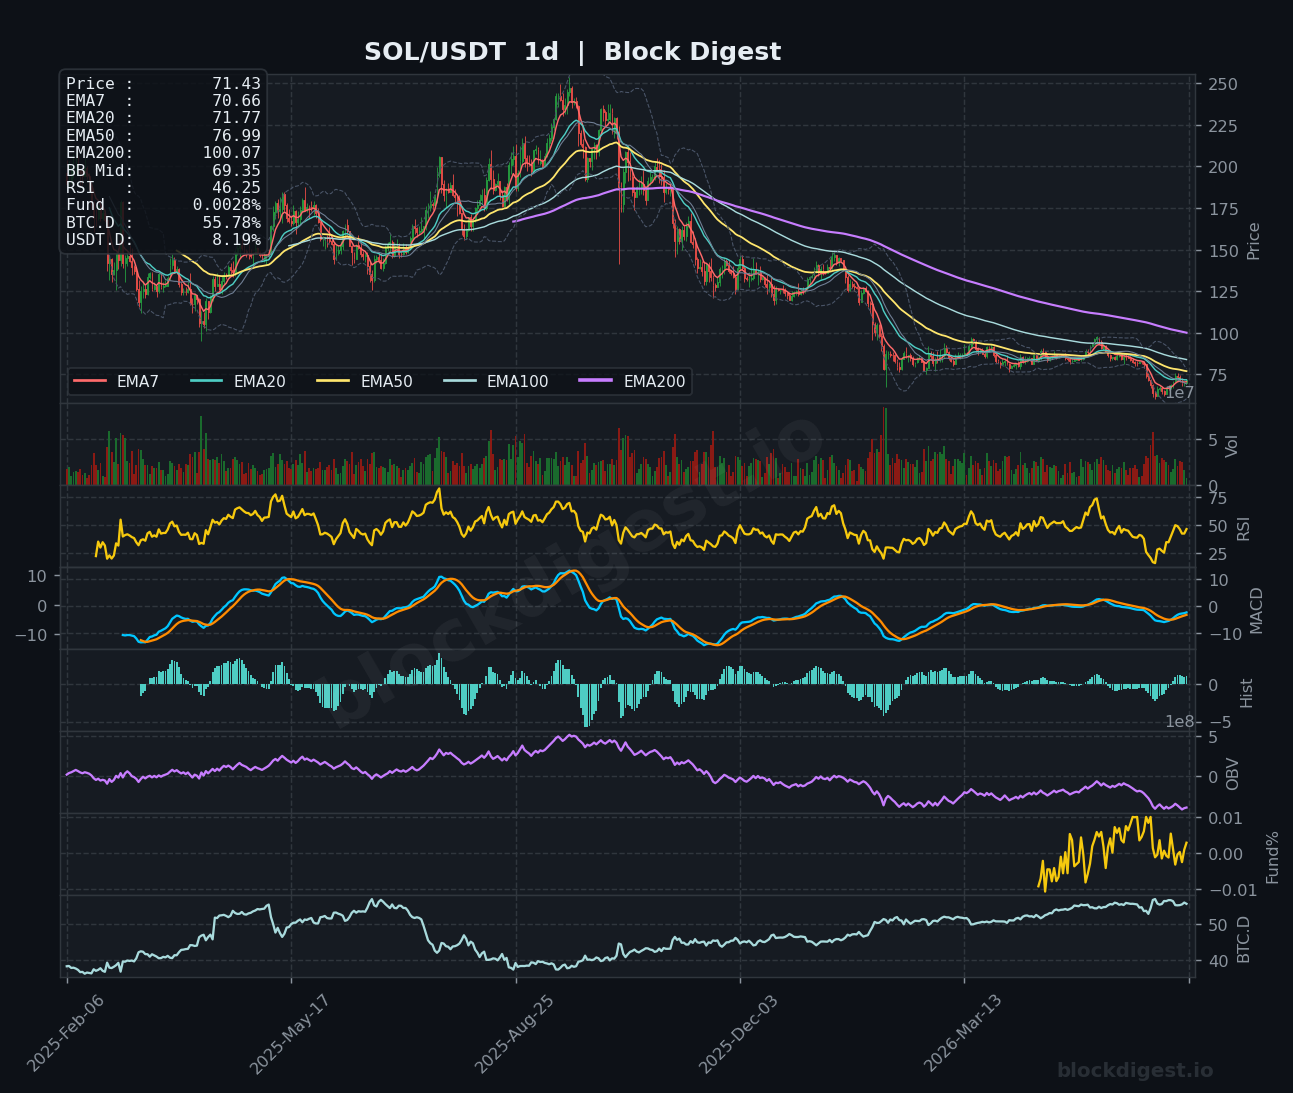
SOL is currently trading at $71.49, having staged a partial recovery from its recent lows near $65 but now consolidating tightly around its short-term EMAs, with the EMA7 at $70.96, EMA20 at $70.08, and EMA50 at $70.10 all clustered in a narrow band. On the 1-hour chart, RSI is at a relatively healthy 65.12 with MACD histogram turning positive, suggesting near-term momentum is cautiously bullish. However, the 4-hour and daily timeframes tell a more bearish structural story — the daily RSI sits at just 46.25, the price remains well below the daily EMA200 at $100.07, and the descending OBV confirms persistent distribution since the cycle top. A decisive reclaim of $75 is needed to shift the intermediate bias, while $68–$69 serves as immediate downside support.
XRP (XRP)
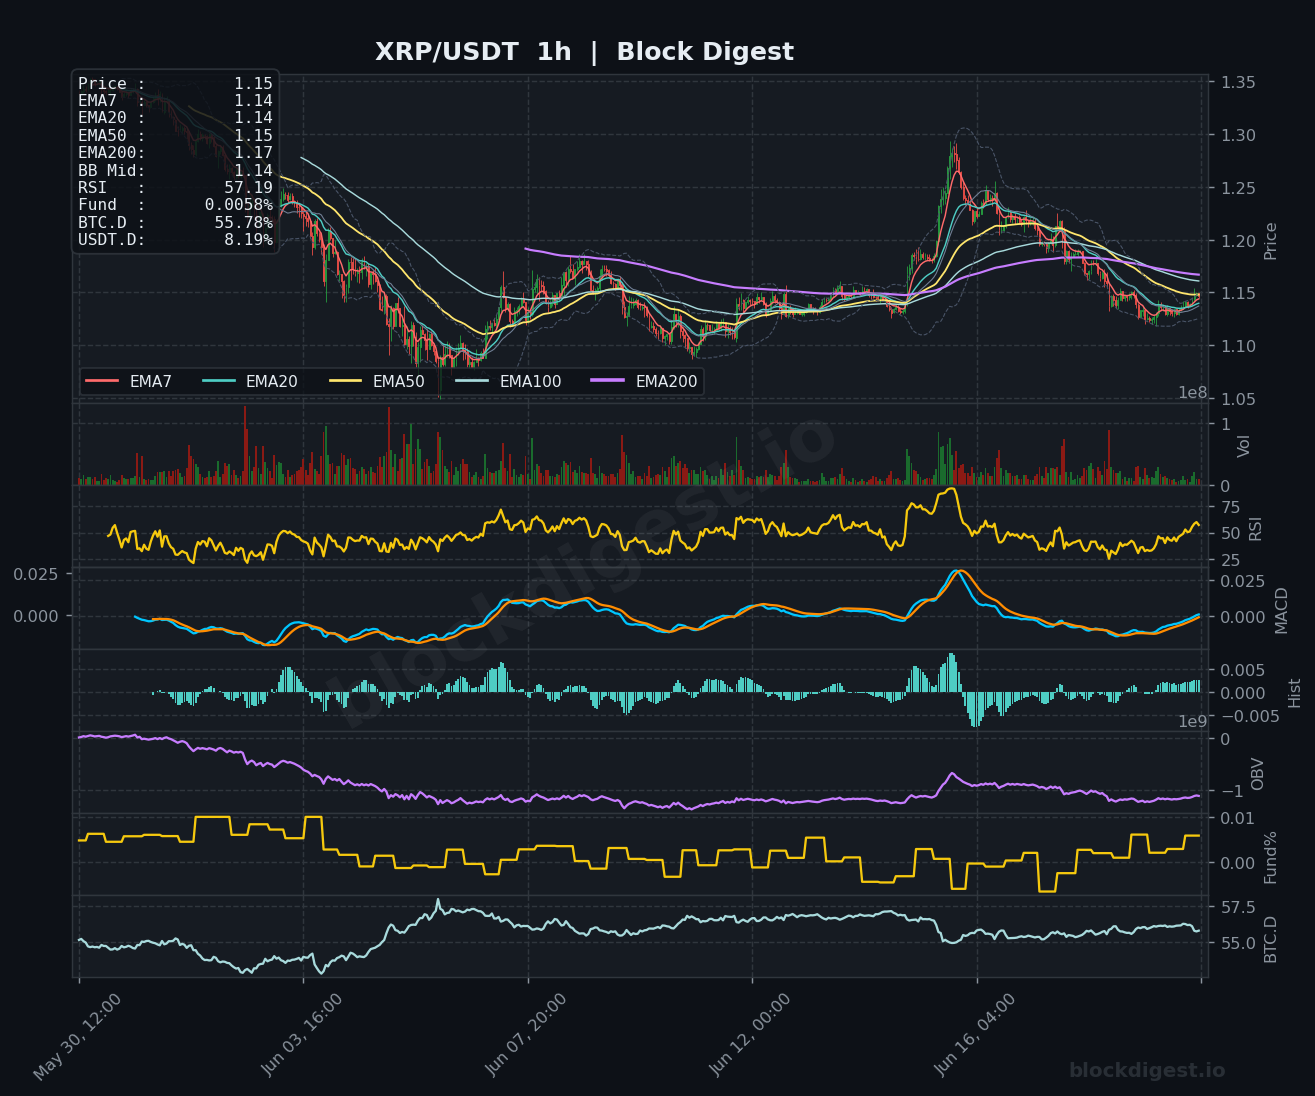
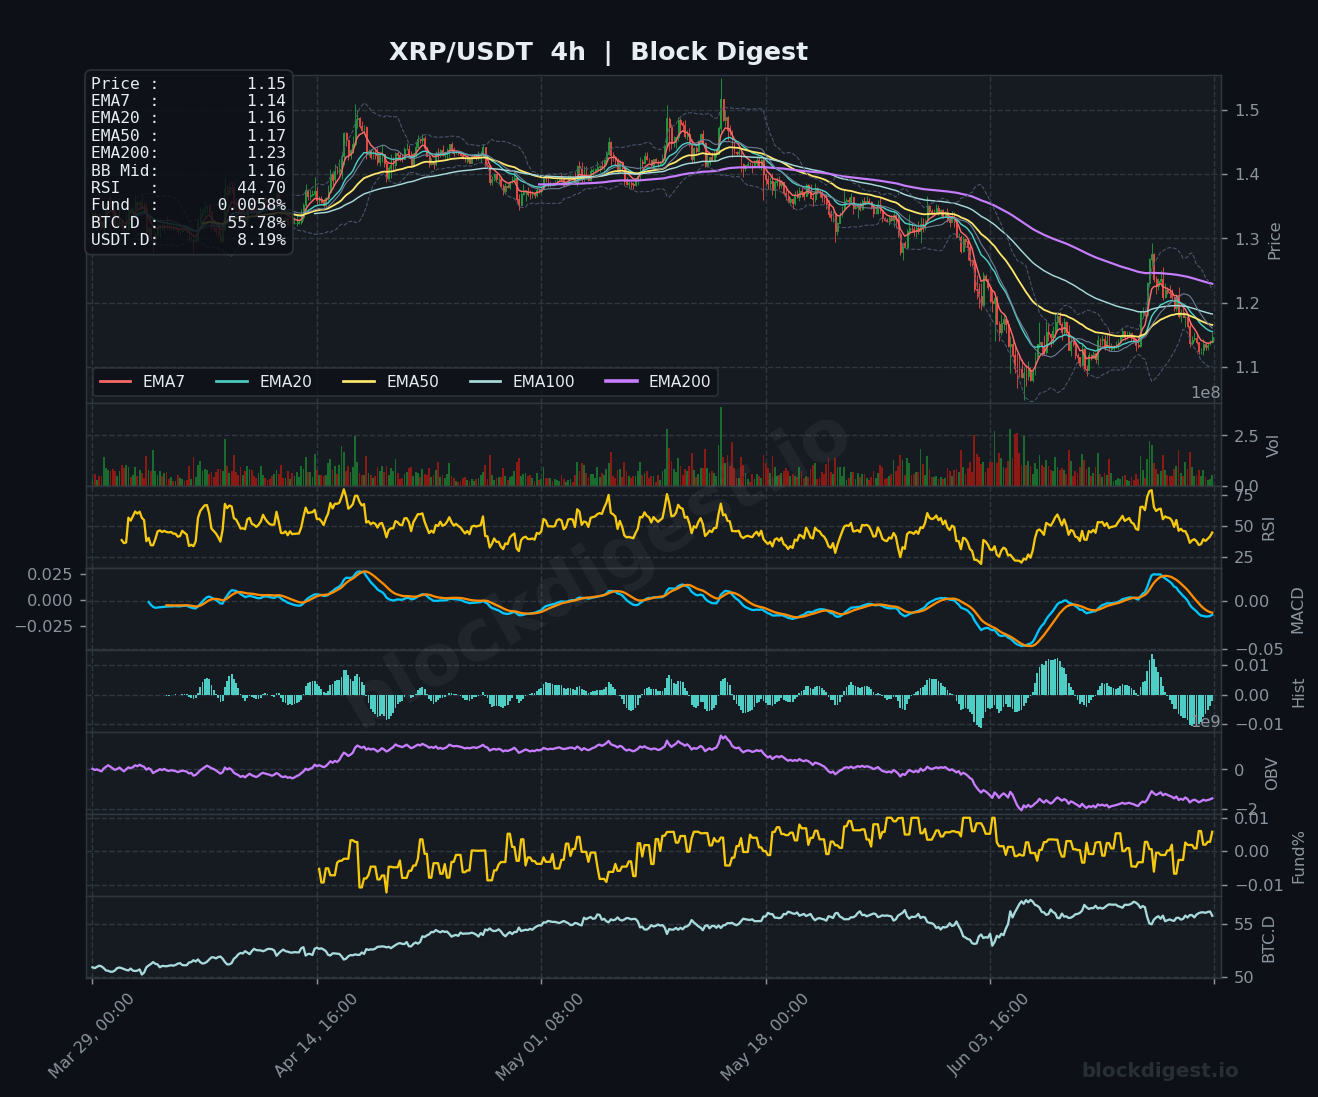
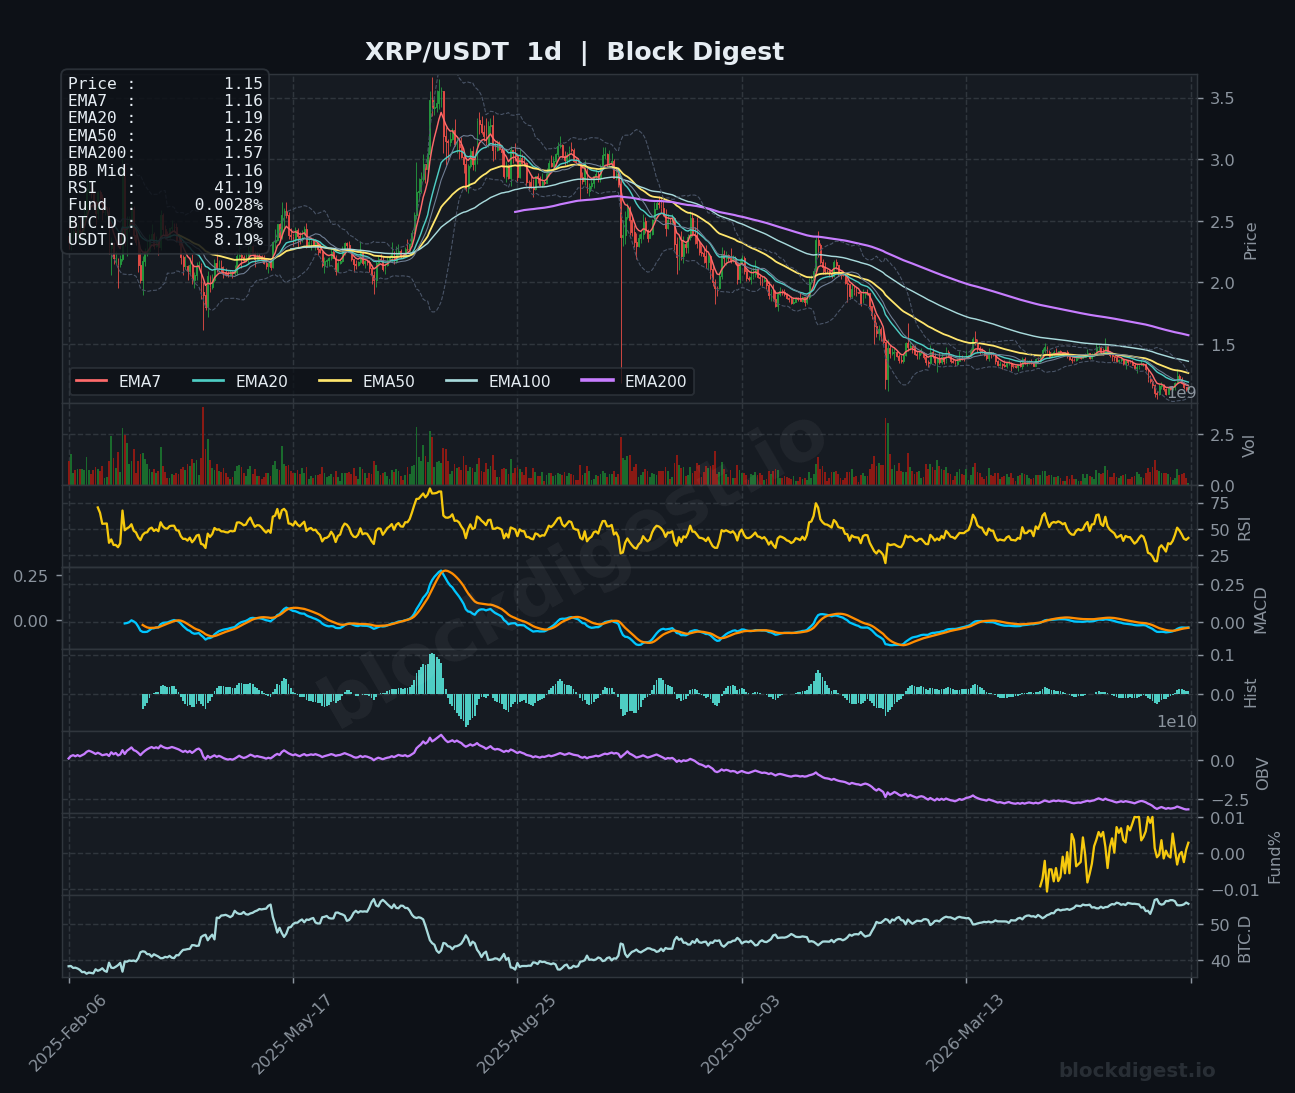
XRP is trading at $1.15, consolidating near its short-term EMA cluster after failing to hold above the $1.20–$1.30 range that briefly came into play during a mid-month spike. The 4-hour RSI at 44.70 and a bearish MACD crossover reflect fading momentum on the intermediate timeframe, while the daily RSI at 41.19 confirms the coin remains in a structurally weak position beneath all key daily EMAs — EMA20 at $1.19, EMA50 at $1.26, and EMA200 at $1.57. OBV on both the 4-hour and daily charts continues to trend lower, indicating sustained selling pressure rather than accumulation. Until XRP can reclaim and hold the $1.20 level with conviction, the path of least resistance remains to the downside, with $1.10 as the next meaningful support zone.
BNB (BNB)
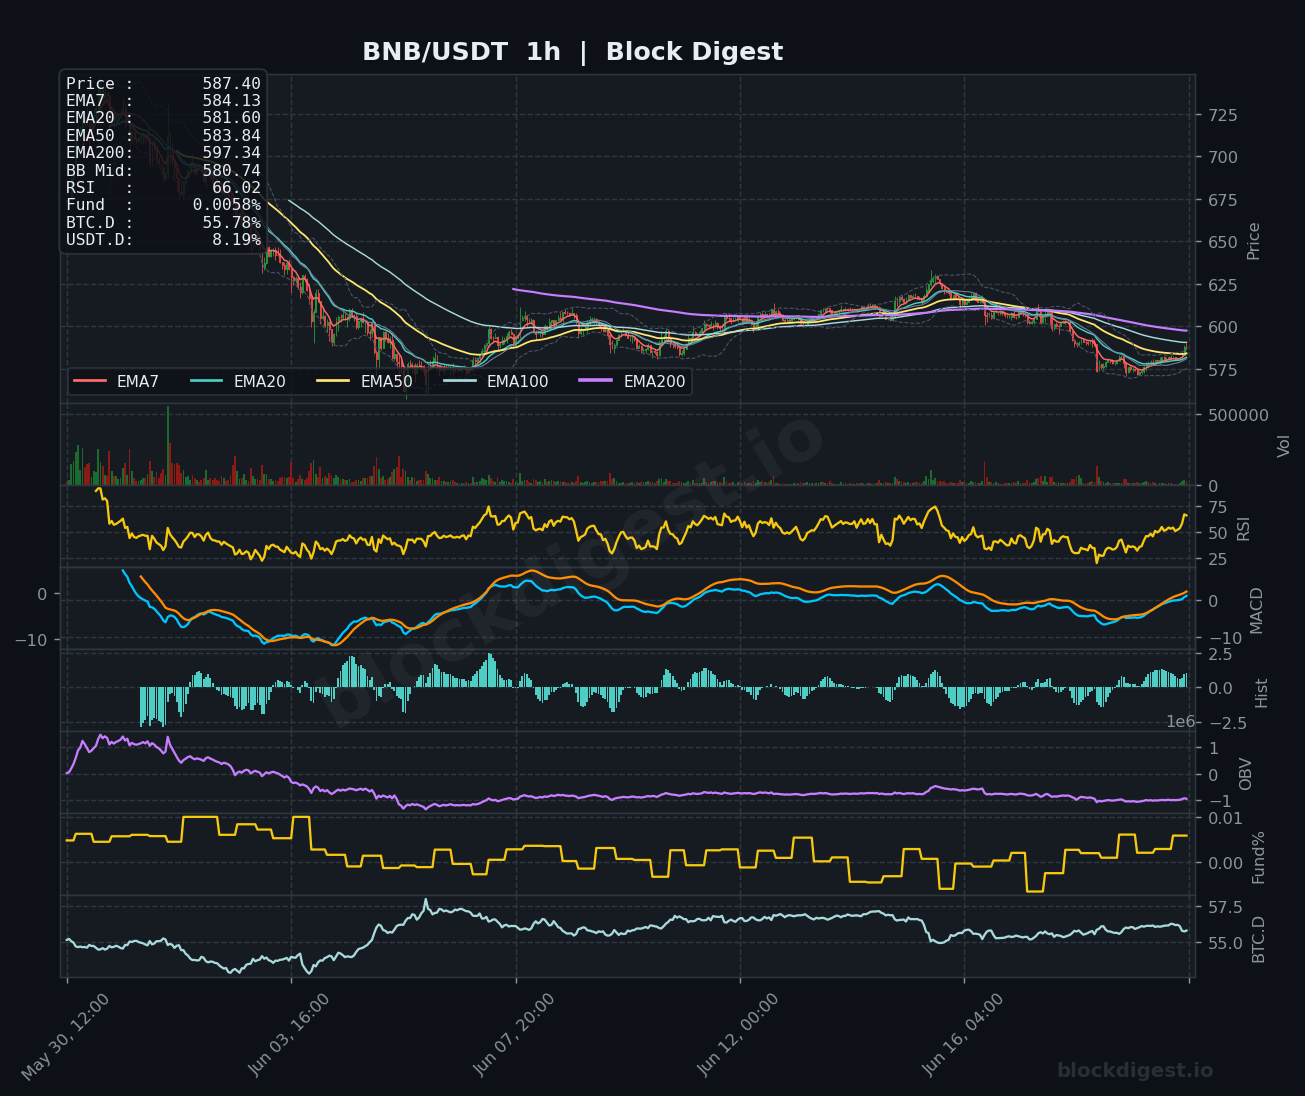
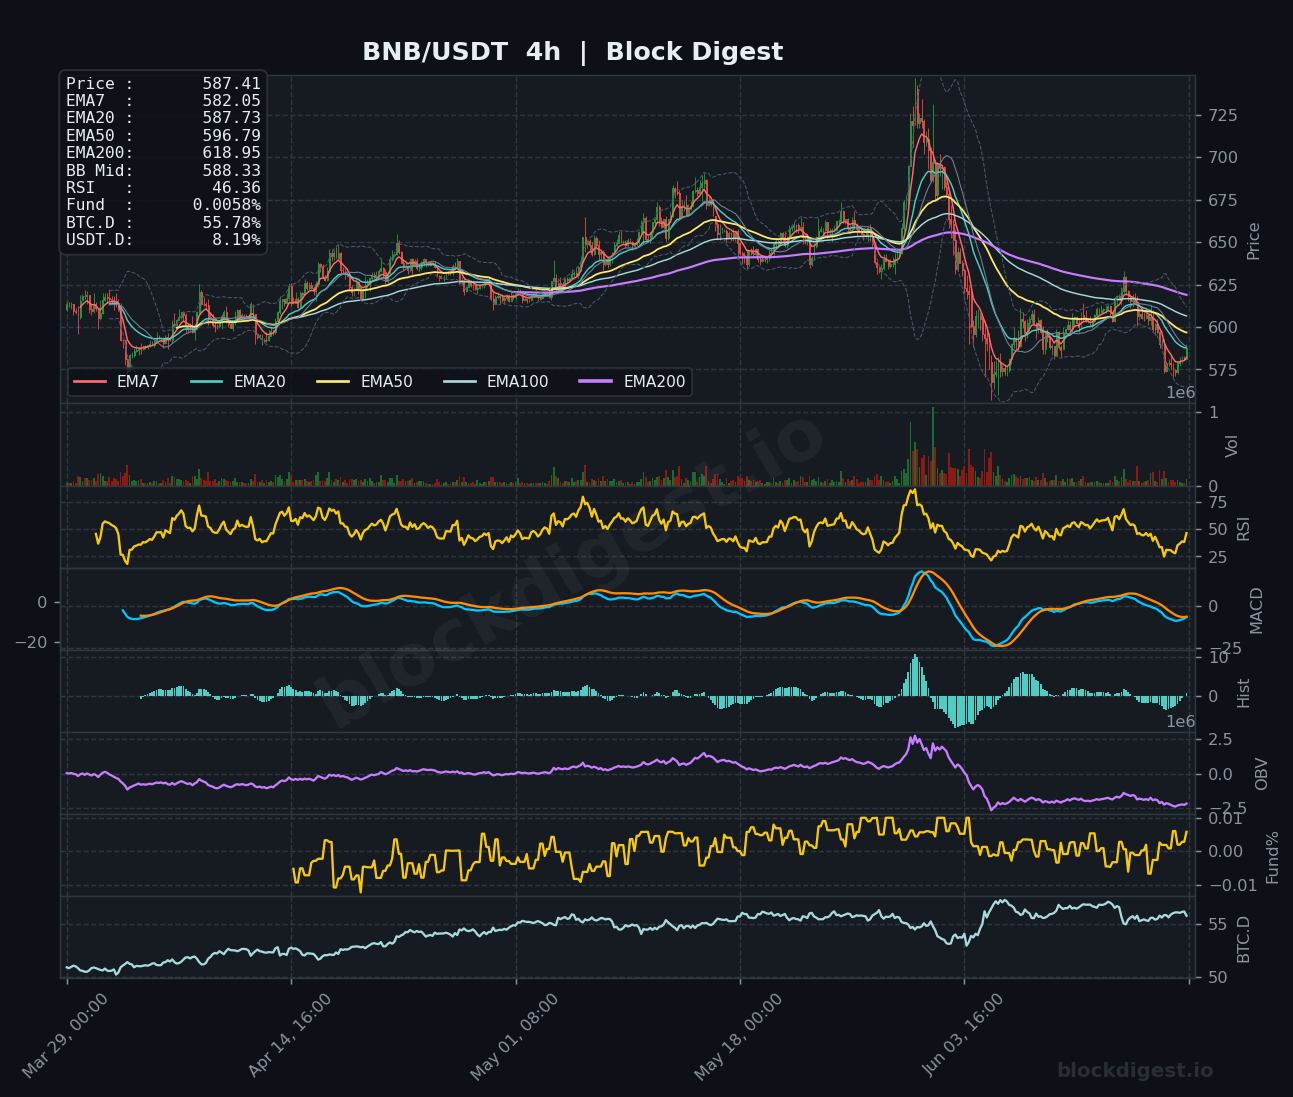
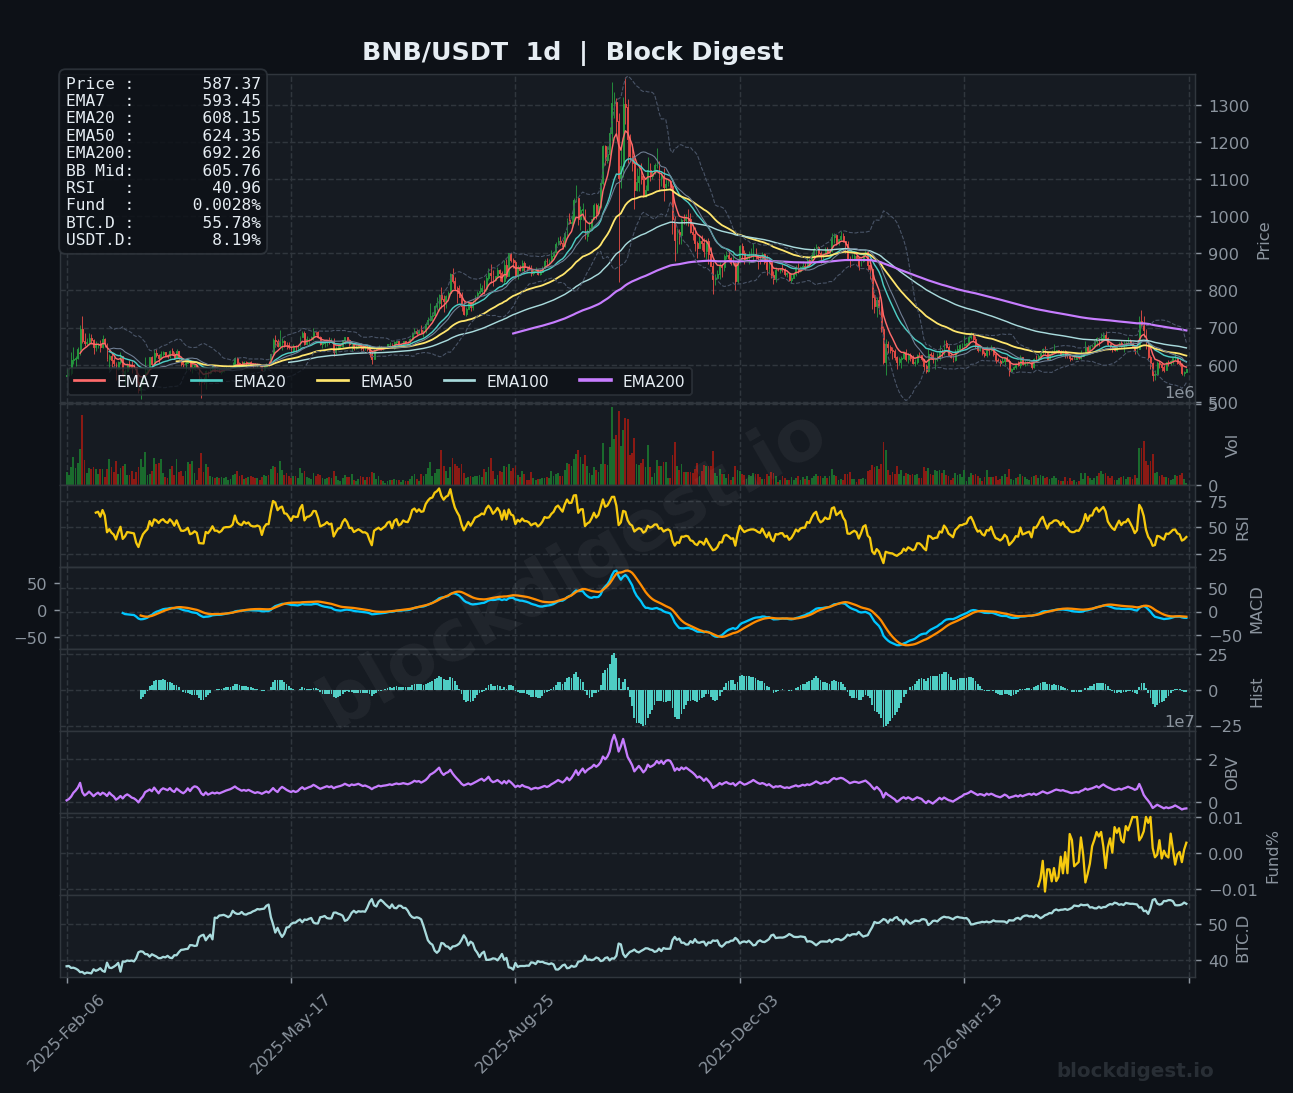
BNB is currently priced at $587.40, holding above the $575 support area but trading beneath its 4-hour EMA200 at $618.95 and daily EMA200 at $692.26, reflecting the significant structural damage inflicted by the sharp sell-off from the $725 highs. The 1-hour RSI at 66.02 and a rising MACD histogram on the shorter timeframe suggest a short-term bounce is in progress, though the 4-hour RSI at 46.36 and daily RSI at 40.96 indicate this move lacks conviction on higher timeframes. The daily OBV has rolled over sharply following the peak, confirming heavy net outflows. Resistance sits at $600–$610, aligned with the 4-hour BB midline at $588 and EMA20; a failure to break above $610 would keep the near-term bias firmly bearish.
Dogecoin (DOGE)
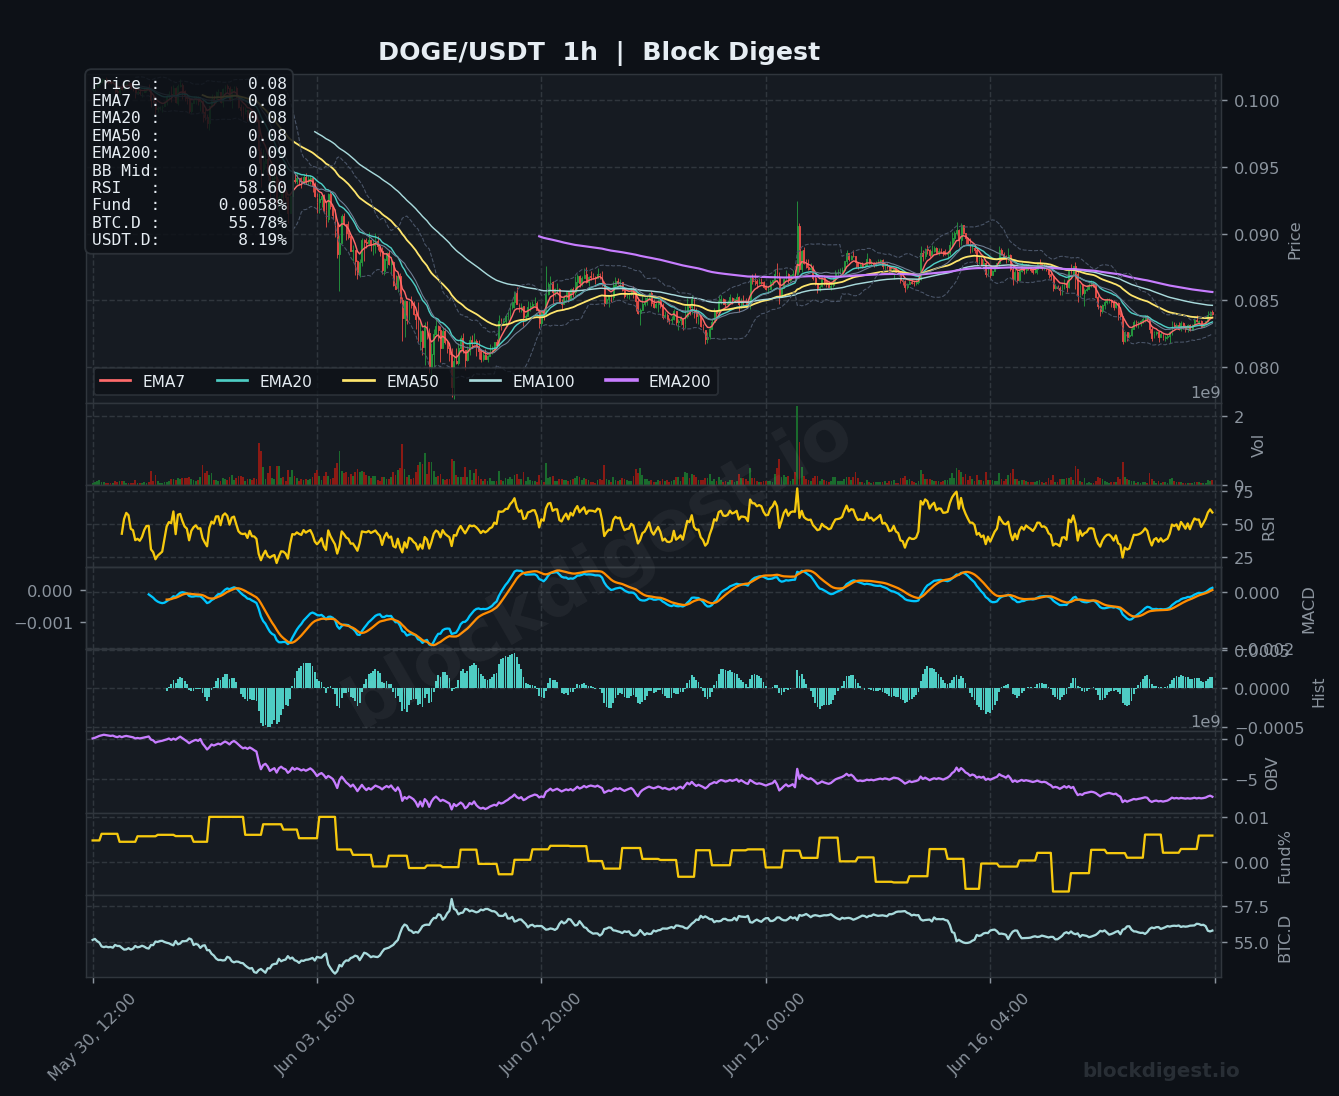
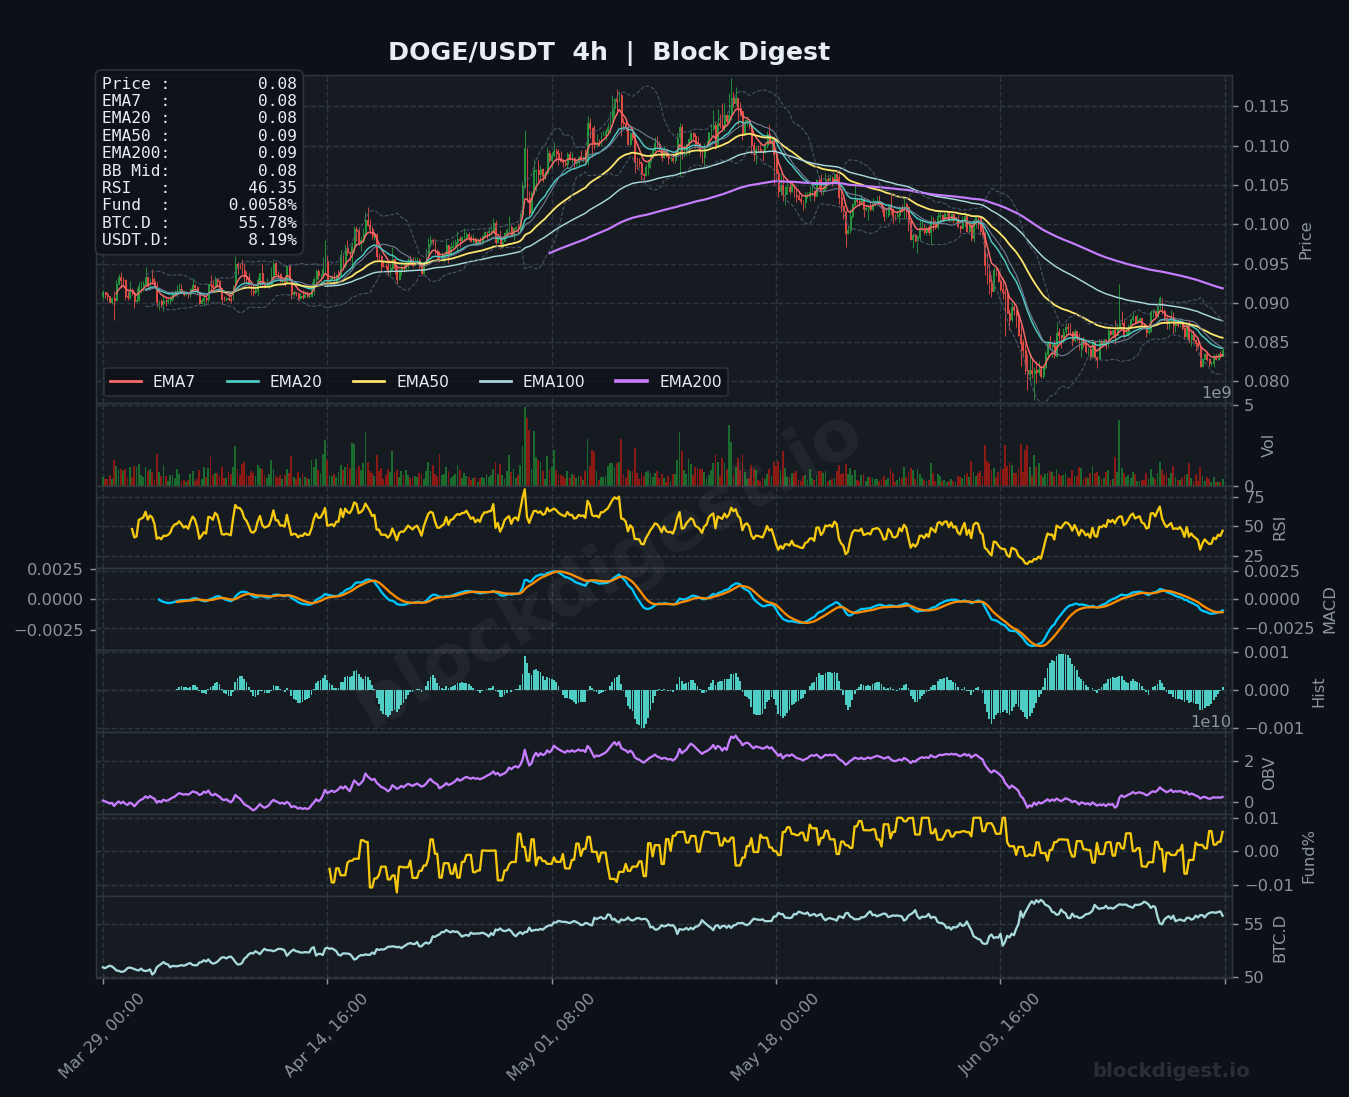
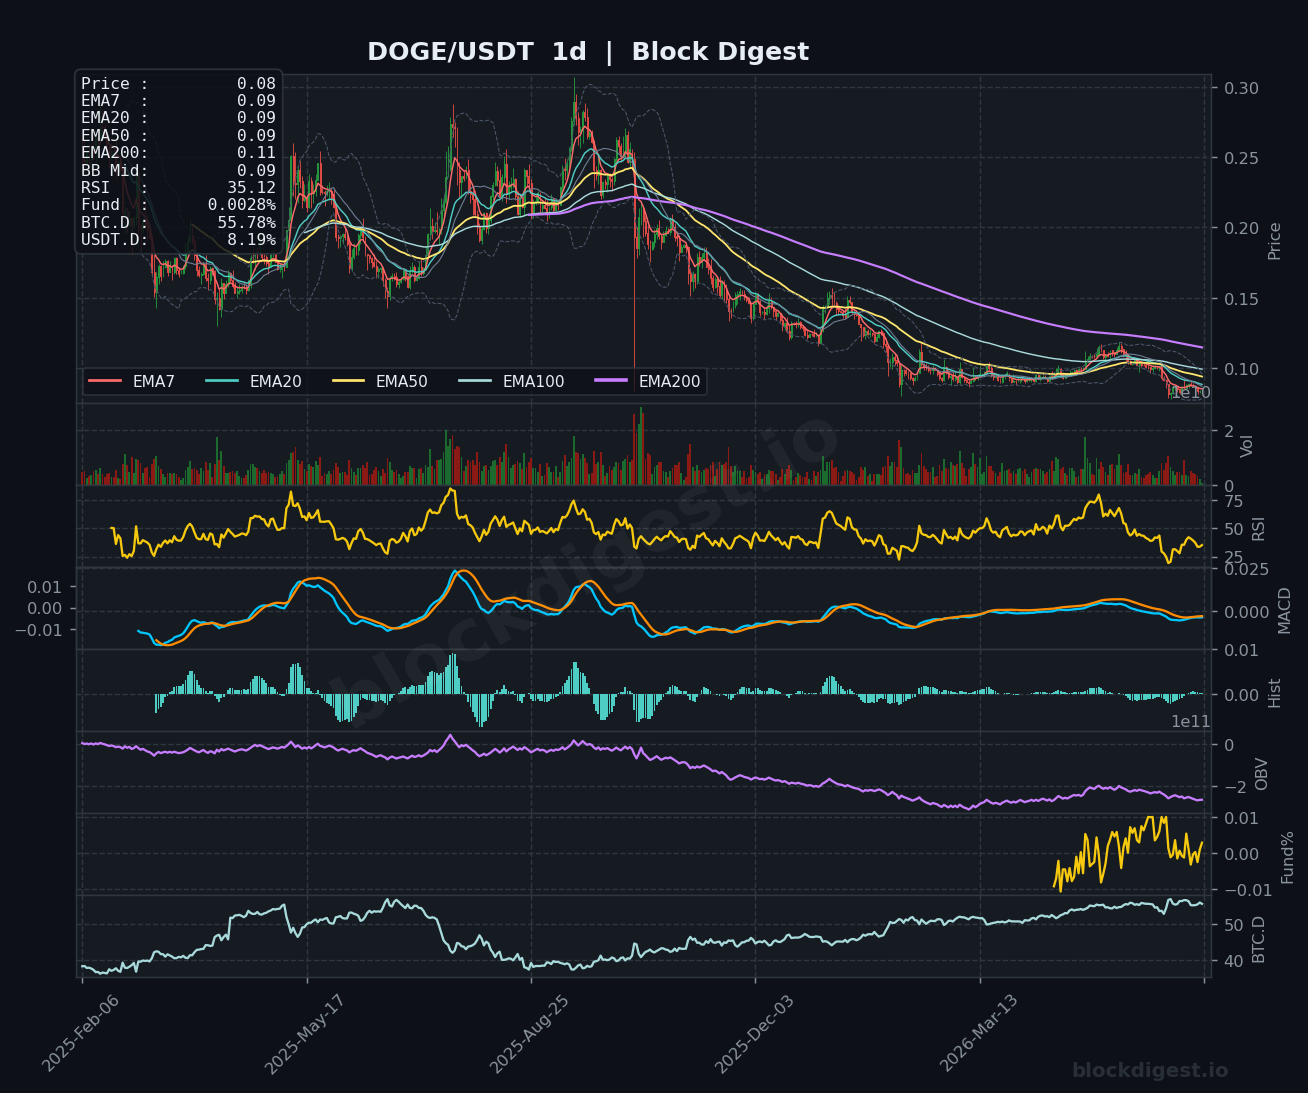
DOGE is trading at $0.0800, consolidating at multi-month lows in a tight range after an extended downtrend from the $0.115 highs. The 1-hour RSI at 58.60 reflects a mild short-term recovery attempt, but the 4-hour RSI at 46.35 and daily RSI at just 35.12 paint a deeply bearish structural picture with the daily MACD still in negative territory and histogram showing minimal recovery momentum. All daily EMAs — EMA7 at $0.09, EMA20 at $0.09, EMA50 at $0.09, and EMA200 at $0.11 — are stacked above current price, acting as a ceiling of resistance. OBV on the daily continues its persistent downtrend, signaling ongoing distribution, and DOGE presents the weakest technical setup of this week’s watchlist with $0.080 acting as the last meaningful support before a potential test of $0.075.
Litecoin (LTC)
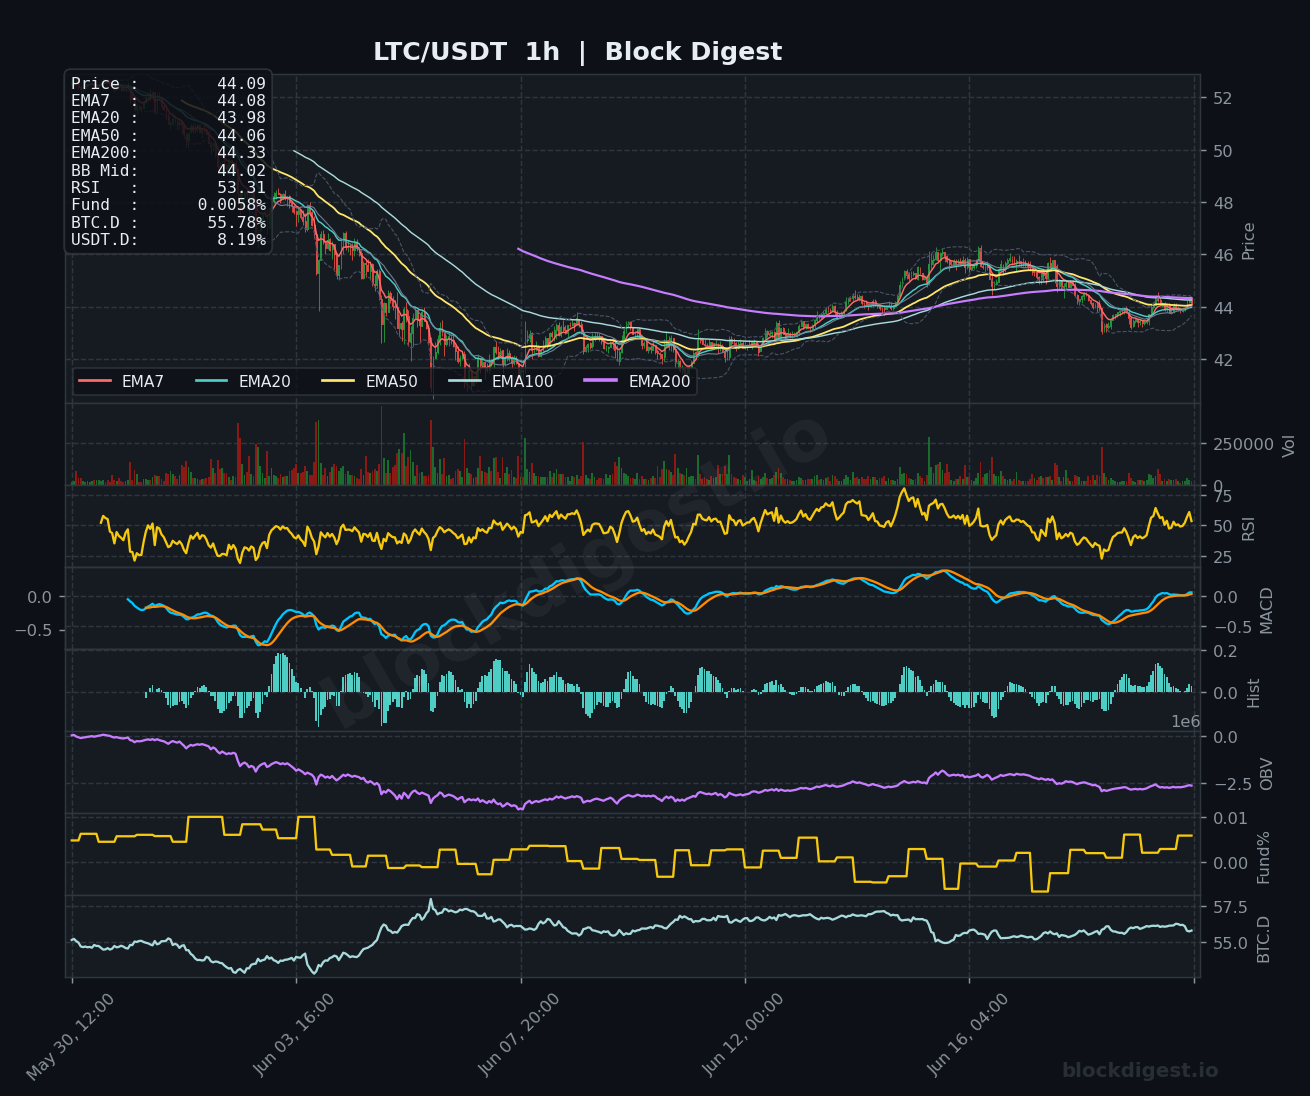
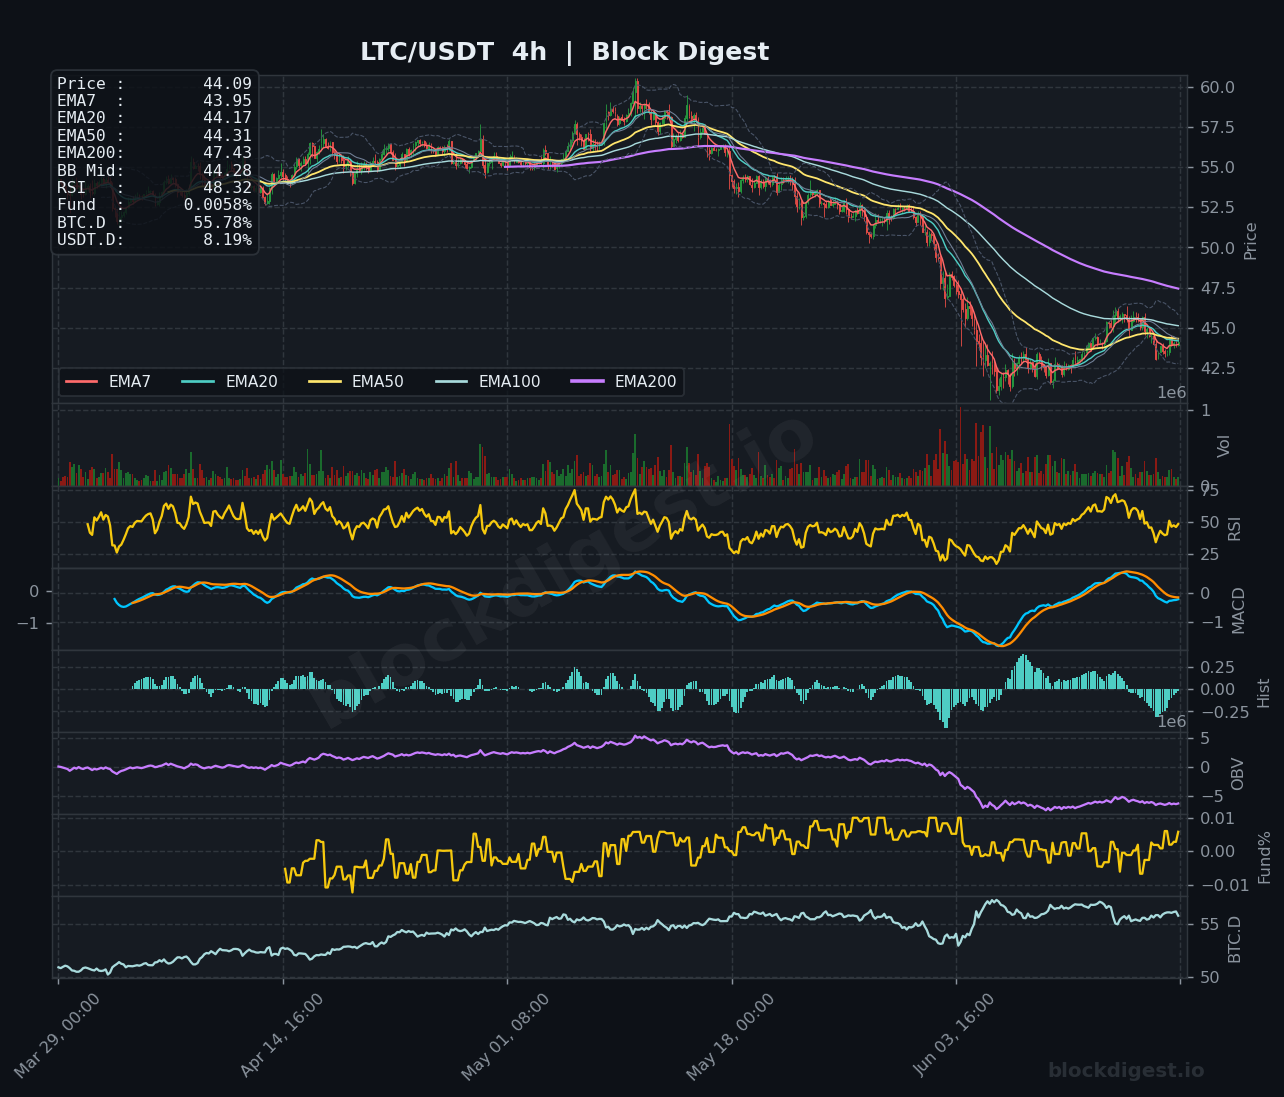
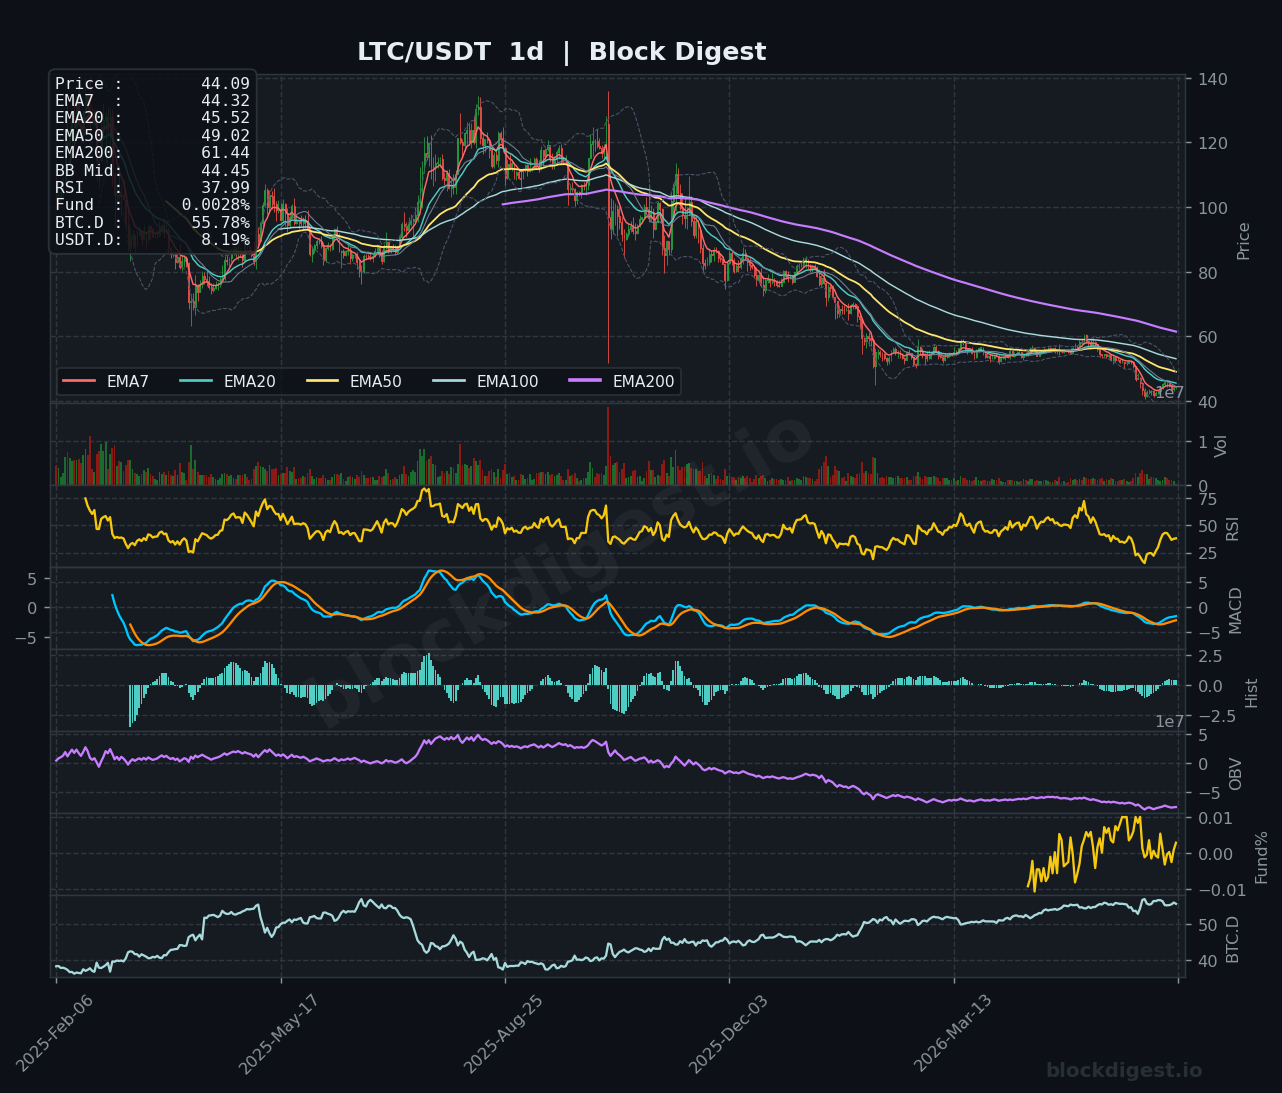
LTC is trading at $44.09, hovering just above its 1-hour BB midline at $44.02 and EMA cluster, suggesting a tentative equilibrium after a sharp decline from the $57–$60 range. The 1-hour RSI at 53.31 and an approaching MACD zero-line crossover point to mild near-term stabilization, though the 4-hour RSI at 48.32 and daily RSI at 37.99 highlight that the broader trend remains bearish. The daily EMA structure is uniformly bearish — EMA7 at $44.32, EMA20 at $45.52, EMA50 at $49.02, and EMA200 at $61.44 — with price trading at the bottom of all these levels. Daily OBV is at its lowest reading in the current cycle period, confirming relentless sell pressure. Key support lies at $42–$43, while reclaiming $46 would be the first hurdle for any meaningful recovery attempt.
TRON (TRX)
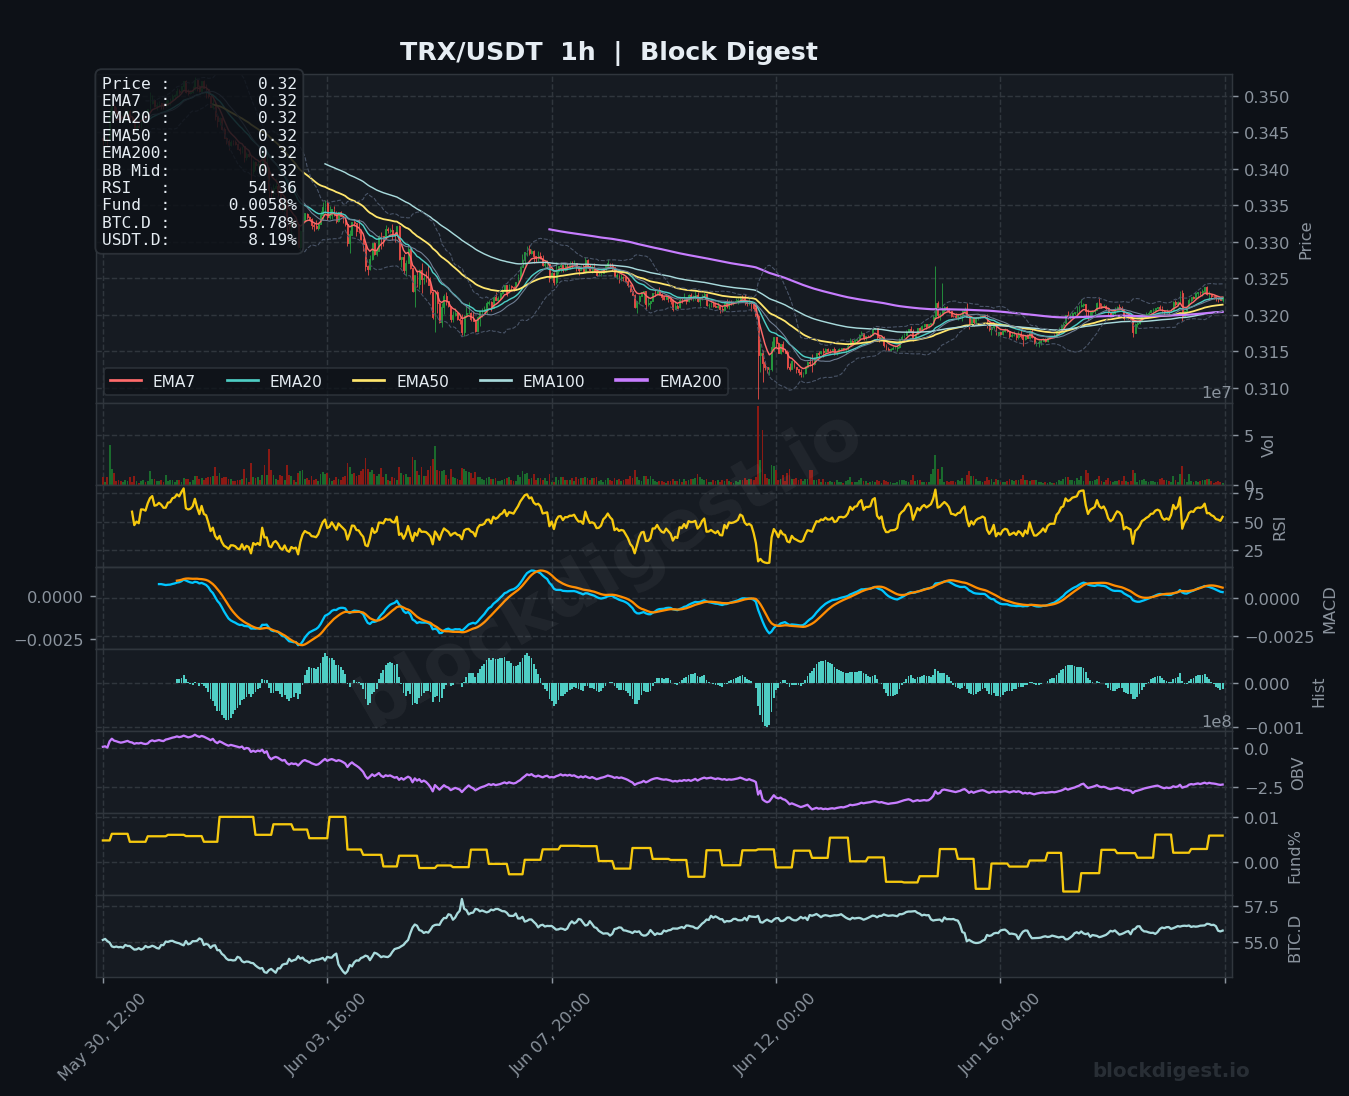
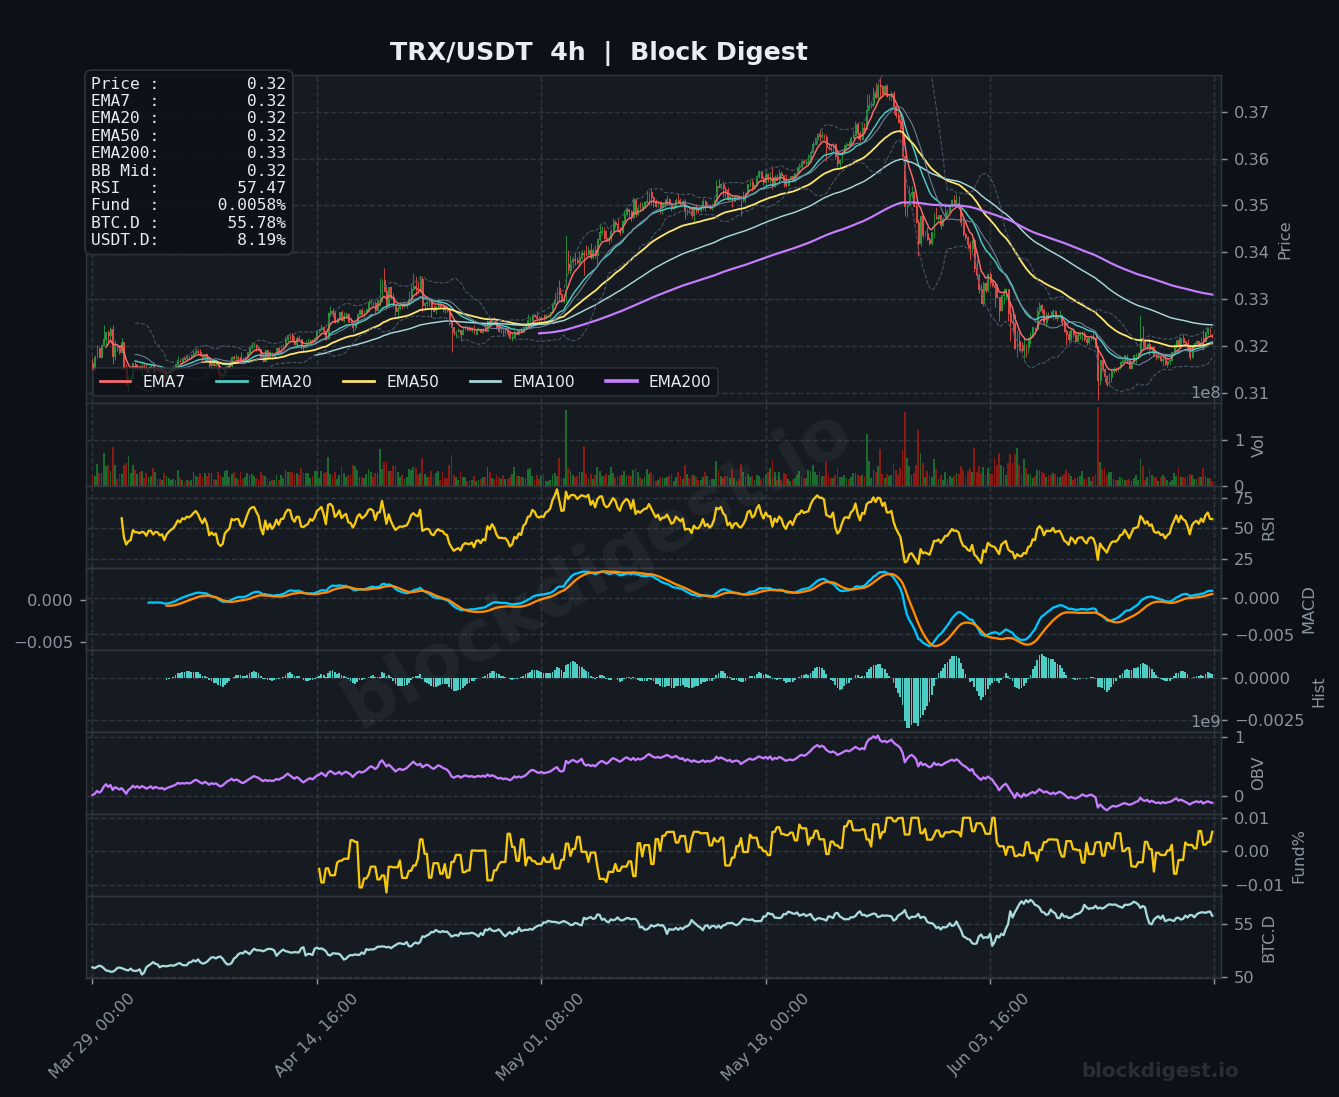
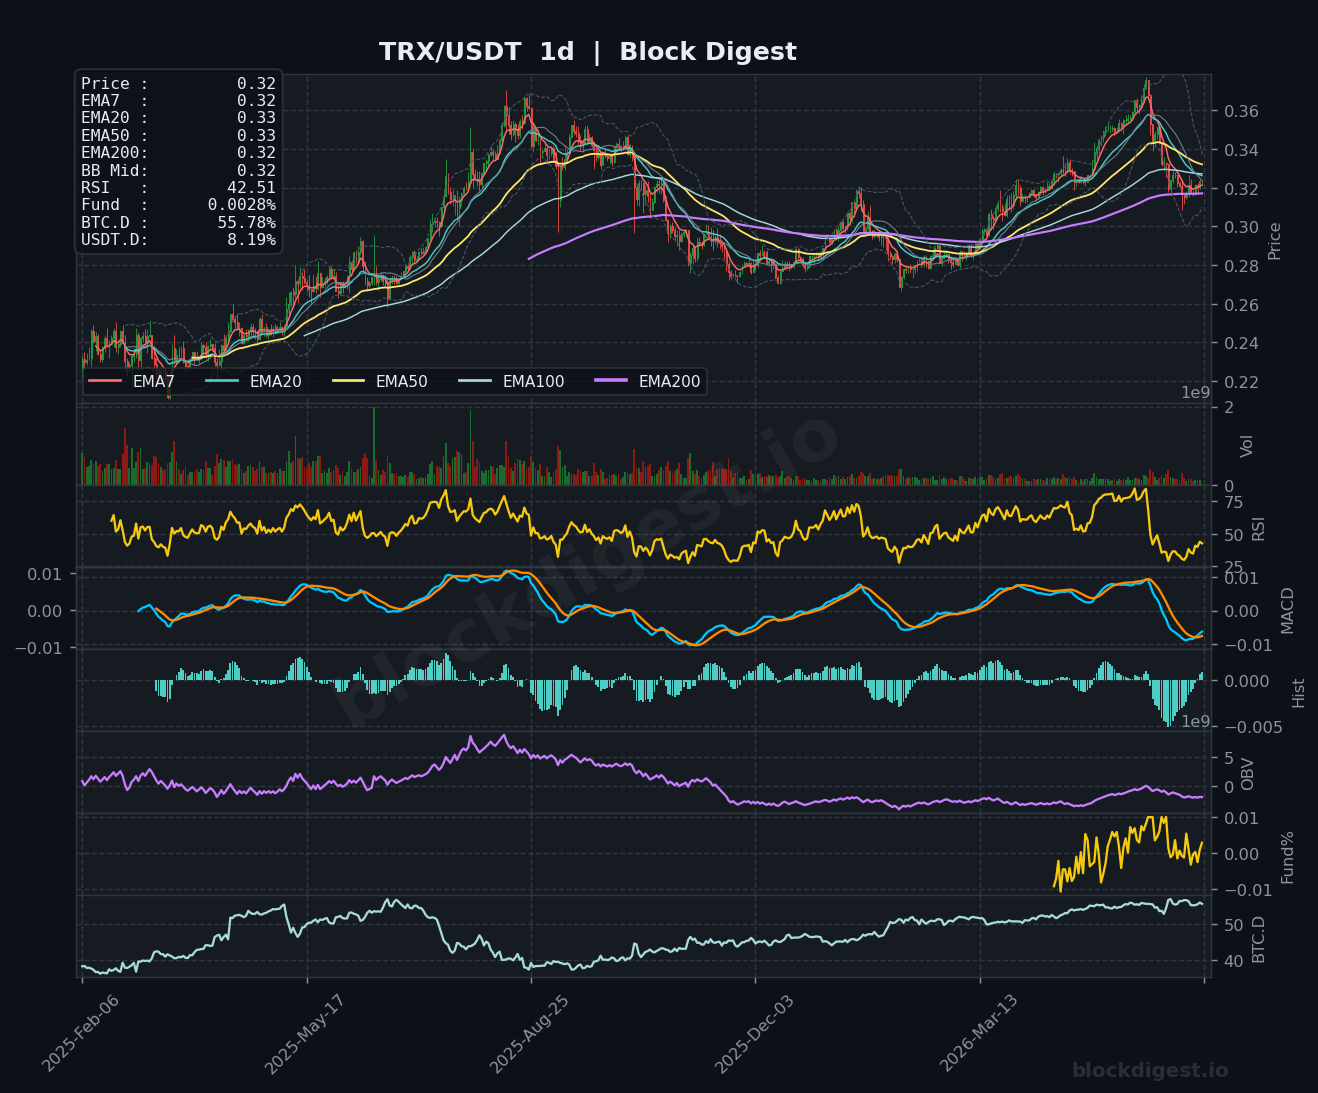
TRX is trading at $0.32, showing relative resilience compared to other alts on the daily chart, where the EMA200 sits at $0.32 — meaning price is still trading in line with its longest-term moving average, unlike most peers. The 1-hour RSI at 54.36 and a flat MACD near the zero line reflect neutral near-term momentum, while the 4-hour RSI at 57.47 is the strongest reading among today’s watchlist on that timeframe. However, the daily RSI at 42.51 and a recently turned negative daily MACD histogram warn that the post-peak correction from $0.37 may have further to run. OBV on the daily has rolled over following the cycle high, and a loss of the $0.31 support level would open the door to $0.29–$0.30, while a reclaim of $0.33–$0.34 is needed to restore a constructive bias.
Altcoin Outlook
As of June 20, 2026, the altcoin market broadly remains in a corrective phase, with BTC dominance elevated and USDT.D elevated enough to suggest risk appetite has not yet meaningfully returned to favor altcoins. TRX presents the most relatively resilient setup of the group, trading near its daily EMA200 with the strongest intermediate RSI readings, while BNB shows a short-term bounce but faces significant overhead resistance. SOL offers the most interesting near-term long setup given its 1-hour momentum, but must clear the $75 level to validate recovery. DOGE and LTC show the weakest overall structures, with both printing daily RSIs below 40 and declining OBV profiles that suggest further downside risk. Key macro conditions to watch include any shift in BTC dominance below 54% — which would signal meaningful altcoin rotation — and USDT.D dropping below 7.5%, which would indicate improved risk appetite across the broader digital asset space.
Disclaimer: This analysis is for informational purposes only and does not constitute financial advice. Cryptocurrency markets are highly volatile and unpredictable. All trading decisions should be made based on your own research and risk tolerance. Block Digest is not responsible for any financial losses incurred as a result of acting on this content.
Stay Ahead of the Market
Follow BlockDigest for crypto market intelligence, research and real-time updates.


