BTC Daily Analysis — May 02, 2026
BTC Daily Analysis – May 02, 2026
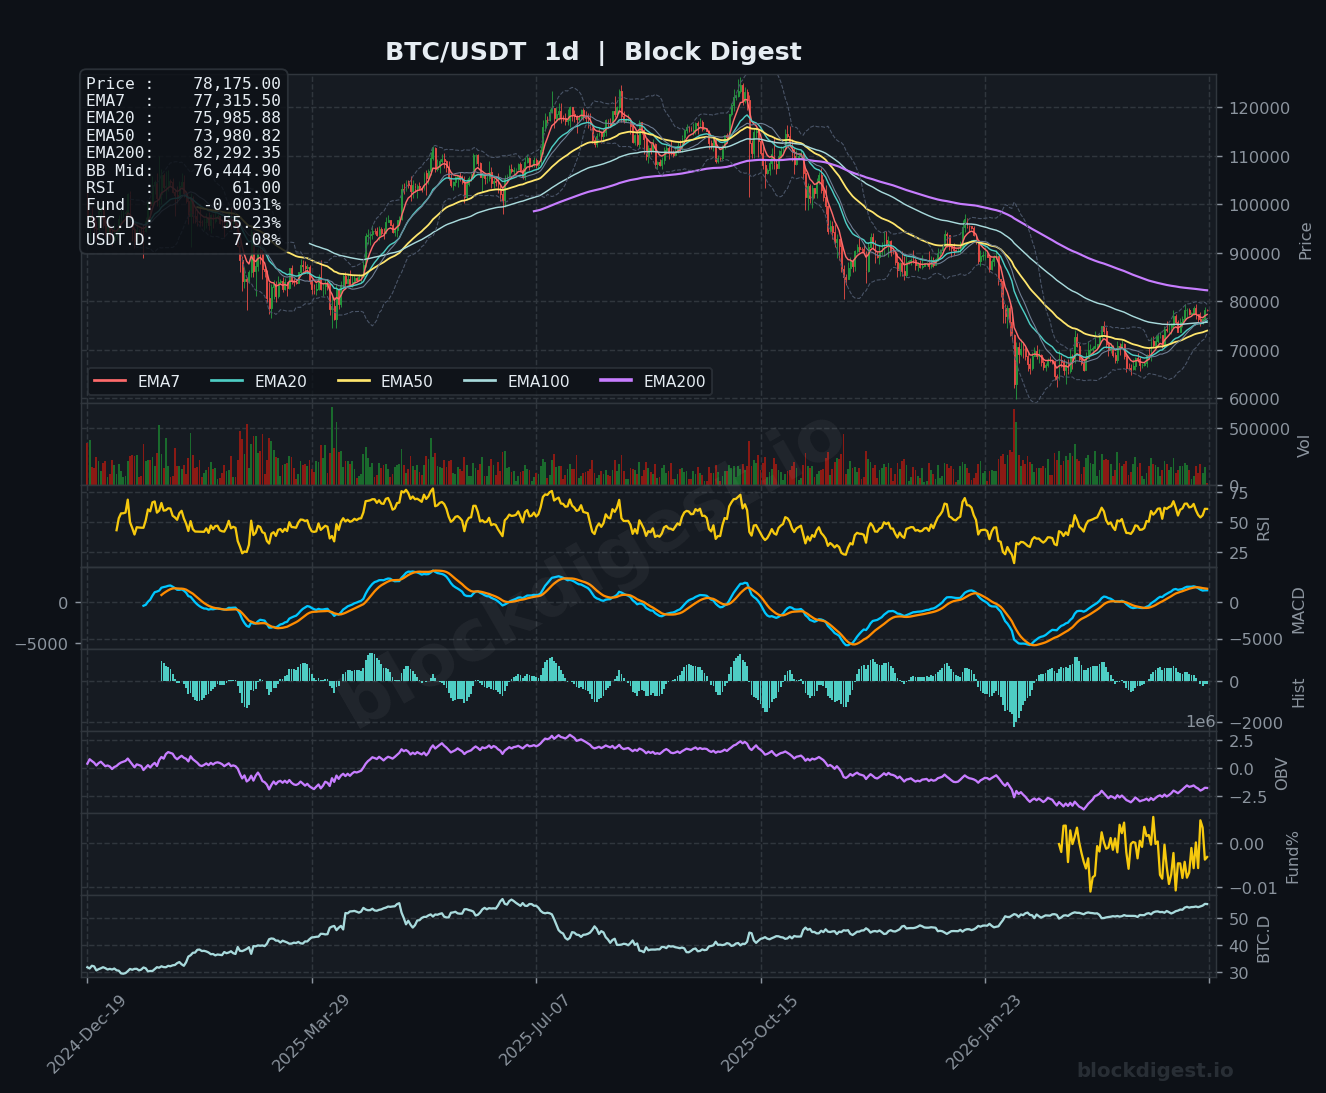
Market Overview
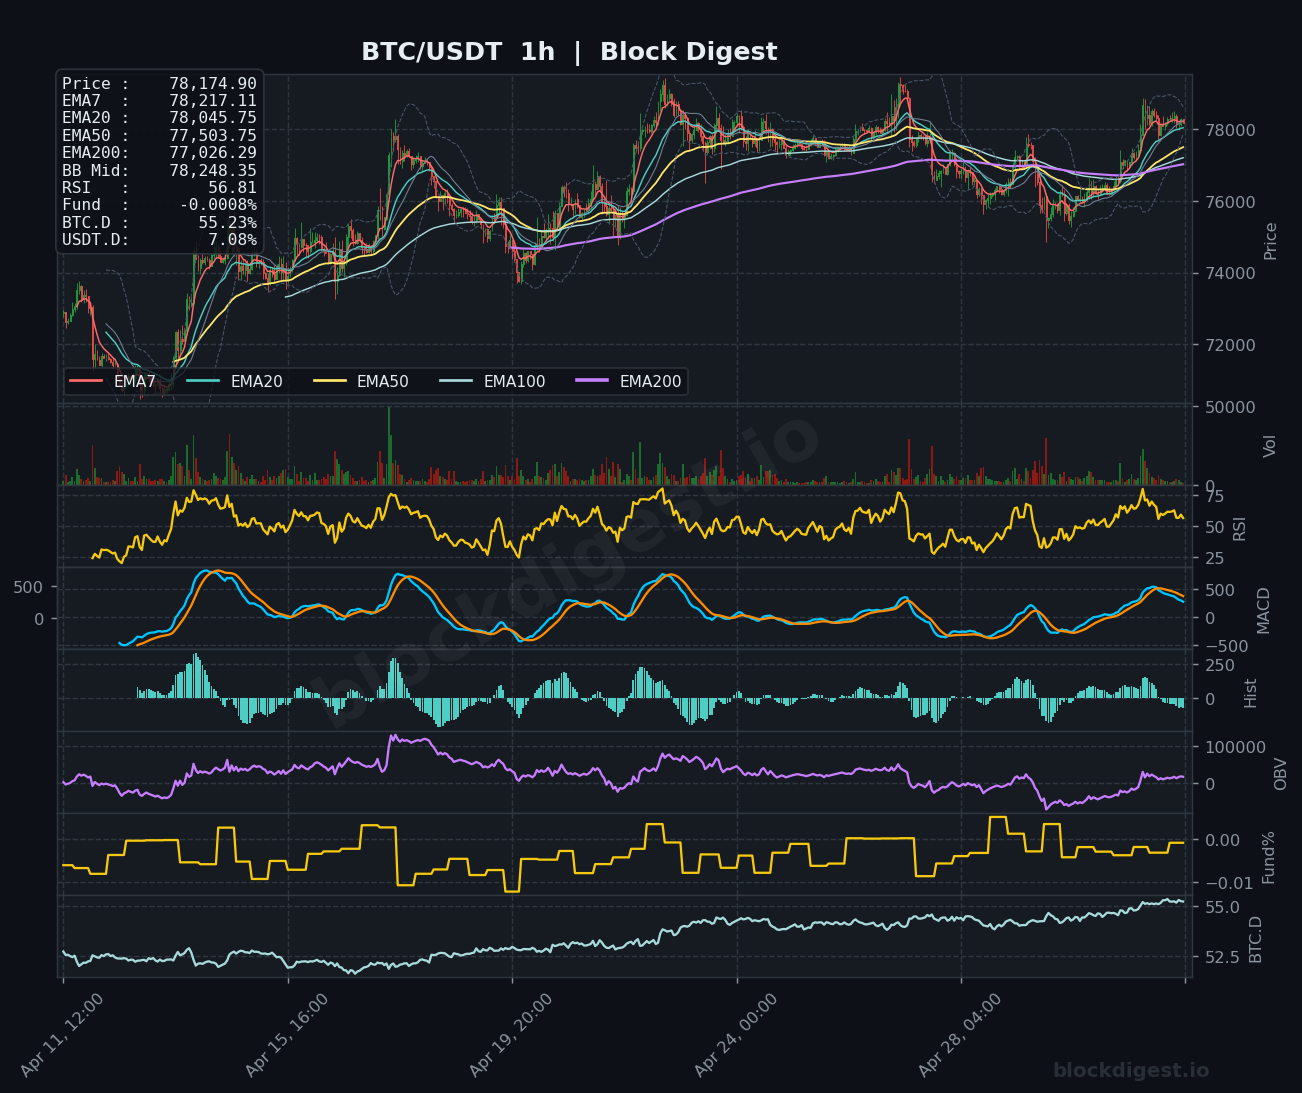
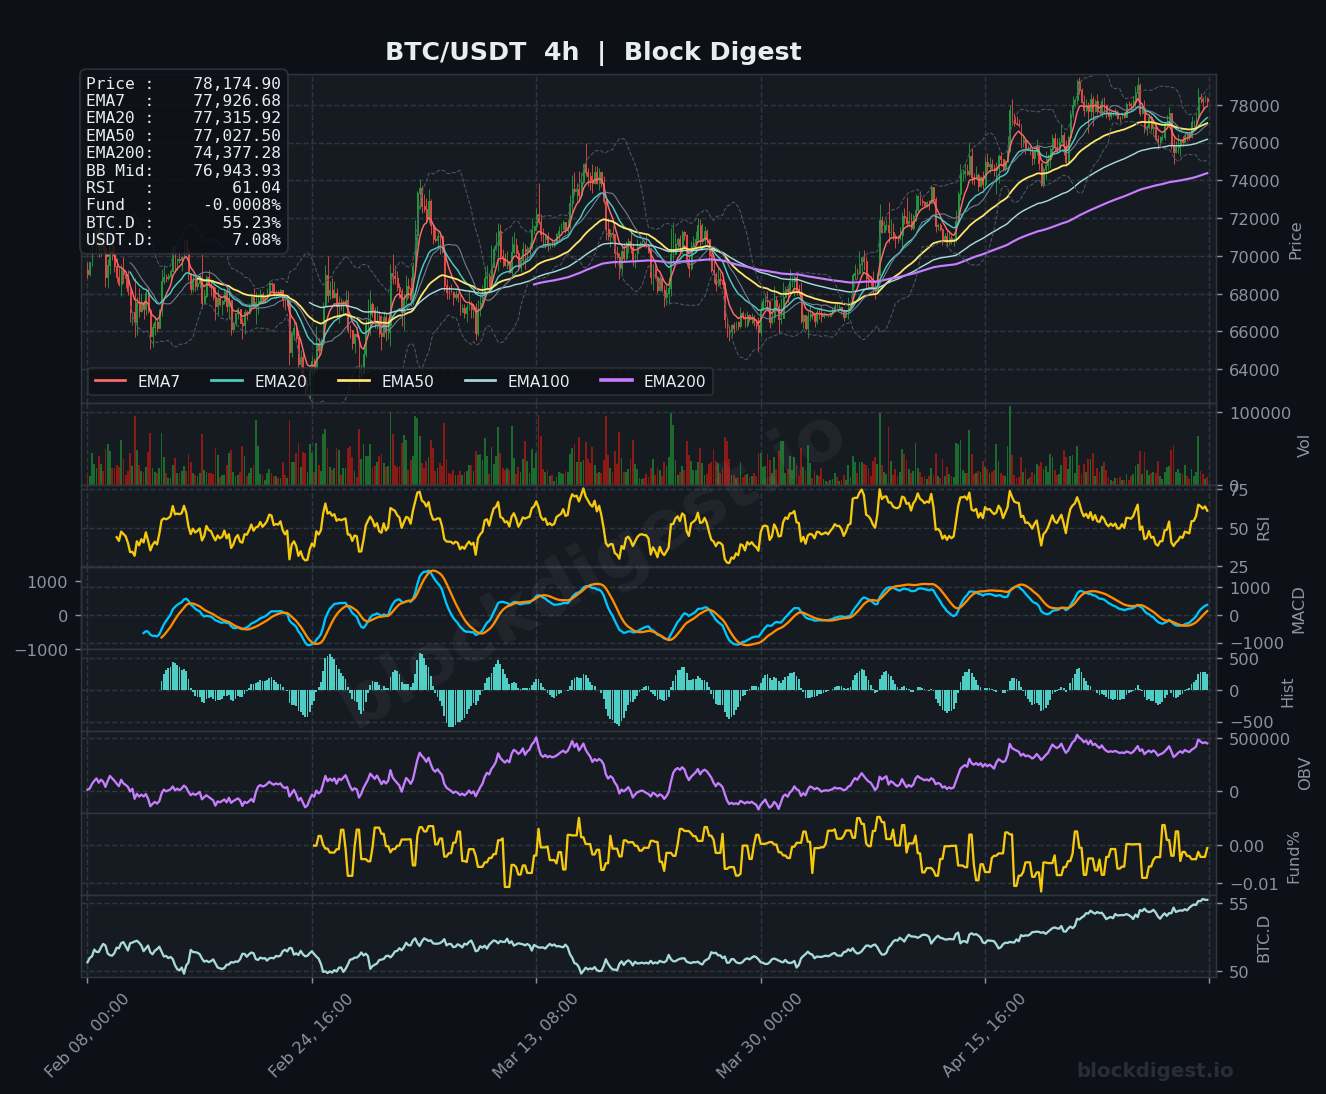
Bitcoin is currently trading at $78,174.90, consolidating within a tight range above key short-term moving averages while navigating a critical inflection point. On the daily timeframe, price remains below the EMA200 at $82,292.35, indicating the broader trend still faces overhead resistance despite recent recovery efforts. The 1-hour and 4-hour charts show price trading above their respective EMA7, EMA20, and EMA50 levels, suggesting short-term bullish structure, though the daily chart reveals BTC is still working to reclaim the EMA50 at $73,980.82 on a sustained basis. The Bollinger Band mid-line at $78,248.35 (1h) and $76,943.93 (4h) are providing dynamic support, with price action squeezed near the upper band across lower timeframes, signaling potential for either a breakout continuation or mean reversion.
Multi-Timeframe Confluence
The hourly timeframe shows constructive momentum with price holding above all major EMAs except the EMA200, while the 4-hour chart confirms this bullish alignment with EMA7 ($77,926.68) supporting current levels. However, the daily timeframe presents a more cautious picture, with price still trading below the EMA20 ($75,985.88) turned resistance and significantly below the EMA200 at $82,292.35, creating a divergence between short-term strength and longer-term structural weakness. The convergence of the 4-hour EMA50 at $77,027.50 and the daily EMA7 at $77,315.50 creates a critical support cluster around $77,000-$77,300, which aligns across multiple timeframes as a make-or-break level. This multi-timeframe EMA compression suggests an imminent directional move, with short-term bullish momentum testing against higher timeframe resistance.
Key Levels to Watch
Resistance:
- $78,500-$79,000: Immediate resistance zone representing recent local highs on the 1h and 4h charts; failure here has repeatedly capped rallies and coincides with upper Bollinger Band expansion areas
- $80,000-$80,500: Psychological round number and previous consolidation zone visible on the daily chart; reclaiming this level would signal genuine strength and target the next major barrier
- $82,292 (Daily EMA200): Critical long-term resistance representing the 200-day moving average; a decisive break above would fundamentally shift the daily trend structure from bearish to bullish
Support:
- $77,000-$77,300: Confluent support cluster combining the 4h EMA50 ($77,027.50), daily EMA7 ($77,315.50), and 4h EMA20 ($77,315.92); this zone has provided robust buying interest throughout recent sessions
- $76,900-$77,000: Secondary support at the 4h Bollinger Band mid-line ($76,943.93) and 1h EMA200 ($77,026.29); loss of this level would expose deeper retracement risk
- $74,300-$74,500: Major support representing the daily EMA200 ($74,377.28) and a previous consolidation base; a breakdown to this level would indicate a failed recovery attempt and bearish continuation
Momentum & On-Chain Signals
RSI readings show mixed momentum across timeframes: the 1h RSI at 56.81 indicates neutral-to-slightly bullish conditions with room for upside expansion, while the 4h RSI at 61.04 and daily RSI at 61.00 both suggest strengthening momentum without entering overbought territory. The MACD on all timeframes displays recent bullish crossovers with positive histogram readings, though the daily MACD remains in early recovery phase, indicating nascent but not yet confirmed trend reversal. OBV trends show gradual accumulation on the 4-hour and daily charts, suggesting institutional buying beneath current prices despite the sideways price action, which creates a bullish divergence between price consolidation and volume accumulation. The Funding Rate at -0.0008% (1h and 4h) indicates slight short bias in perpetual markets, which could fuel short squeeze potential if price breaks resistance, while the negative rate suggests limited speculative excess on the long side.
BTC Dominance & Market Sentiment
Bitcoin Dominance stands at 55.23%, reflecting a moderate level that suggests BTC is maintaining its market share without extreme capital rotation into or out of altcoins. USDT Dominance at 7.08% indicates relatively low stablecoin positioning, suggesting capital remains deployed in risk assets rather than sitting on the sidelines in defensive positions. This combination of stable BTC.D and low USDT.D implies a consolidative crypto market environment where neither aggressive risk-on rotation into alts nor risk-off flight to stablecoins is dominating, creating a neutral backdrop for BTC to establish directional conviction based on its own technical merit.
Risk Scenarios
Bullish case: A decisive 4-hour close above $78,500 with expanding volume would confirm breakout momentum, targeting the $80,000-$80,500 resistance zone initially and potentially the daily EMA200 at $82,292.35 on continuation. Sustained support above $77,300 coupled with positive funding rate flip and RSI expansion above 65 on the 4h chart would validate bullish structure.
Bearish case: Failure to hold the $77,000-$77,300 support cluster on a 4-hour closing basis would signal short-term rejection and trigger retracement toward $76,000 and potentially the daily EMA50 at $73,980.82. A daily close below $76,900 with deteriorating MACD momentum would confirm failed breakout and risk extension toward $74,300-$74,500.
Outlook
Bitcoin remains at a critical juncture where short-term bullish structure is testing against higher timeframe resistance, creating a coiled setup ahead of directional resolution. The immediate bias leans cautiously bullish given price positioning above key short-term EMAs and accumulative OBV behavior, but sustainability requires a clean break above $78,500 with follow-through. Traders should monitor the $77,000-$77,300 support zone closely as the line in the sand for bull case validity; loss of this area would necessitate defensive positioning. The next 24-48 hours will be defined by whether bulls can generate sufficient momentum to reclaim $78,500-$79,000 or whether this consolidation resolves with mean reversion back toward $76,000, with the daily EMA200 at $82,292.35 remaining the ultimate target for confirming trend reversal on successful breakout.
Disclaimer: This analysis is for informational purposes only and does not constitute financial advice. Cryptocurrency markets are highly volatile and unpredictable. All trading decisions should be made based on your own research and risk tolerance. Block Digest is not responsible for any financial losses incurred as a result of acting on this content.