ETH Daily Analysis — May 07, 2026
ETH Daily Analysis – May 07, 2026
Market Overview
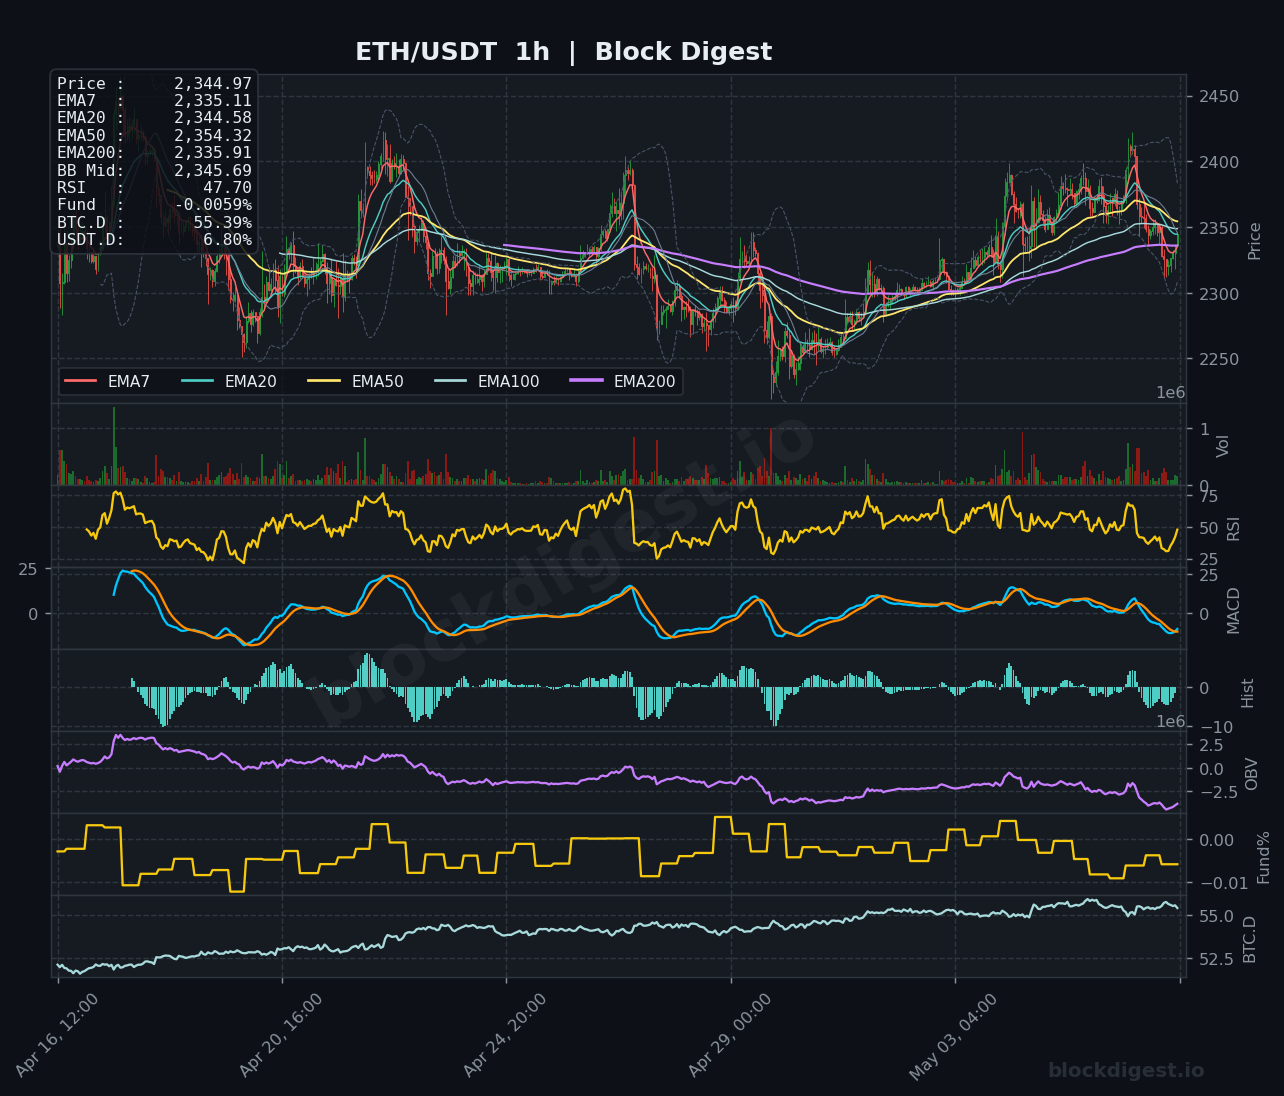
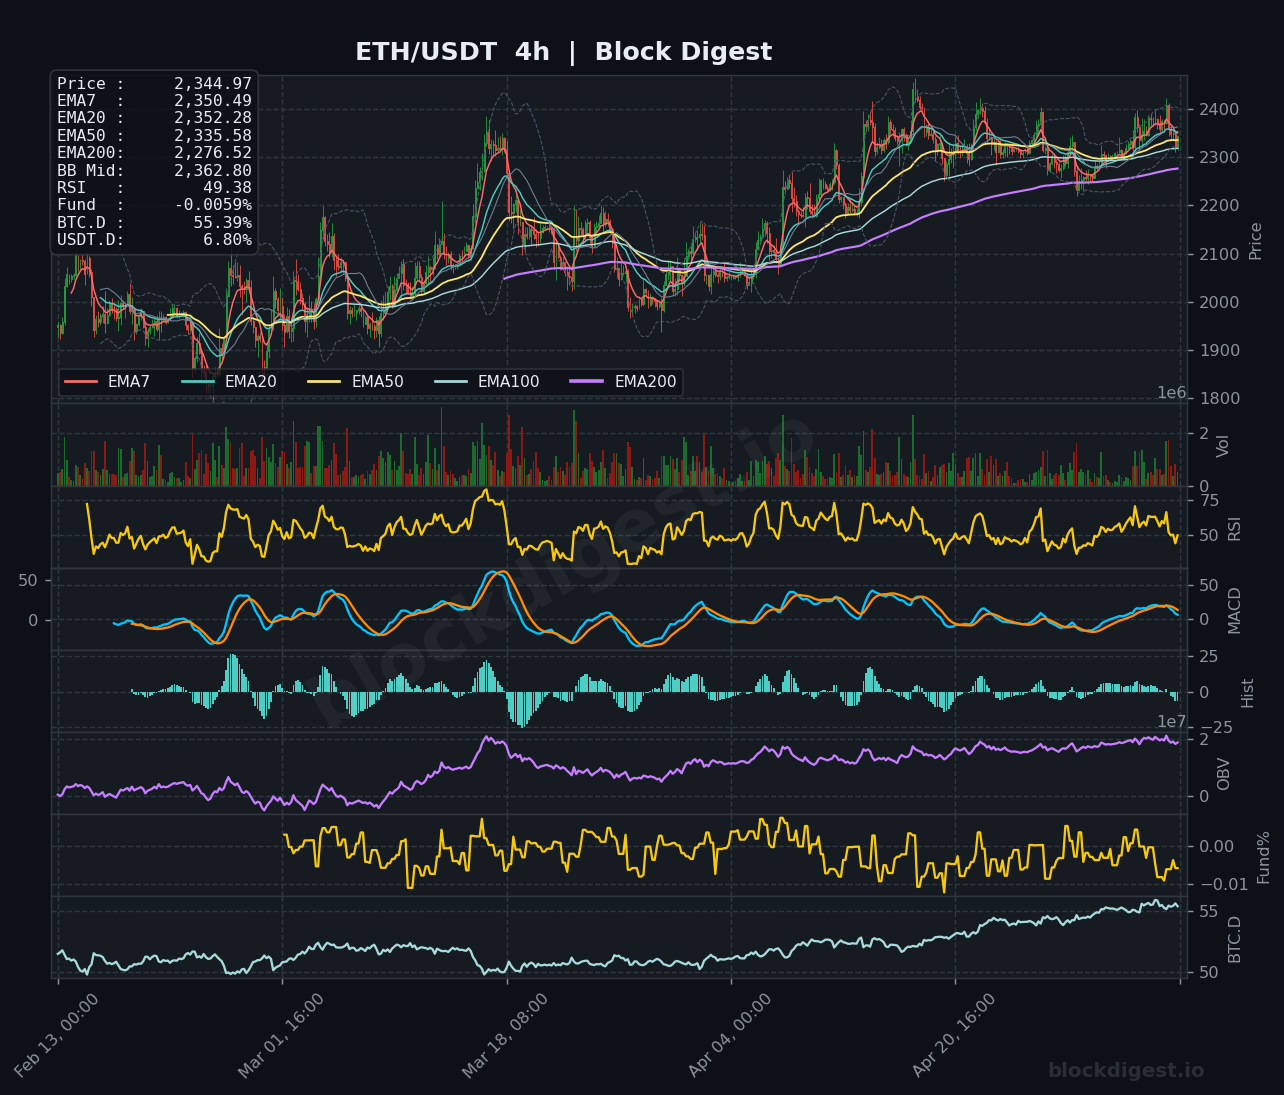
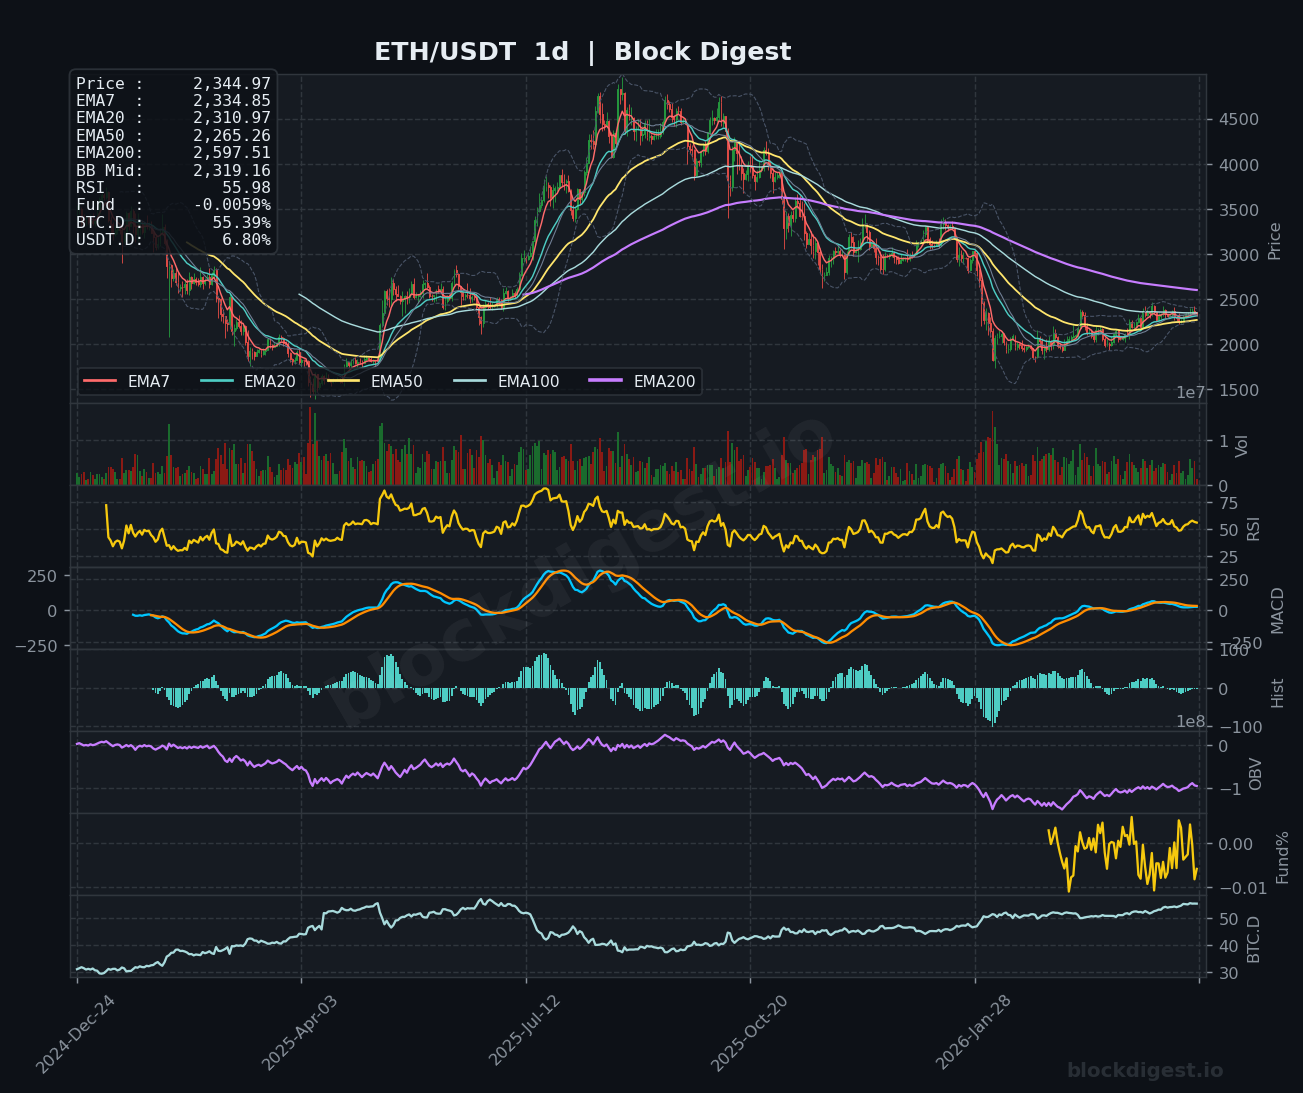
Ethereum is trading at $2,344.97, displaying a consolidative price structure with mixed signals across timeframes. On the daily chart, price remains compressed between the EMA50 at $2,265.26 and the declining EMA200 at $2,597.51, indicating ongoing indecision within a broader downtrend. The current price sits below the EMA20 ($2,319.97) and EMA50, while Bollinger Bands at $2,319.16 show price testing the middle band with limited volatility expansion. The dominant daily trend remains bearish with EMAs in negative alignment, though short-term momentum is attempting to stabilize above critical support zones.
Multi-Timeframe Confluence
A significant divergence exists across timeframes, creating tactical complexity. The 1-hour chart shows price trading below most EMAs ($2,335.11 EMA7, $2,344.58 EMA20, $2,354.32 EMA50), signaling immediate bearish pressure despite being near the EMA200 at $2,335.91. The 4-hour timeframe reveals price defending the EMA50 at $2,335.58 while struggling beneath the EMA20 at $2,352.28, creating a compression zone between $2,335-$2,365. The daily chart confirms this as a critical decision point, with all shorter-term EMAs clustered between $2,310-$2,340, creating a confluence support area. The 1h RSI at 47.70 and 4h RSI at 49.38 both reflect neutral momentum, while the daily RSI at 55.98 suggests marginal bullish bias on the higher timeframe—a conflict that typically precedes a decisive breakout or breakdown.
Key Levels to Watch
Resistance:
- $2,365-$2,375: Immediate resistance zone marked by the 4h EMA7 ($2,350.49) and recent swing highs on the 1h chart; a break above would signal short-term momentum shift
- $2,400-$2,420: Major resistance cluster representing prior consolidation highs and the psychological $2,400 level; clearing this area would target the 1d EMA200
- $2,460-$2,480: Critical structural resistance near the daily Bollinger Band upper boundary and previous breakdown zone; reclaiming this level would negate the bearish daily structure
Support:
- $2,310-$2,320: Immediate support convergence of daily EMA20 ($2,319.97) and 4h Bollinger Band middle at $2,362.80 projection area; loss of this zone would accelerate downside
- $2,265-$2,280: Primary support at the daily EMA50 ($2,265.26) and 4h EMA50 ($2,335.58) projection; this level has historically provided strong buying interest
- $2,200-$2,220: Critical structural support representing prior consolidation lows visible on the daily chart; a breakdown here would confirm continuation of the broader downtrend toward $2,000
Momentum & On-Chain Signals
RSI readings paint a picture of neutral-to-slightly-bullish momentum with notable timeframe divergence. The 1h RSI at 47.70 shows recent rejection from the 50 midpoint, while the 4h RSI at 49.38 remains similarly flat, both indicating lack of directional conviction on lower timeframes. However, the daily RSI at 55.98 holds above the neutral 50 level, suggesting underlying accumulation potential if support holds. The MACD across all timeframes shows flattening histograms with both lines converging near zero—on the 1h and 4h charts, the MACD is attempting a bullish crossover but lacks momentum confirmation. The OBV on the daily chart displays a declining trend since the April highs, indicating sustained distribution despite recent price stabilization, which creates a bearish divergence concern. The Funding Rate at -0.0059% reflects slight negative funding, suggesting short positions are paying longs—a contrarian signal that often precedes short squeezes if demand emerges.
BTC Dominance & Market Sentiment
BTC Dominance stands at 55.39%, showing a gradual uptrend from the 52-53% range visible on the daily chart’s lower panel, indicating Bitcoin is outperforming altcoins including ETH in the current environment. This rising dominance typically correlates with risk-off behavior within crypto markets, where capital rotates toward BTC as a relative safe haven. USDT Dominance at 6.80% remains elevated compared to historical lows, confirming defensive positioning as stablecoin holdings increase relative to total market cap. The combination of rising BTC.D and elevated USDT.D suggests limited risk appetite for altcoin rallies, creating headwinds for ETH to establish sustained upward momentum. This macro backdrop implies ETH will likely require Bitcoin to lead a broader market reversal before significant strength materializes.
Risk Scenarios
Bullish case: A decisive daily close above $2,365 with increasing volume and RSI breaking above 60 would confirm short-term trend reversal, targeting the $2,400 psychological level initially, followed by the daily EMA200 at $2,597.51. Declining BTC Dominance below 54% coupled with improving funding rates would provide confluence for a move toward $2,500-$2,600 over the next 7-10 days.
Bearish case: Failure to hold the $2,310-$2,320 support confluence with a daily close below the EMA20 would signal continuation of downside pressure, targeting the daily EMA50 at $2,265 immediately. A break below $2,265 with accelerating OBV decline would expose the $2,200 support zone and potentially $2,100, particularly if BTC Dominance continues rising above 56%.
Outlook
ETH is positioned at a critical inflection point with mixed technical signals creating a low-conviction environment for directional trades. The daily structure remains bearish with declining EMA alignment, yet oversold lower timeframe conditions and slightly negative funding rates suggest potential for a relief bounce. The immediate focus should be on the $2,310-$2,365 range boundaries—a break above $2,365 with volume confirmation would justify short-term long positions targeting $2,400+, while failure to hold $2,310 would warrant defensive positioning with $2,265 as the next target. Given the rising BTC Dominance and elevated USDT Dominance, any bullish scenario requires broader market participation rather than ETH-specific strength. Traders should monitor Bitcoin’s price action closely and await clear breakout/breakdown confirmation before committing to directional bias, with particular attention to the daily close relative to the $2,320 EMA20 level in the next 24-48 hours.
Disclaimer: This analysis is for informational purposes only and does not constitute financial advice. Cryptocurrency markets are highly volatile and unpredictable. All trading decisions should be made based on your own research and risk tolerance. Block Digest is not responsible for any financial losses incurred as a result of acting on this content.