
Market Overview
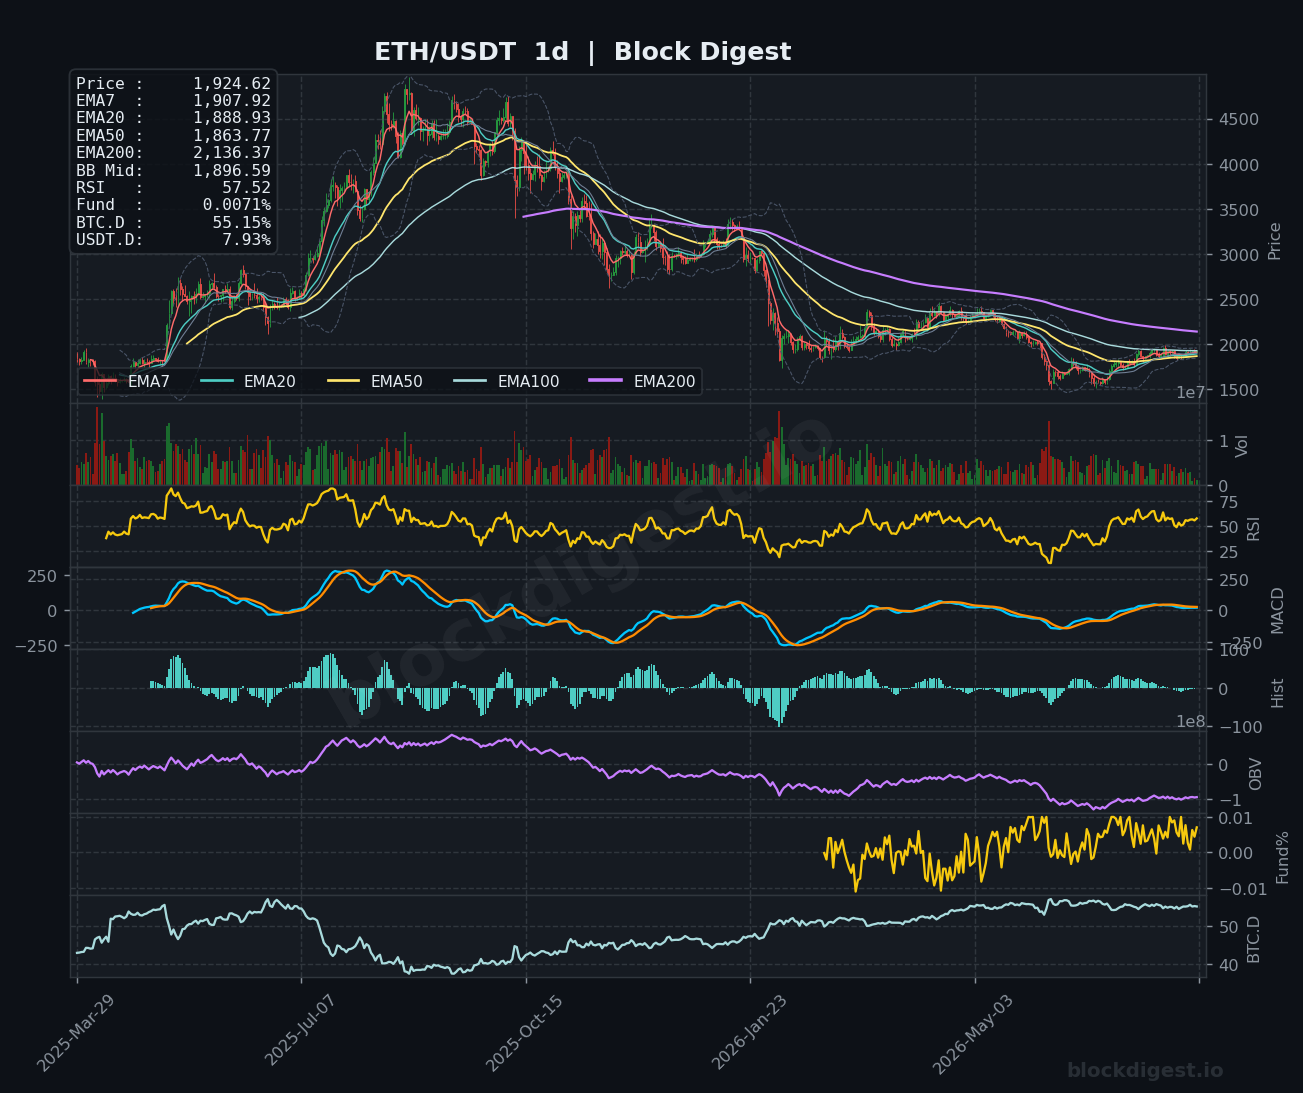
Ethereum is trading at $1,924.80, consolidating in a narrow band just above its short-term moving averages after a meaningful recovery from the mid-$1,600s seen earlier this summer. On the daily timeframe, price has reclaimed the EMA7 ($1,907.92), EMA20 ($1,888.93), and EMA50 ($1,863.77) in succession — a structurally bullish development — though the daily EMA200 sits far overhead at $2,136.37, underscoring how much ground ETH still needs to recover from its broader downtrend. Price is trading above the daily Bollinger Band midline ($1,896.59), which is a modest positive, but the Bollinger Bands themselves remain relatively wide, reflecting the lingering volatility from the sharp drawdown earlier in the cycle. The dominant trend on the daily chart remains technically bearish when viewed in full context, with the current move best characterized as a recovery rally within a larger downtrend rather than a confirmed trend reversal.
Multi-Timeframe Confluence
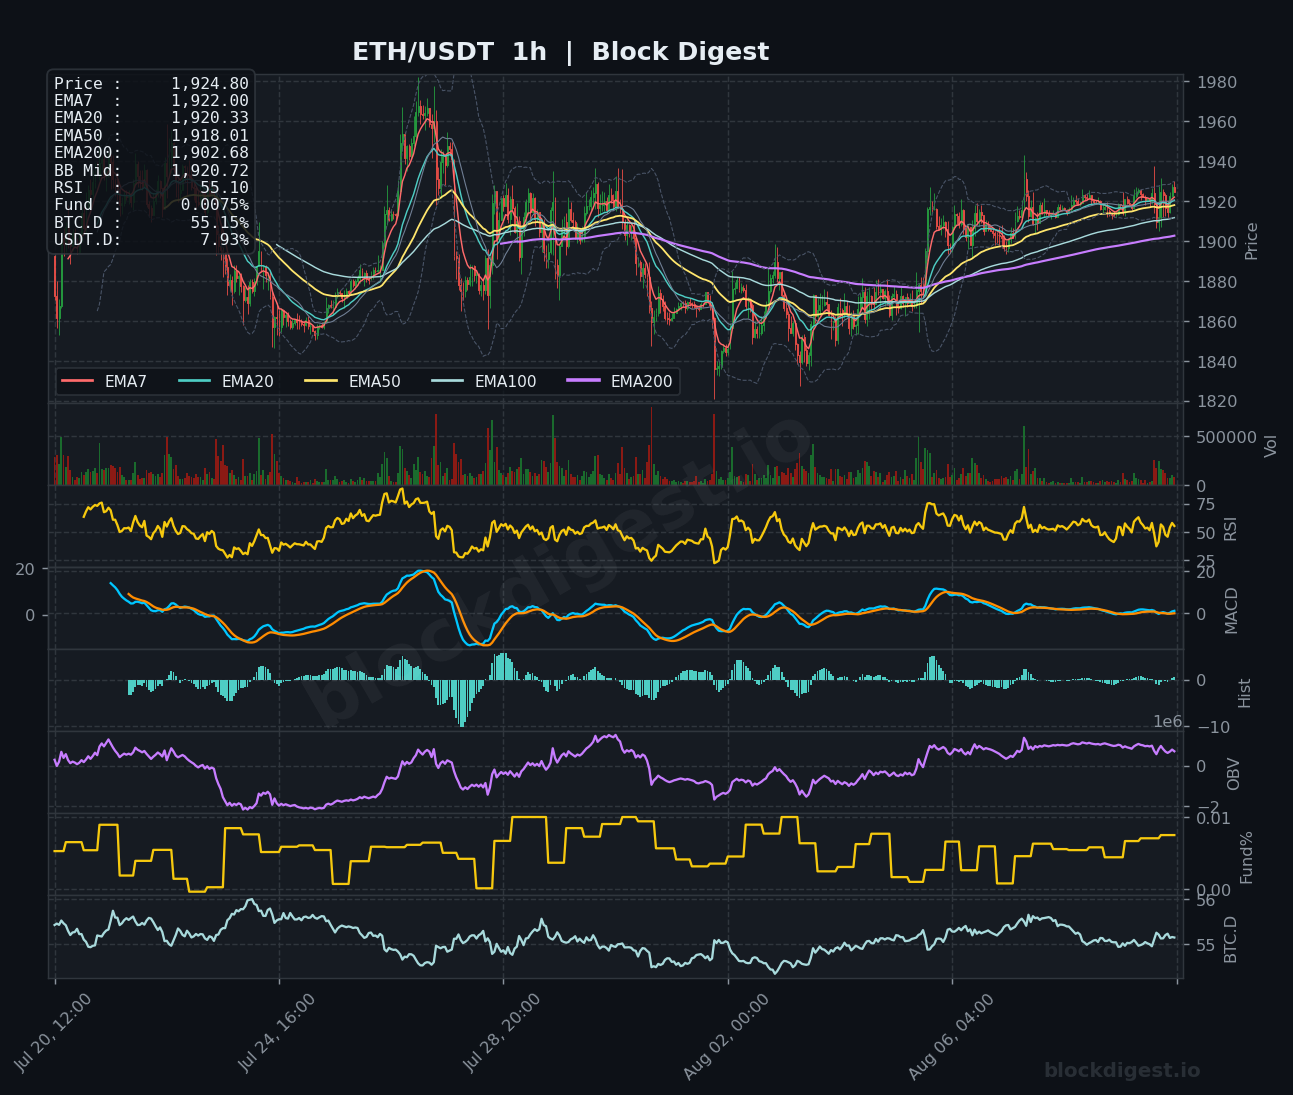
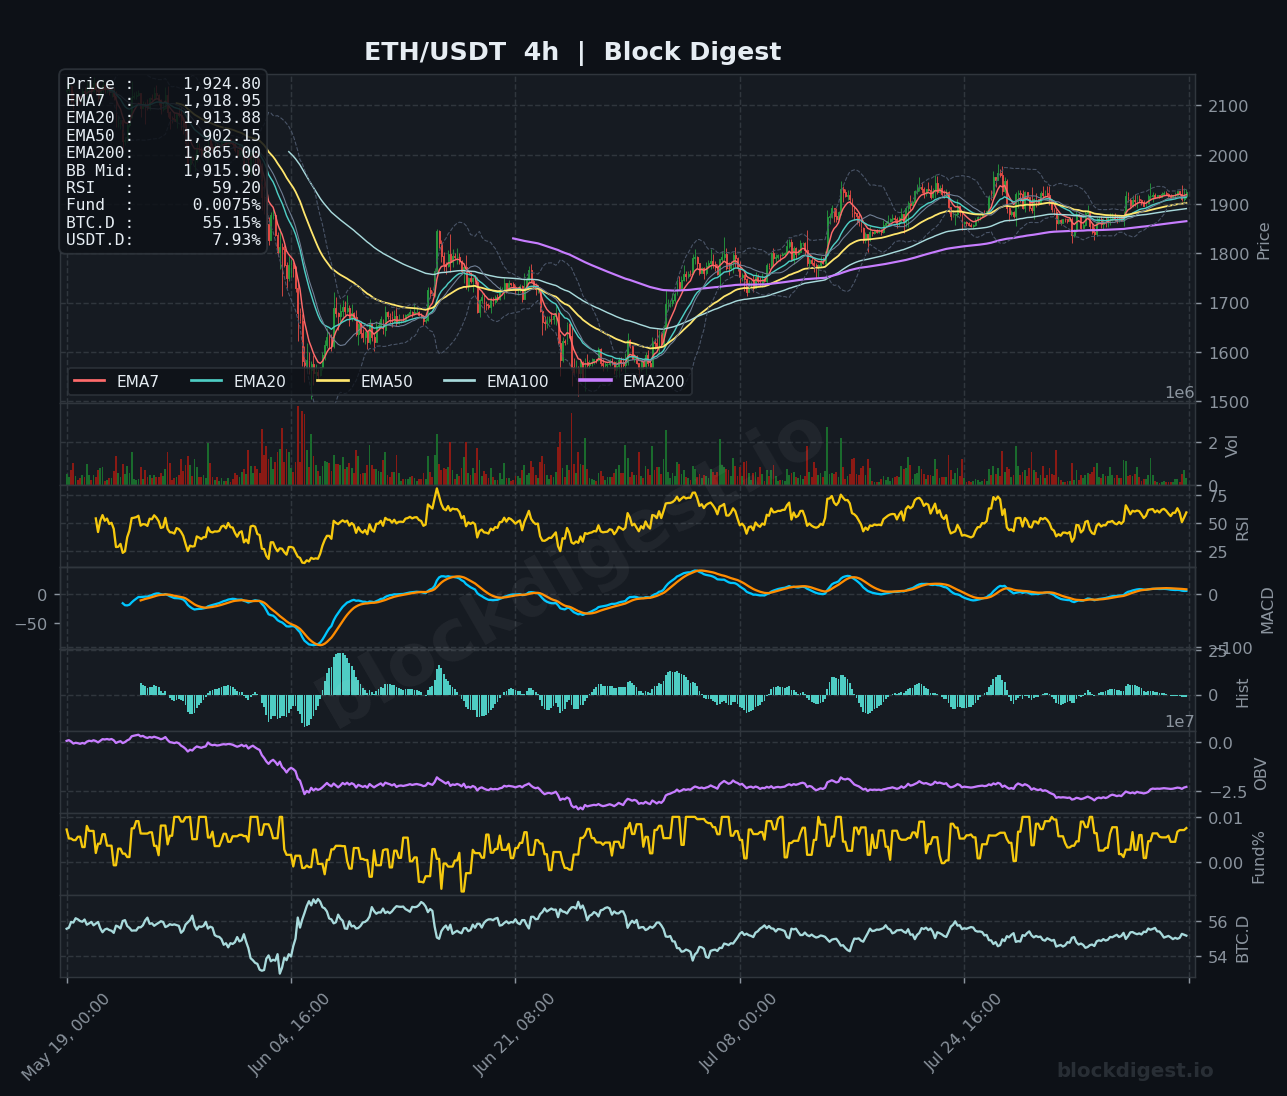
On the 1-hour chart, price at $1,924.80 is sitting just above all short-term EMAs (EMA7: $1,922.00, EMA20: $1,920.33, EMA50: $1,918.01), indicating tight bullish alignment but with very little separation — a sign that momentum, while present, is not yet forceful. The 4-hour chart reinforces this cautious optimism: price has crossed above the EMA7 ($1,918.95), EMA20 ($1,913.88), EMA50 ($1,902.15), and EMA200 ($1,865.00), all of which are stacking in bullish order, giving intermediate-term traders a cleaner backdrop. However, a key point of divergence emerges on the daily timeframe — the structure looks constructive on the lower timeframes, but the broader chart still shows ETH well below its historical EMA200, meaning higher-timeframe resistance is likely to cap rallies unless volume meaningfully expands.
Key Levels to Watch
- Resistance: $1,950 — recent intraday high and a psychologically significant level where sellers have previously stepped in; a clean break here opens the door toward $2,000. $2,000 — the major round-number resistance and a key battleground; the STOCH reading of 85.75 already signals overbought conditions approaching this zone. $2,136 — the daily EMA200, which represents the major overhead supply level and the line ETH must reclaim to shift the macro trend structure.
- Support: $1,900 — immediate psychological and structural support aligning with the 1h BB midline ($1,920.72) and the cluster of short-term EMAs; a loss of this level would be a short-term bearish signal. $1,865 — the daily EMA50, which has recently been reclaimed and now serves as a critical support on any deeper pullback. $1,840–$1,850 — the prior consolidation zone and a level where buyers defended aggressively during the post-capitulation recovery; a breach here would materially shift the near-term outlook.
Momentum & On-Chain Signals
The RSI picture is nuanced across timeframes: the 1-hour RSI sits at 55.10, the 4-hour at 59.20, and the daily at 57.52 — all in neutral-to-mildly-bullish territory without being stretched, which leaves room for continuation but doesn’t signal a powerful momentum thrust. Block Digest’s proprietary BD Pulse score of 54/100 corroborates this neutral read, while the BD Extreme Index at +1.49σ is a notable caution flag, suggesting the market is approaching overbought conditions on a statistical basis even if price hasn’t made an explosive move. The MACD on the 4-hour is hugging the zero line with a flattening histogram — not a rollover signal yet, but momentum is clearly losing urgency at current levels. On the daily chart, OBV remains in a recovering trend following a prolonged decline, consistent with the BD Pulse OBV Trend score of +1, though the overall OBV level on the 4-hour remains depressed relative to prior peaks, hinting that accumulation has been gradual rather than aggressive.
BTC Dominance & Market Sentiment
BTC dominance holds at 55.17%, a reading that continues to favor Bitcoin over altcoins in the current risk environment, and suggests ETH’s recovery is occurring against a headwind of capital preference for BTC rather than a broad alt-season rotation. USDT.D at 7.93% reflects a moderate level of cash on the sidelines — not a crisis-level flight to safety, but also not the aggressive deployment that typically fuels sustained altcoin rallies. With the July jobs report miss providing a macro tailwind and ETF demand offering underlying BTC support, the broader sentiment is cautiously constructive, but the dominance picture implies ETH will likely need a BTC consolidation or pullback to catalyze a more meaningful relative move.
Risk Scenarios
- Bullish case: A clean hourly and 4-hour close above $1,950 with expanding volume would confirm buyer control and bring the $2,000 psychological target into play, potentially triggering a short squeeze given the Long/Short account ratio of 1.12 (52.8% long) creating moderate squeeze conditions. Sustained macro tailwinds from continued soft labor data and ETF inflows could keep the bid alive through that level.
- Bearish case: A failure to hold $1,900 on a closing basis — particularly if accompanied by BTC weakness and rising dominance — would likely see price retest the $1,865 daily EMA50 fairly quickly, with a deeper flush toward $1,840 if that level cracks. The BD Extreme Index at +1.49σ suggests limited margin for error if spot demand fades, as any reversal from overbought statistical territory could accelerate rapidly given thin EMA separation on the lower timeframes.
Outlook
ETH’s near-term bias leans modestly bullish given the clean EMA stack on the 4-hour and the macro backdrop of a weaker-than-expected jobs report adding fuel to risk appetite, but the setup is one of cautious recovery rather than breakout conviction. The $1,950–$2,000 zone is the critical test for the next 24–48 hours: a high-volume push through it would materially shift short-term sentiment, while repeated rejections at $1,950 would signal exhaustion and likely precede a pullback to retest $1,900 or below. The BD Extreme Index reading of +1.49σ and the STOCH overbought signal are the primary risks to the bull case, warranting tighter position management near resistance. Until ETH reclaims the daily EMA200 at $2,136, any rally should be approached as a trade within a larger structural recovery, not a confirmed macro trend reversal.
—
Disclaimer: This analysis is for informational purposes only and does not constitute financial advice. Cryptocurrency markets are highly volatile and unpredictable. All trading decisions should be made based on your own research and risk tolerance. Block Digest is not responsible for any financial losses incurred as a result of acting on this content.
Stay Ahead of the Market
Follow BlockDigest for crypto market intelligence, research and real-time updates.


