
Market Overview
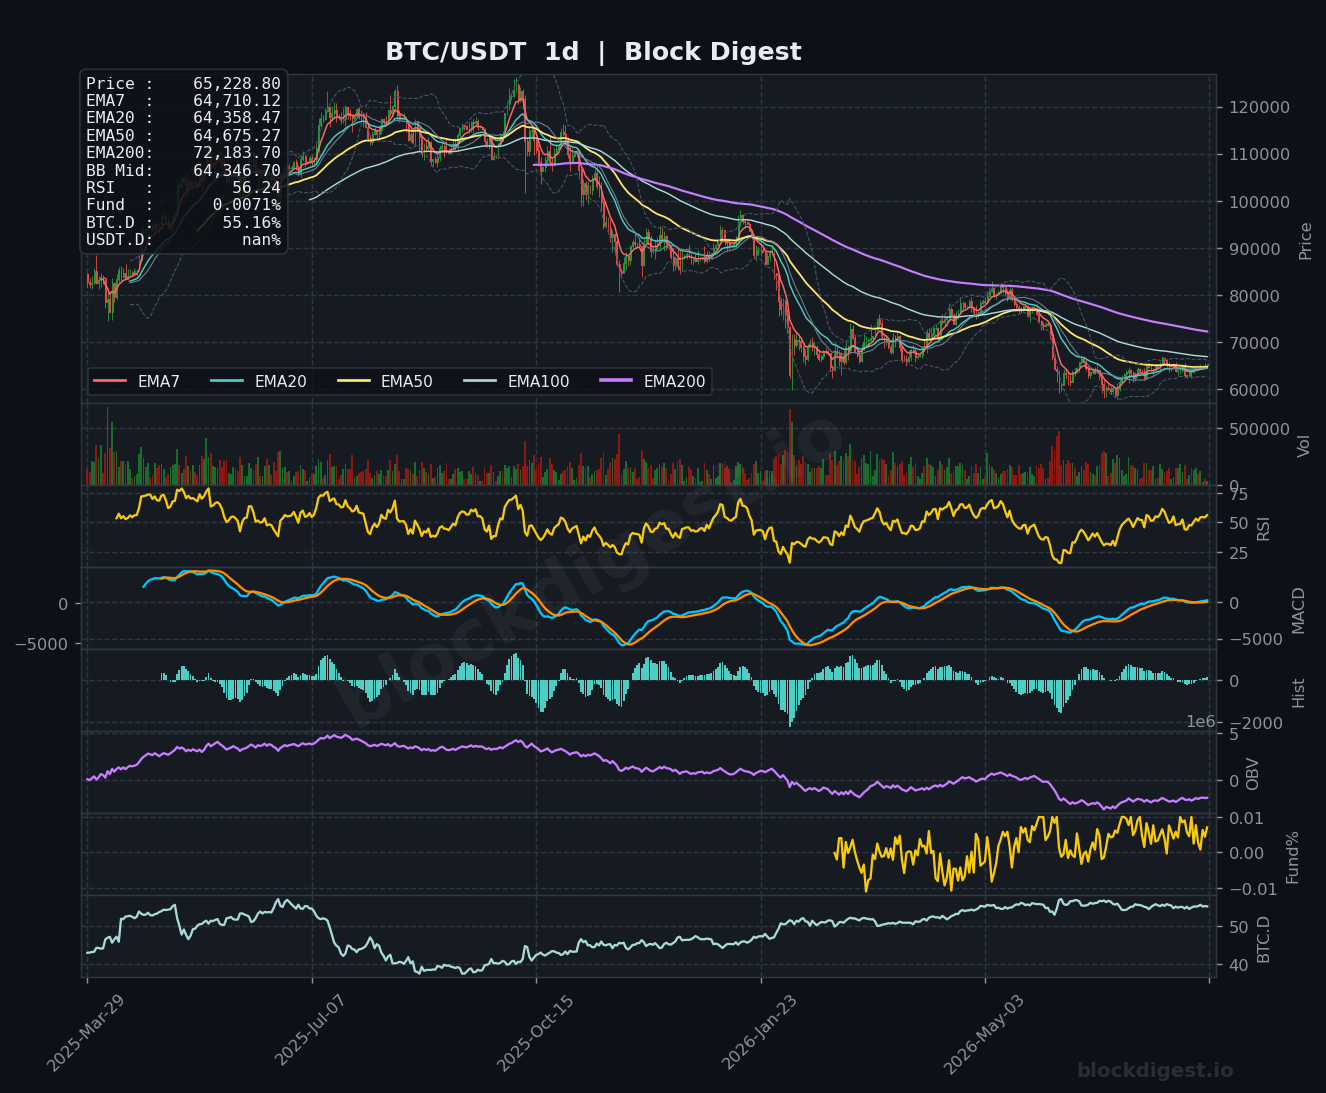
Bitcoin is trading at $65,228 as of August 10, 2026, navigating a critical juncture after a multi-month downtrend from its prior highs above $100,000. On the daily timeframe, price has recently reclaimed the EMA7 ($64,710), EMA20 ($64,358), and EMA50 ($64,675) — a meaningful cluster of short-term dynamic support now sitting just beneath spot price. However, the EMA200 at $72,183 remains a formidable overhead barrier, underscoring how much structural damage the longer-term trend still reflects. Price is currently trading above the Bollinger Band midline ($64,346 on the daily), a modest but constructive sign that near-term momentum has shifted in favor of buyers.
Multi-Timeframe Confluence
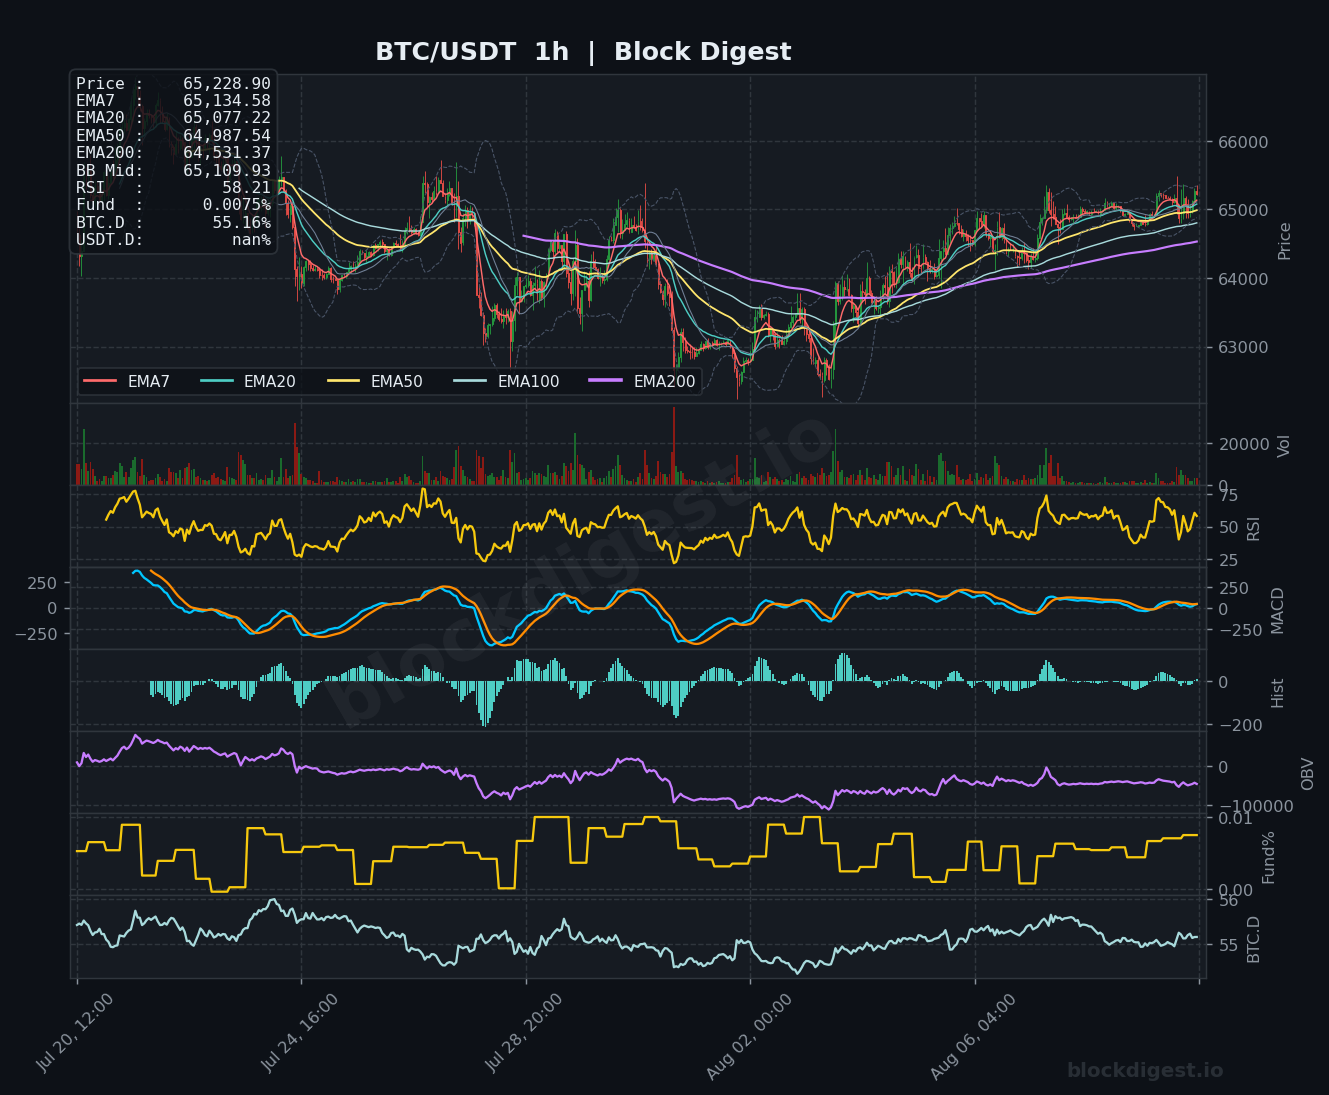
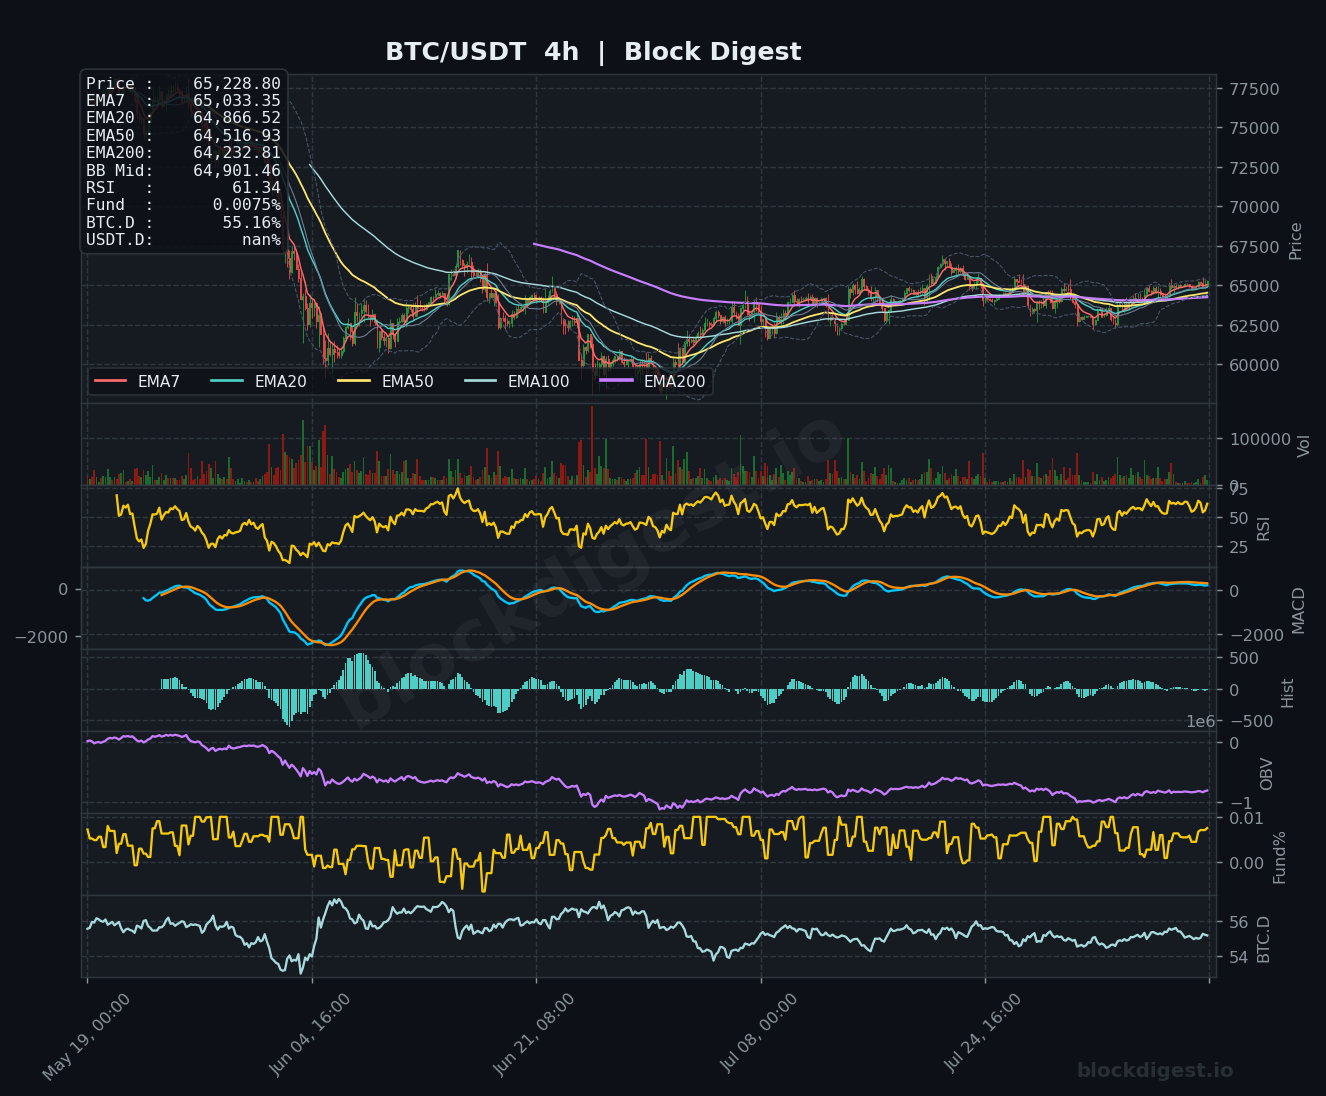
Across all three timeframes, the EMA stack has transitioned into a bullish alignment on the shorter intervals: the 1h chart shows price above all key EMAs (EMA7 at $65,134, EMA20 at $65,077, EMA50 at $64,987, and EMA200 at $64,531), with the 4h chart echoing a similar configuration where price holds above EMA7 ($65,033) and EMA50 ($64,516). This short-term bullish EMA alignment provides meaningful confluence, suggesting that recent buying pressure has been sustained and not merely a brief spike. The daily chart, however, paints a more cautious picture — while the near-term EMAs have converged and been reclaimed, the broader structure remains well below the daily EMA200, meaning rallies are occurring within a longer-term recovery attempt rather than a confirmed uptrend. The $64,500–$64,900 zone represents a dense zone of confluent EMA support across the 1h and 4h timeframes that bulls will need to defend on any pullback.
Key Levels to Watch
- Resistance: $65,500 — recent intraday high and near-term ceiling where sellers have shown up on the 1h chart; $67,000–$67,500 — the next meaningful overhead zone visible on the 4h chart, which capped price during a prior recovery attempt; $72,183 — the daily EMA200, the defining macro resistance that would need to be reclaimed to shift the long-term structural outlook.
- Support: $64,500–$64,900 — a dense EMA cluster (1h EMA50 + 4h EMA50/EMA20 + daily BB midline) forming a layered support zone; $63,000 — a prior consolidation base visible on the 4h chart that held during the early August retest; $61,000–$61,500 — the broader swing low region where significant buying emerged, representing the last major line of defense for the medium-term recovery thesis.
Momentum & On-Chain Signals
RSI readings are constructive but not stretched: the 1h RSI sits at 58.21 and the 4h at 61.34, both in neutral-to-mildly-bullish territory with room to run before hitting overbought thresholds. Our proprietary BD Pulse indicator registers 56.6 on RSI with a BD Extreme Index reading of +1.49σ — technically flagging an overbought condition relative to recent history — suggesting upside momentum may be facing short-term resistance to further acceleration. The daily MACD has recently crossed into positive territory, with the histogram turning constructive after a prolonged bearish phase, which supports the broader recovery narrative. On-chain flow signals measured by our BD Pulse OBV Trend score at +1 indicate net accumulation pressure, though the 4h OBV remains in a gradual decline from its longer-term peak, hinting that volume conviction on this recovery leg is not yet dominant.
BTC Dominance & Market Sentiment
BTC Dominance at 55.17% — confirmed across all three chart timeframes — remains elevated and continues to trend upward from the lows seen earlier this year, suggesting capital continues to favor Bitcoin over altcoins in the current risk environment. This is consistent with a cautious, BTC-centric market posture rather than the broad risk-on rotation that typically drives altcoin outperformance. The positive funding rate of +0.0071% (perpetual futures) signals that longs hold a slight edge, but the rate remains measured and well below levels that would suggest dangerous overleveraging — a relatively healthy backdrop for continued upward exploration.
Risk Scenarios
- Bullish case: A clean daily close above $65,500 backed by expanding volume and sustained 4h RSI above 60 would open a path toward the $67,000–$67,500 resistance zone, with the weakening macro backdrop from the July jobs miss potentially adding fuel if Fed rate cut expectations firm further ahead of the September meeting.
- Bearish case: A breakdown below the $64,500 EMA confluence zone on a 4h closing basis would signal that the current recovery is stalling, exposing the $63,000 support level and, on a more serious deterioration, a retest of the $61,000–$61,500 structural low.
Outlook
The near-term bias leans cautiously bullish, with Bitcoin holding above a dense cluster of short-term EMAs across the 1h and 4h timeframes while macro tailwinds from the soft July labor market report keep rate-cut expectations in play. That said, the BD Extreme Index reading of +1.49σ warrants attention — it indicates that near-term price action has already absorbed a meaningful portion of the positive macro catalyst, and momentum may consolidate before the next directional leg. The critical trigger to watch over the next 24–48 hours is whether BTC can hold the $64,500–$64,900 support zone on any retracement and subsequently break above $65,500 with conviction. Failure to hold that lower support band would shift the bias back to neutral and bring the $63,000 level into focus.
—
Disclaimer: This analysis is for informational purposes only and does not constitute financial advice. Cryptocurrency markets are highly volatile and unpredictable. All trading decisions should be made based on your own research and risk tolerance. Block Digest is not responsible for any financial losses incurred as a result of acting on this content.
Stay Ahead of the Market
Follow BlockDigest for crypto market intelligence, research and real-time updates.


