
Market Overview
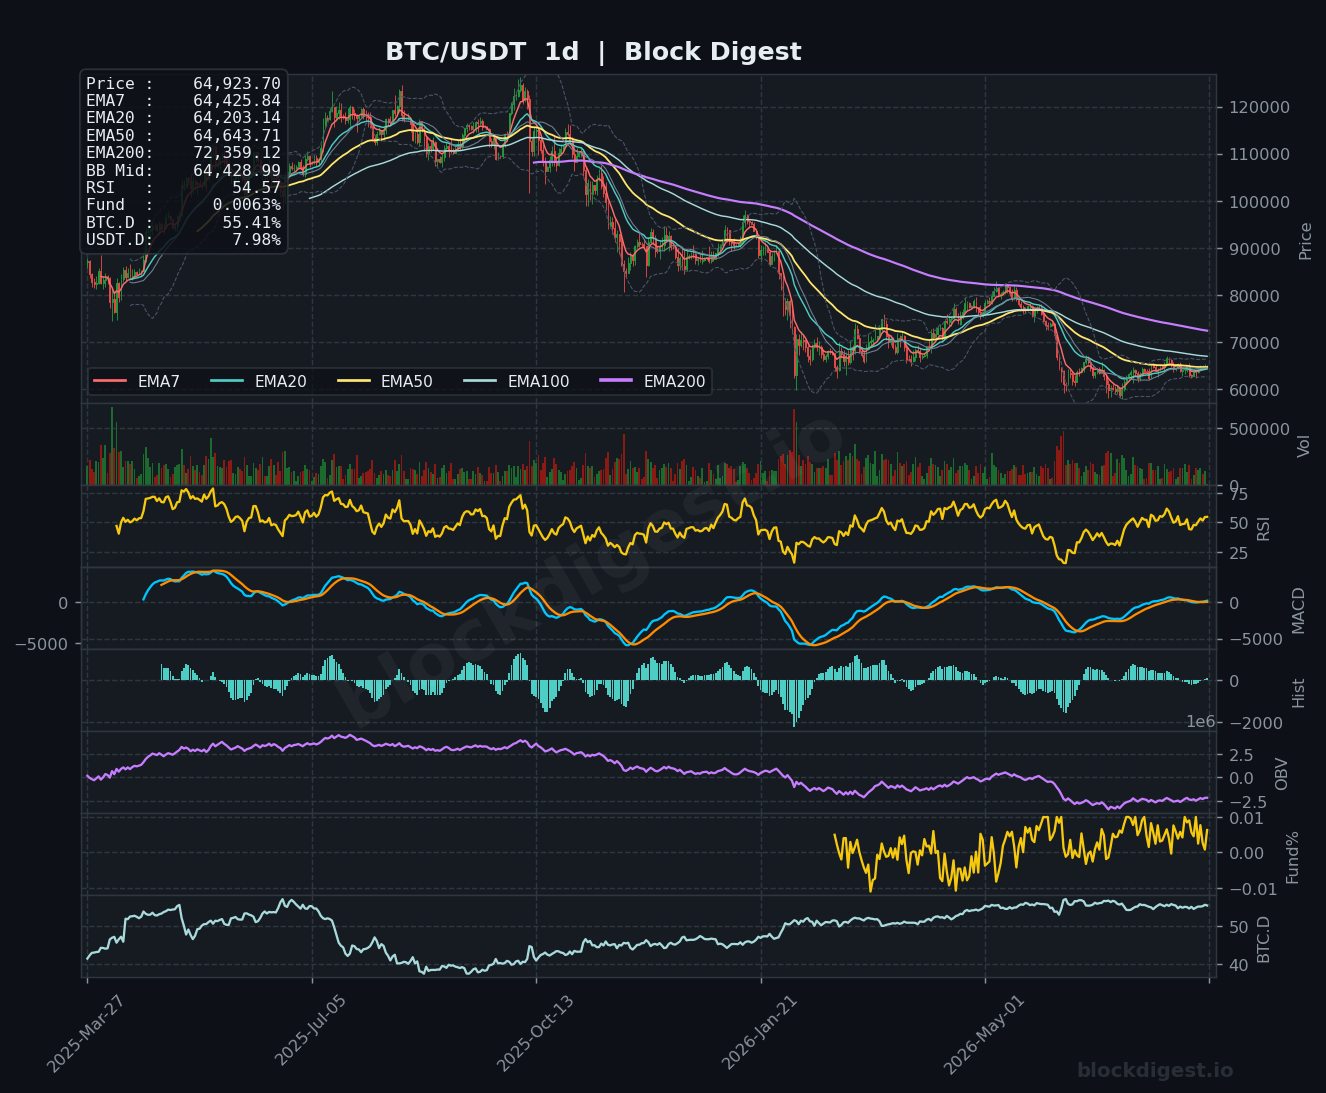
Bitcoin is trading at $64,967 as of August 8, 2026, holding just above a tightly clustered band of daily EMAs that are converging in the $64,200–$64,650 range. Price is positioned marginally above the daily Bollinger Band midline at $64,429, which places BTC in a broadly neutral-to-tentative zone — neither confirming a decisive recovery nor signaling imminent breakdown. The dominant daily trend remains structurally bearish, as the EMA200 on the daily chart continues to slope downward from elevated levels near $72,359, acting as a significant macro overhead obstacle. That said, the recent price action shows early signs of base formation following a prolonged decline from prior highs, and the short-term momentum has shifted slightly constructive.
Multi-Timeframe Confluence
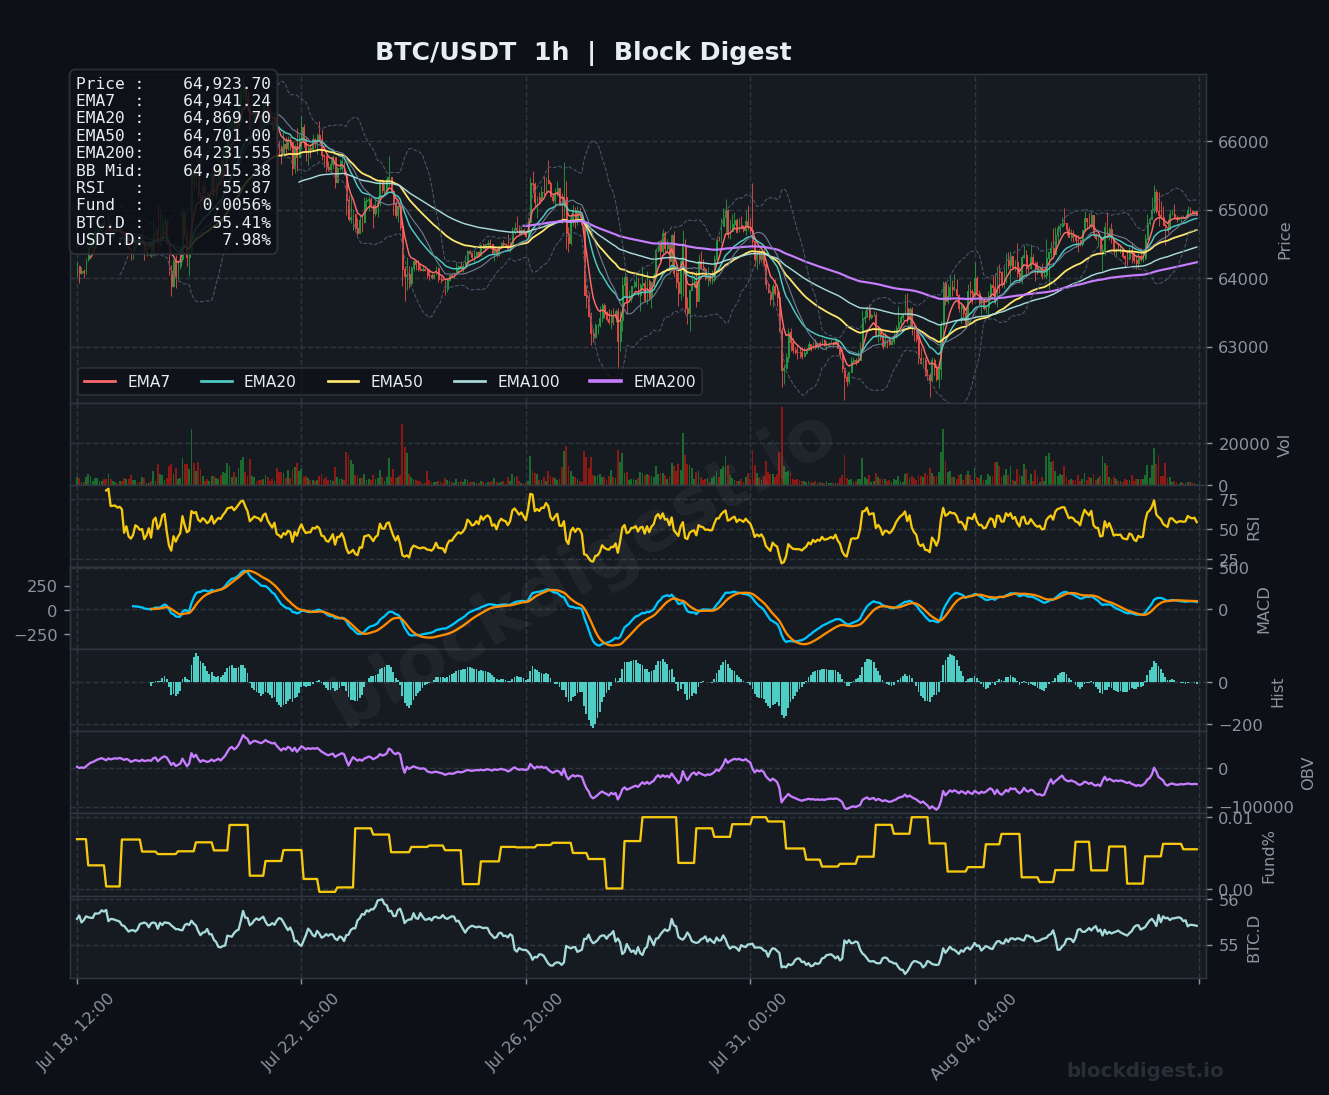
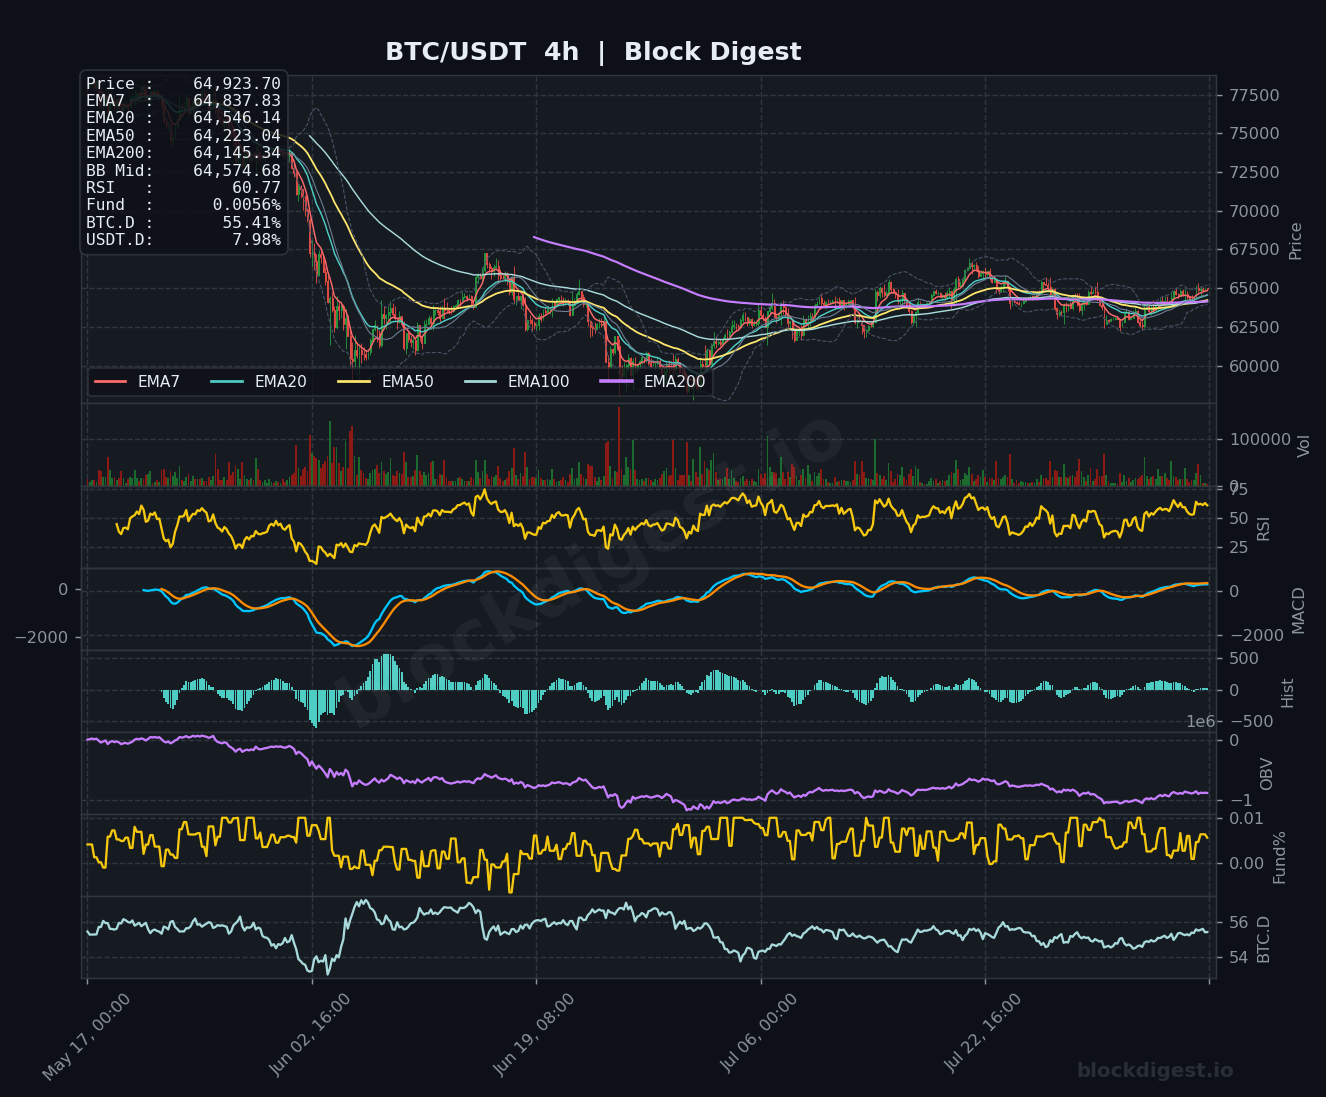
On the 1-hour chart, price sits just below EMA7 ($64,941) while holding above EMA20, EMA50, and EMA200 — a mildly bullish near-term stack with the short EMAs beginning to fan upward. The 4-hour timeframe presents a more encouraging picture: price is trading above all major EMAs (EMA7 at $64,838, EMA50 at $64,223, EMA200 at $64,145), and the RSI on the 4h has climbed to 60.77, suggesting building intermediate momentum. However, the daily chart’s longer-term EMA structure remains in a bearish configuration with the EMA200 far above current price, meaning any rally still faces substantial overhead resistance. The three timeframes collectively suggest a range-bound recovery attempt rather than a clean trend reversal.
Key Levels to Watch
- Resistance: $65,500 — the upper boundary of recent consolidation and area where multiple intraday rejections have occurred; $66,000 — a psychological round number and the 1h Bollinger Band upper region; $67,500 — confluence of prior structure highs on the 4h chart where sellers reasserted control
- Support: $64,145–$64,223 — the 4h EMA200/EMA50 cluster, a critical near-term floor; $63,500 — previous swing low and the lower Bollinger Band region on the 4h; $62,500–$62,800 — a deeper structural support zone visible on the 4h chart that capped the most recent multi-week decline
Momentum & On-Chain Signals
The daily RSI sits at 54.57 — mid-range and consistent with consolidation rather than trend conviction — while the 4h RSI at 60.77 reflects near-term buying pressure that hasn’t yet reached overbought territory. The daily MACD remains in negative territory but is curling upward with a flattening histogram, suggesting the bearish impulse is losing steam without yet producing a confirmed bullish crossover. Block Digest’s proprietary BD Pulse Score reads 43/100, flagging a net bearish bias that aligns with the daily chart’s unresolved macro downtrend, and the OBV trend score of +1 on the 1h indicates nascent accumulation at current levels. Funding rates at +0.0055% are low and balanced, meaning the market isn’t carrying excessive long leverage — reducing the risk of a sharp long squeeze in the near term.
BTC Dominance & Market Sentiment
BTC dominance is holding at 55.41%, near its recent highs within the observable range on the charts, suggesting capital remains concentrated in Bitcoin rather than rotating into altcoins — a sign of continued risk-off positioning within crypto. USDT dominance at 7.98% is elevated, indicating a meaningful portion of sidelined capital still sitting in stablecoins that has yet to re-enter the market. This dynamic is a double-edged signal: while it implies potential buying power on the sidelines, it also reflects persistent caution among market participants.
Risk Scenarios
- Bullish case: A sustained hourly close above $65,500, accompanied by rising 4h volume, would open a path toward the $66,000–$67,500 resistance zone. Confirmation of a daily MACD bullish crossover would reinforce this scenario and raise the probability of a more durable recovery leg.
- Bearish case: A loss of the $64,145 4h EMA cluster on a closing basis would expose the $63,500 support, and a breakdown below that level could trigger a retest of the $62,500 zone. The BIP-110 fork uncertainty flagged in recent headlines adds a tail-risk overlay that could accelerate selling if it generates negative headlines.
Outlook
The overall setup as of August 8, 2026 is cautiously neutral with a slight short-term bullish lean, supported by the 4h EMA stack recovery and the absence of aggressive short positioning per the long/short ratio of 1.12. However, the macro daily structure — with price still well below a declining EMA200 at $72,359 — keeps the medium-term bias firmly in bearish territory. Key triggers to watch over the next 24–48 hours include whether BTC can consolidate above $65,000 and challenge the $65,500 resistance, and whether the daily MACD histogram continues to contract toward zero. A failure to build above current levels risks a return to the $63,500–$64,145 support band, which would remain the line in the sand for bulls.
—
Disclaimer: This analysis is for informational purposes only and does not constitute financial advice. Cryptocurrency markets are highly volatile and unpredictable. All trading decisions should be made based on your own research and risk tolerance. Block Digest is not responsible for any financial losses incurred as a result of acting on this content.
Stay Ahead of the Market
Follow BlockDigest for crypto market intelligence, research and real-time updates.


