ALTCOIN Daily Analysis — 2026-07-24 (Full Archive)
Market Context
The altcoin market is navigating a decidedly risk-off session on July 24, 2026, with macro headwinds from Asian semiconductor stocks and geopolitical tensions weighing broadly across the space. BTC dominance sits at 55.76% per Block Digest’s BD Pulse data, indicating capital continues to consolidate into Bitcoin at the expense of altcoins — a dynamic that has persisted and is visibly suppressing mid-cap and large-cap alts alike. USDT.D at 7.97% reflects a modest but meaningful stablecoin bid, confirming that sideline caution remains elevated rather than outright panic.
Solana (SOL)
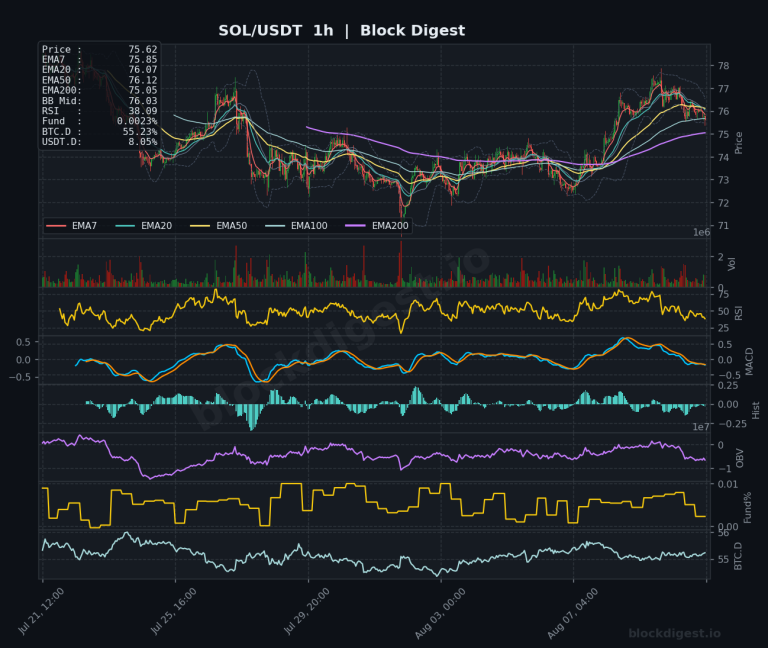
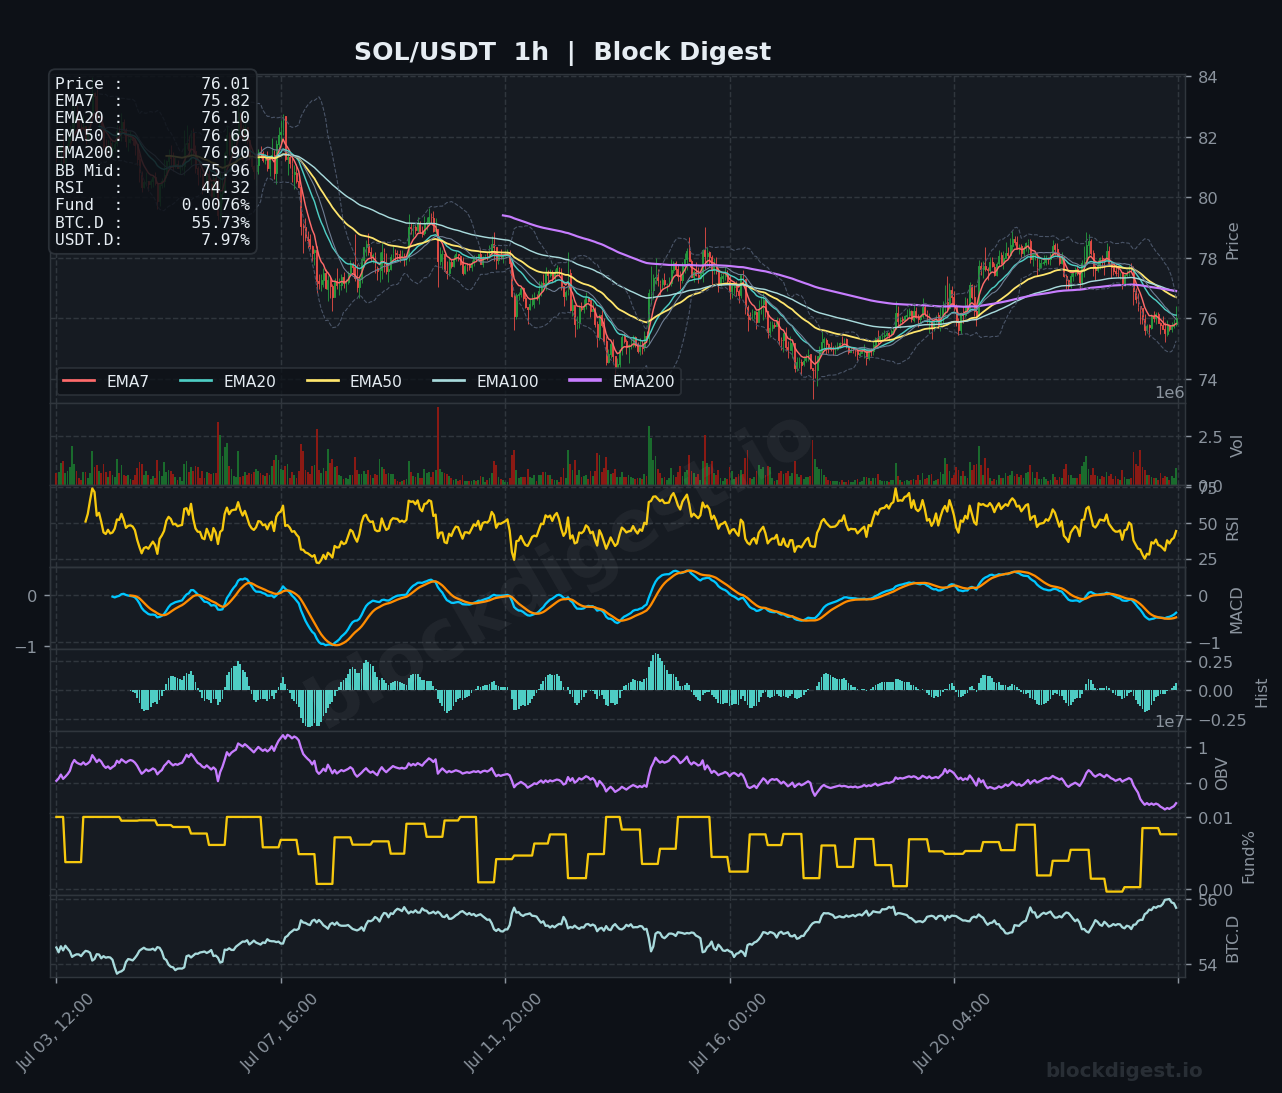
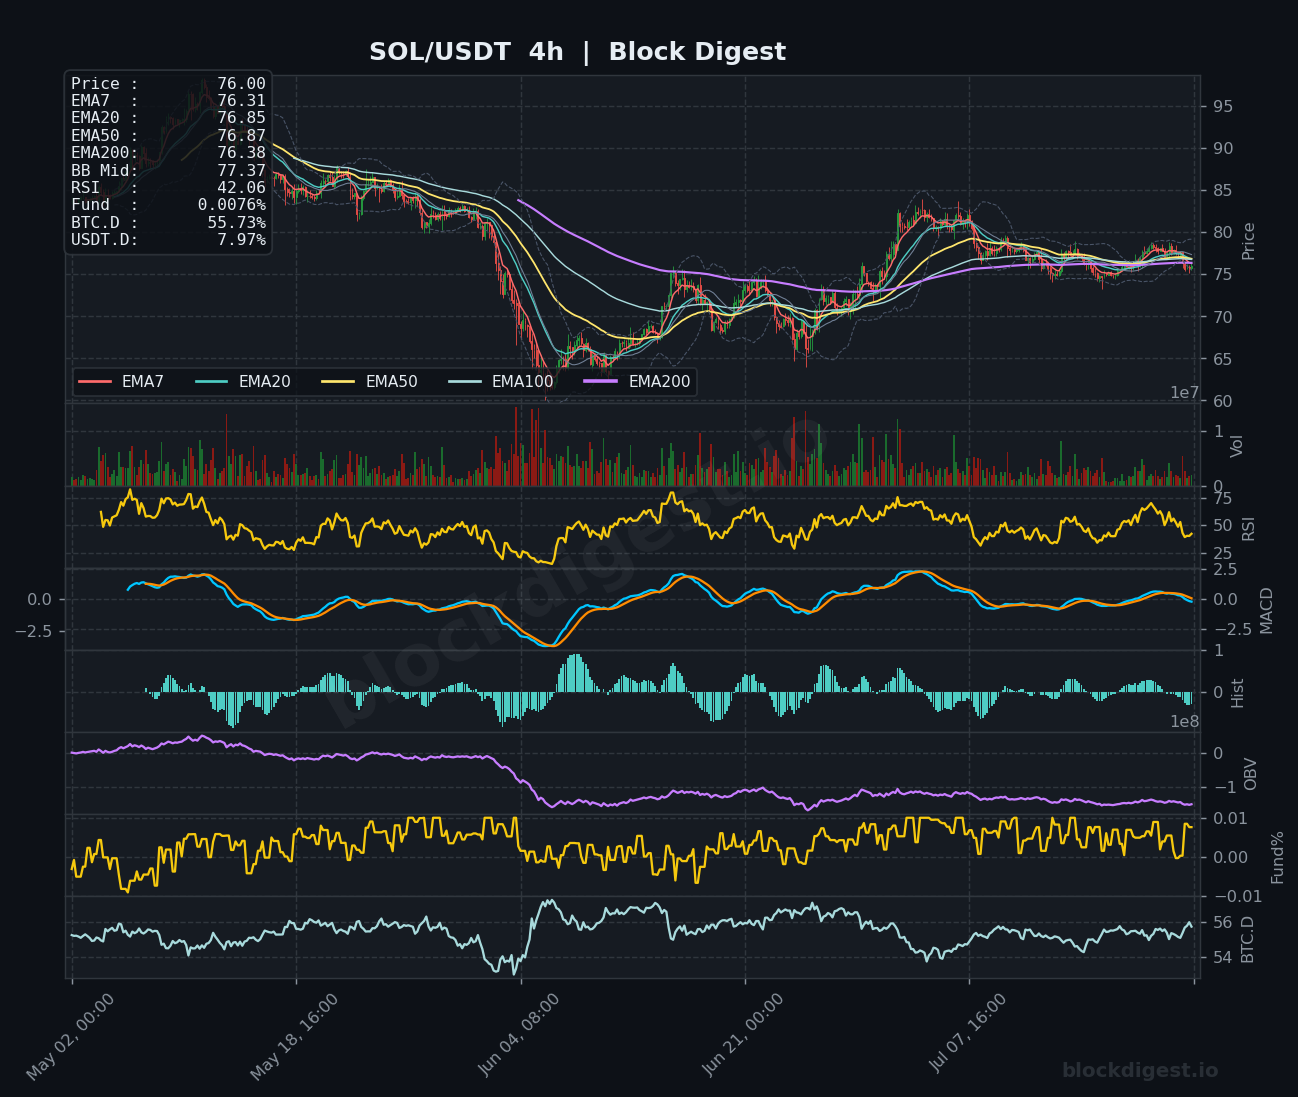
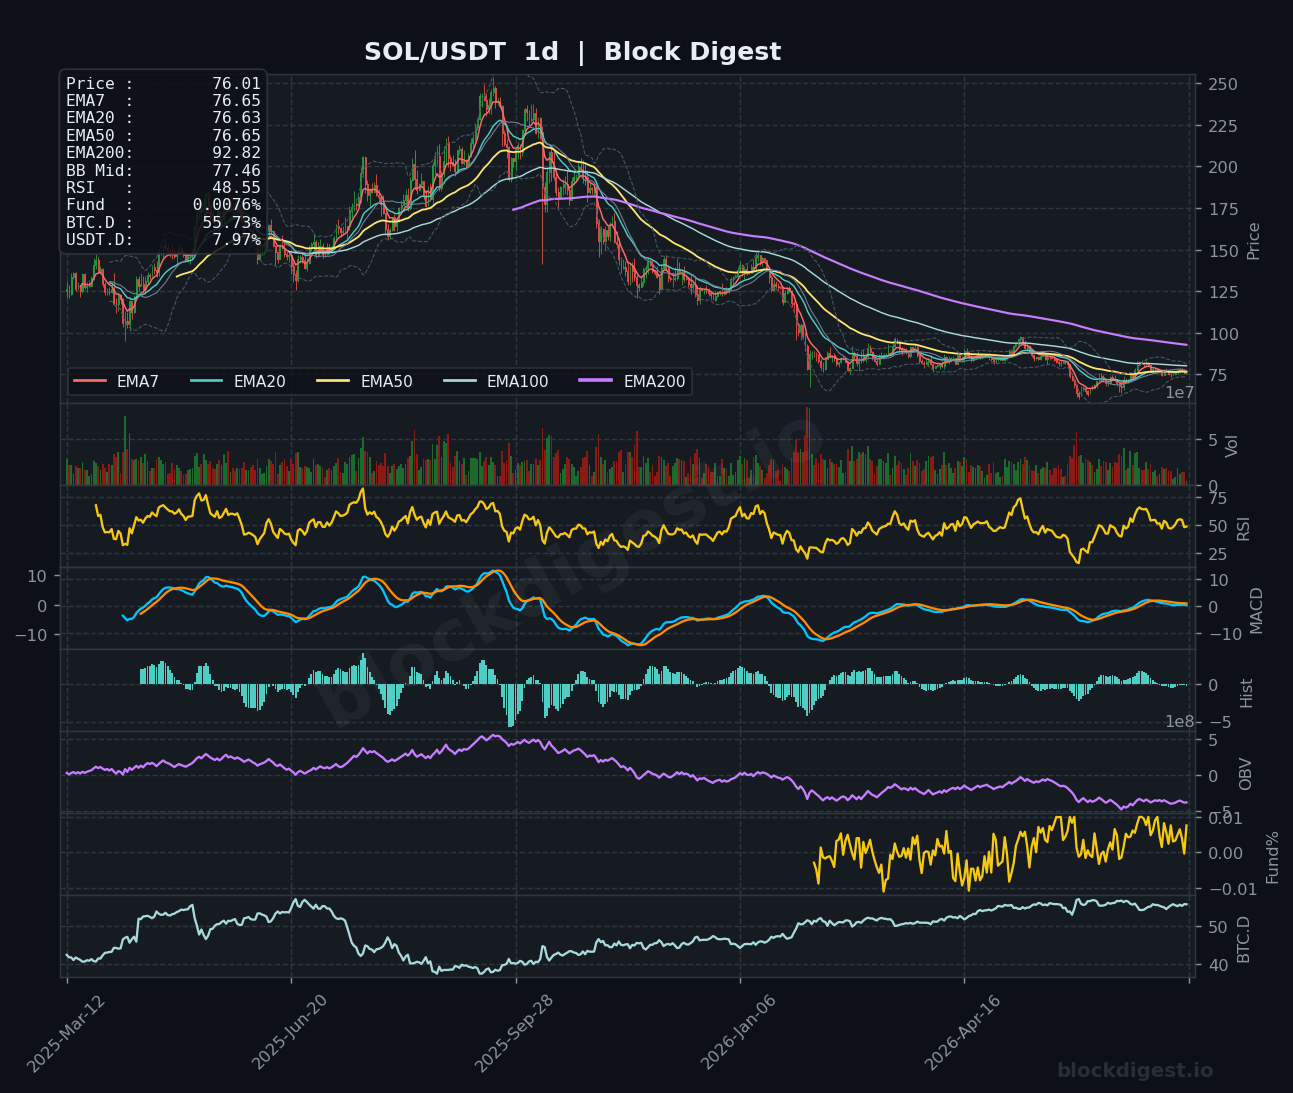
SOL is trading around $76.01, with price pinned beneath a dense cluster of moving averages — the EMA20, EMA50, and EMA200 are all stacked between $76.10 and $76.90 on the 1h chart, acting as an immediate overhead supply ceiling. The 4h RSI has dipped to 42.06 and the MACD is curling back toward bearish territory, reinforcing the technically driven selloff that has pushed SOL below its 50-day EMA on the daily. The daily chart paints a sobering longer-term picture, with the EMA200 still far overhead near $92.82, and OBV in a persistent downtrend reflecting sustained distribution. Immediate support sits near $74.50–$75.00, and the short-term bias is bearish until price can reclaim $77.50 with conviction.
XRP (XRP)
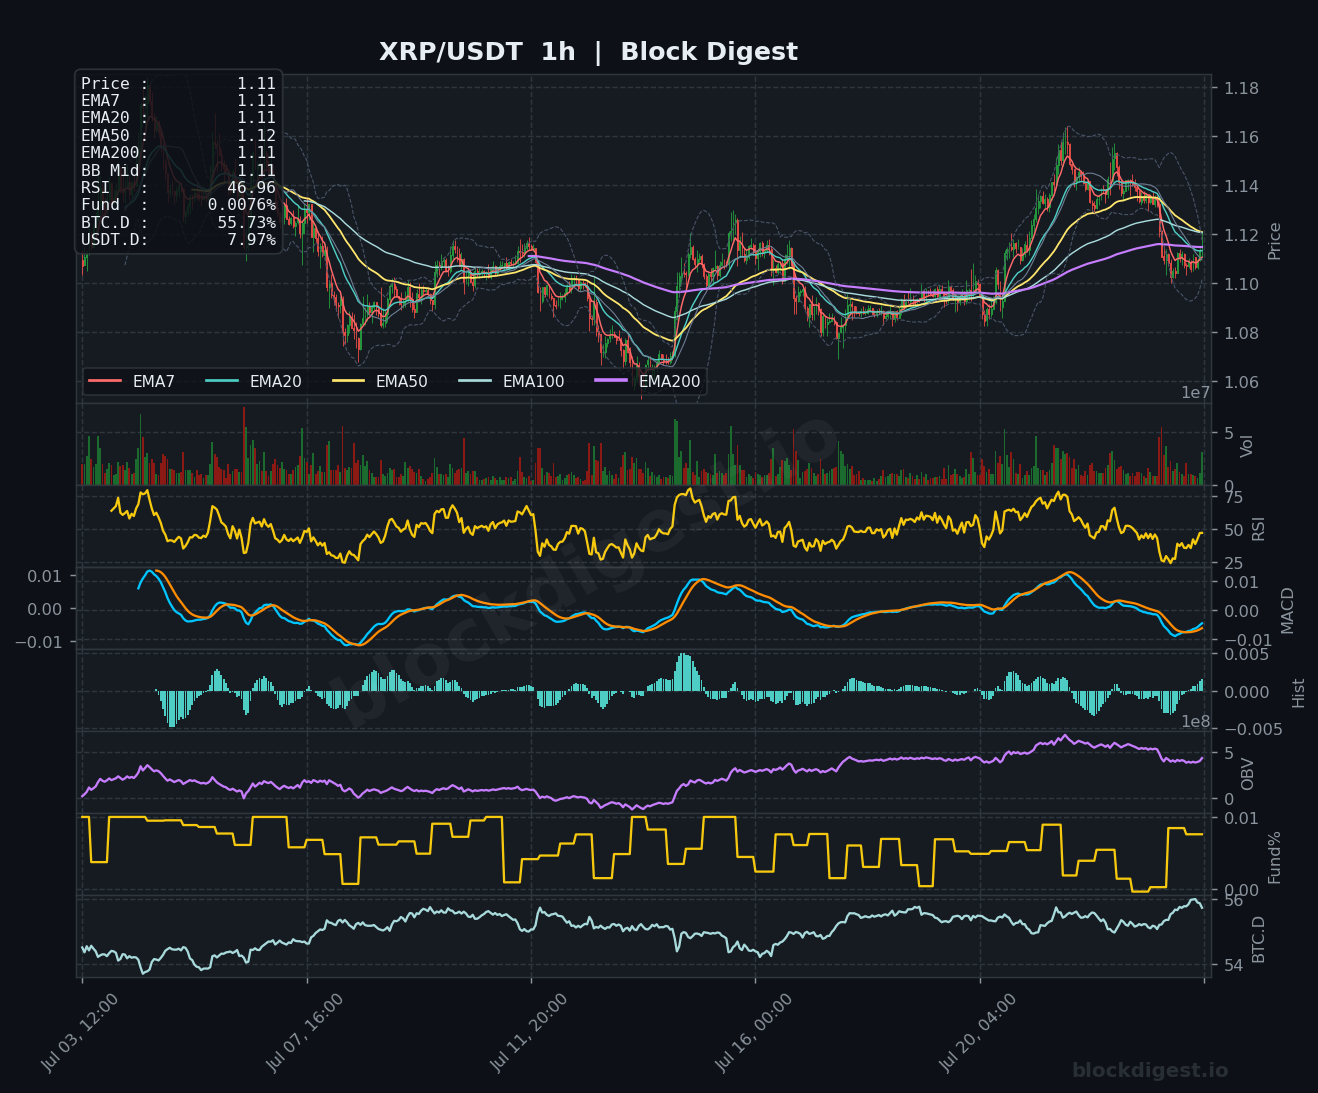
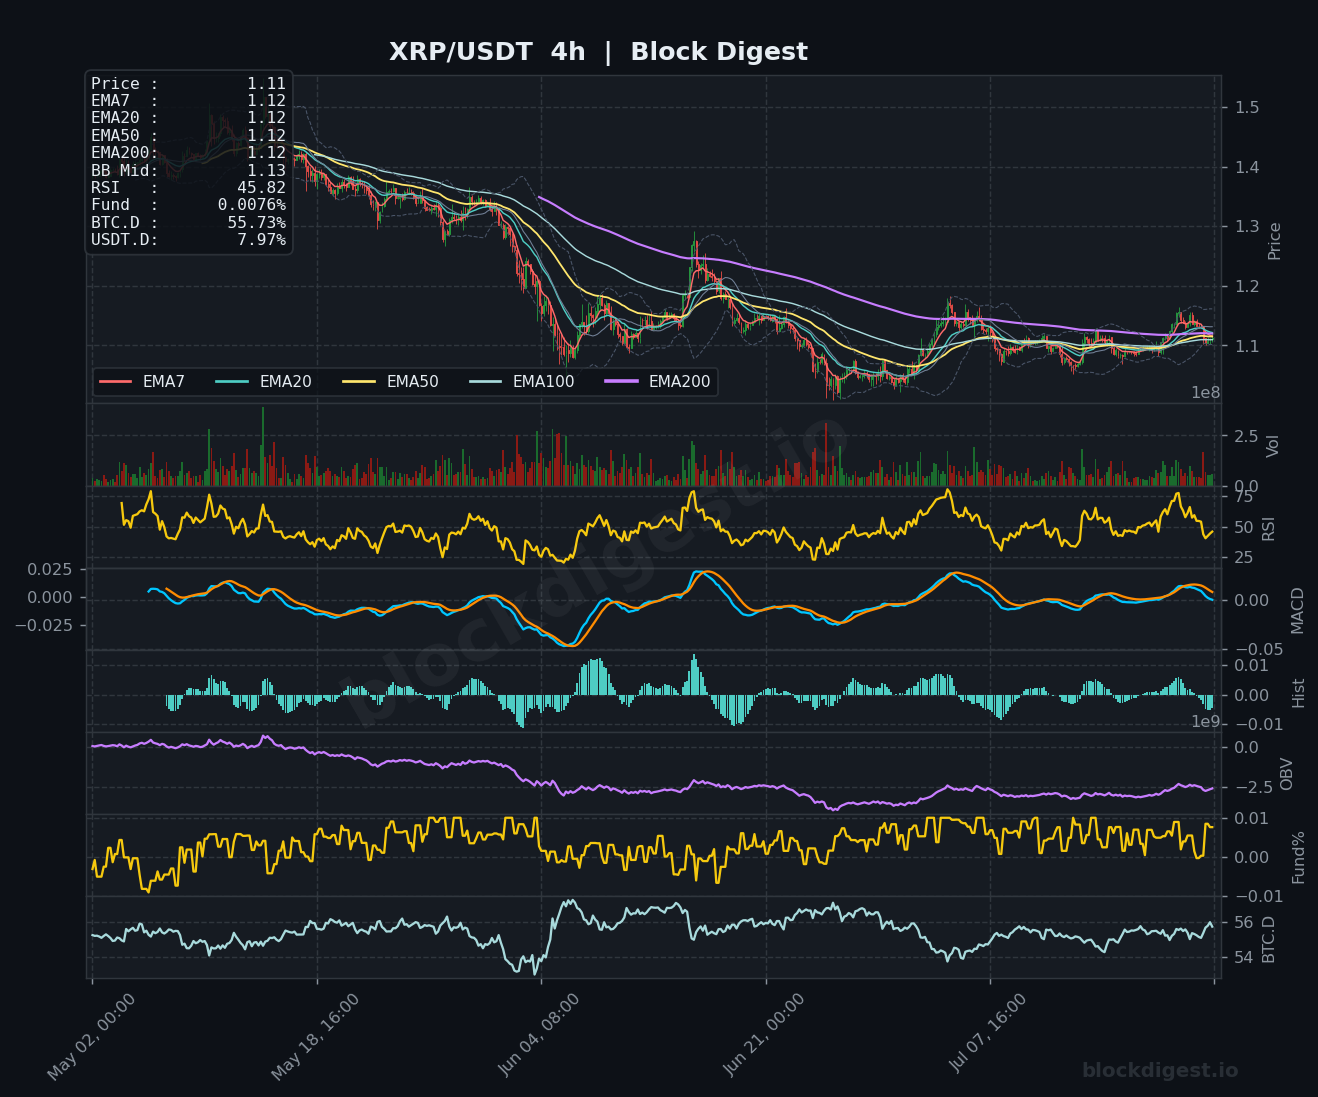
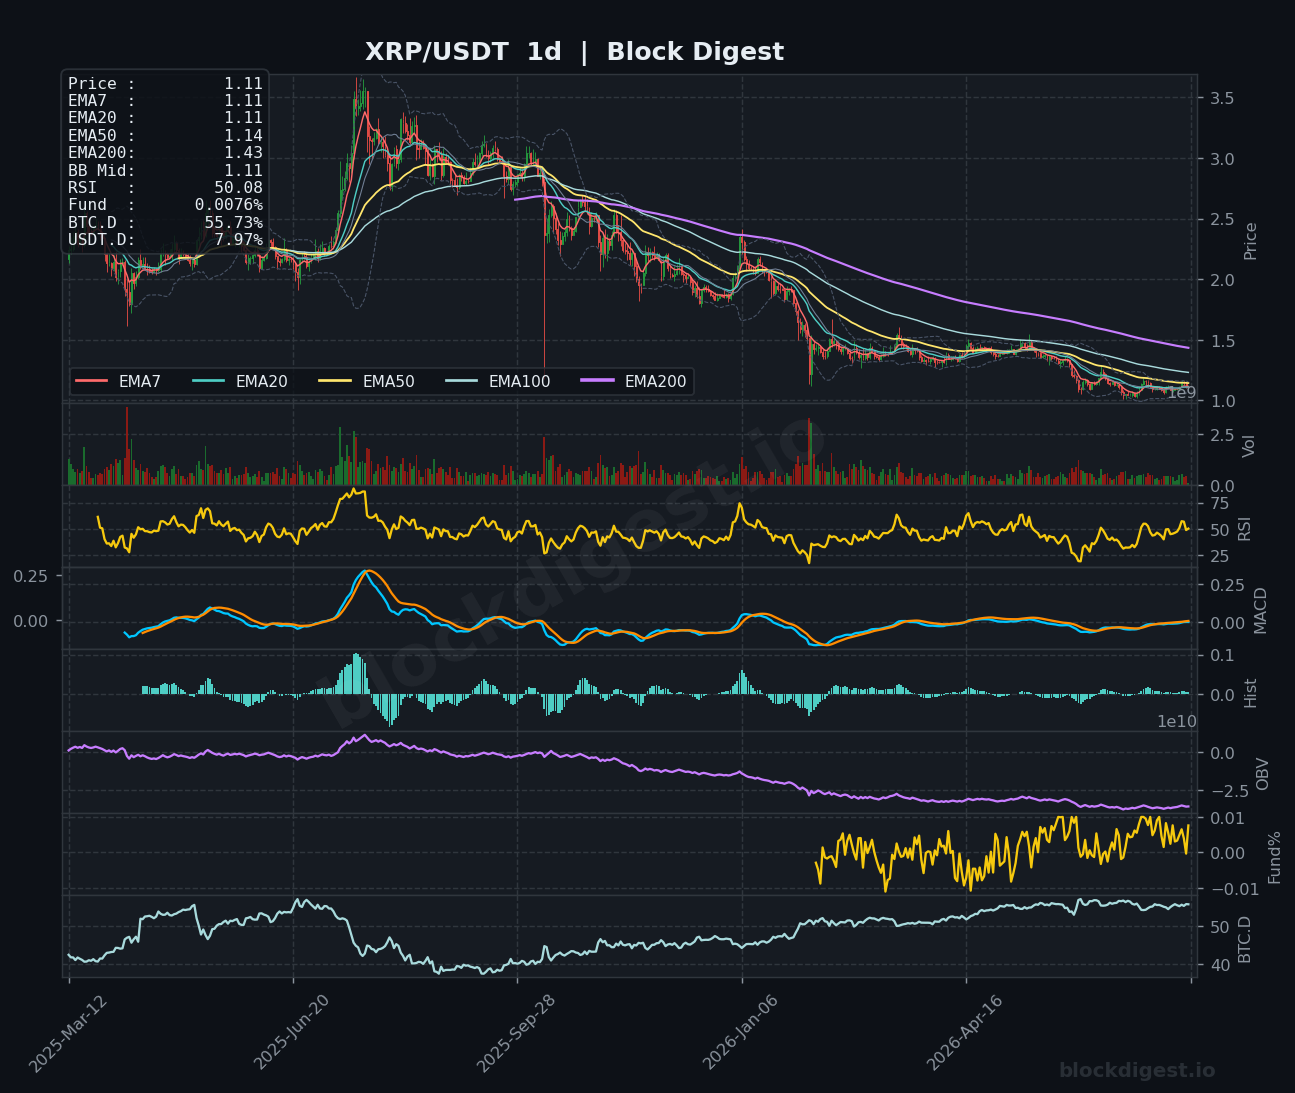
XRP is holding at $1.11, sitting exactly at its BB midline and EMA200 on the 1h chart, though the MACD has rolled over into a fresh bearish cross, with the 1h RSI at 46.96 and fading. On the 4h timeframe, the RSI reads 45.82 and price remains below the Bollinger midband at $1.13, with all short-term EMAs compressed into a tight range between $1.11–$1.12 — a coil that typically resolves with a decisive directional move. The daily chart shows the 50-day EMA at $1.14 and the 100-day at similar levels forming the supply zone referenced broadly in the market; OBV on the daily continues its multi-month downtrend. A sustained break below $1.08 would open the door toward $1.03, while bulls need a clean close above $1.16 to shift the near-term narrative.
BNB (BNB)
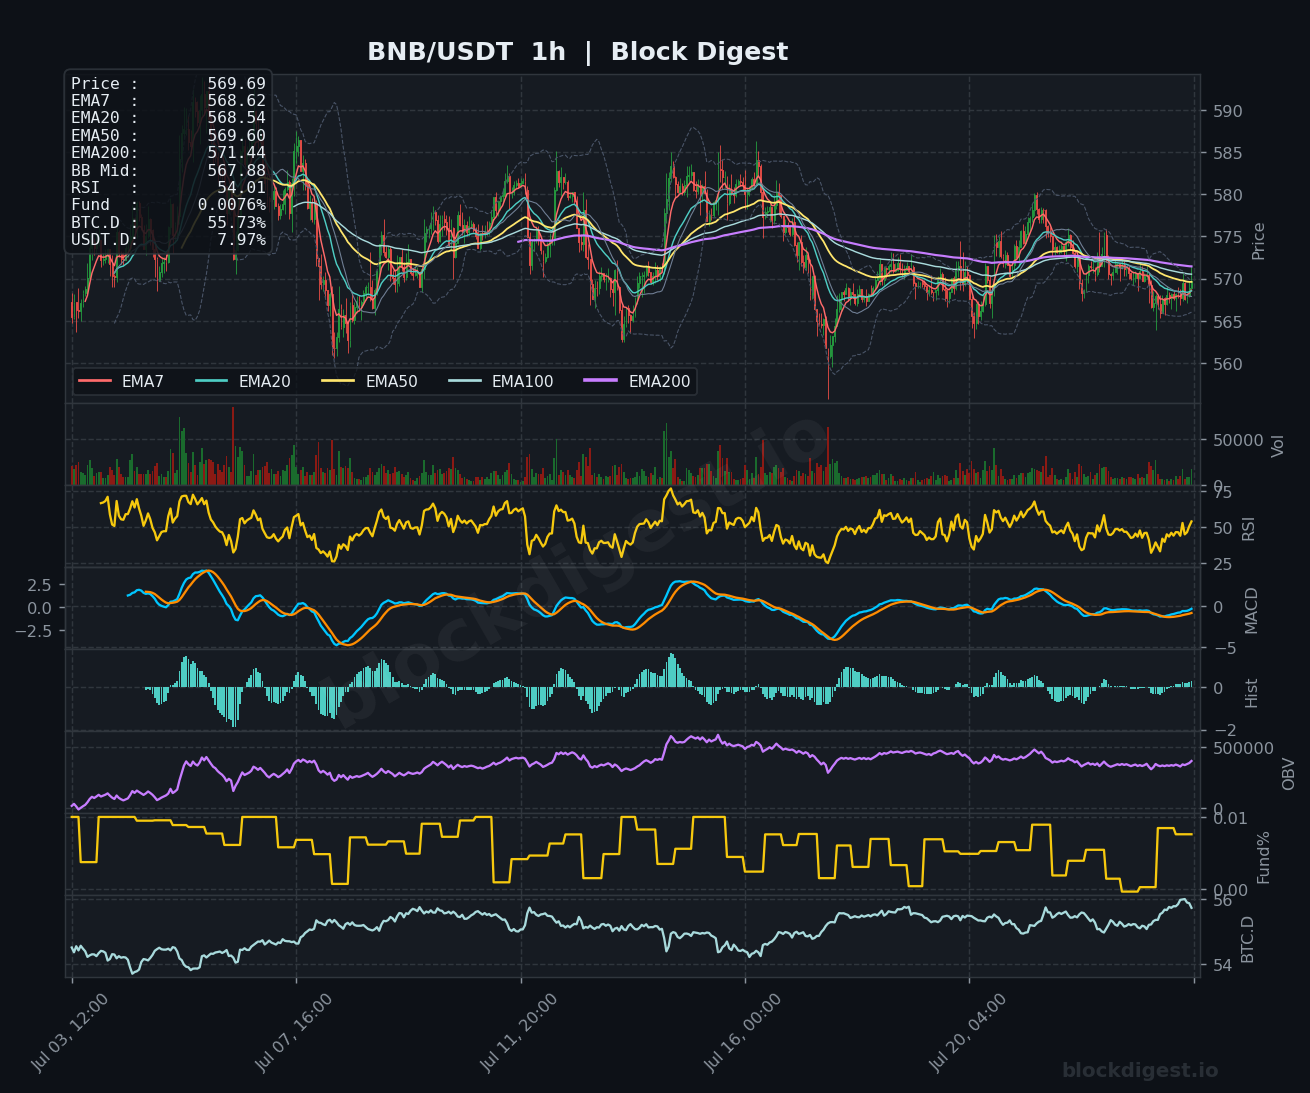
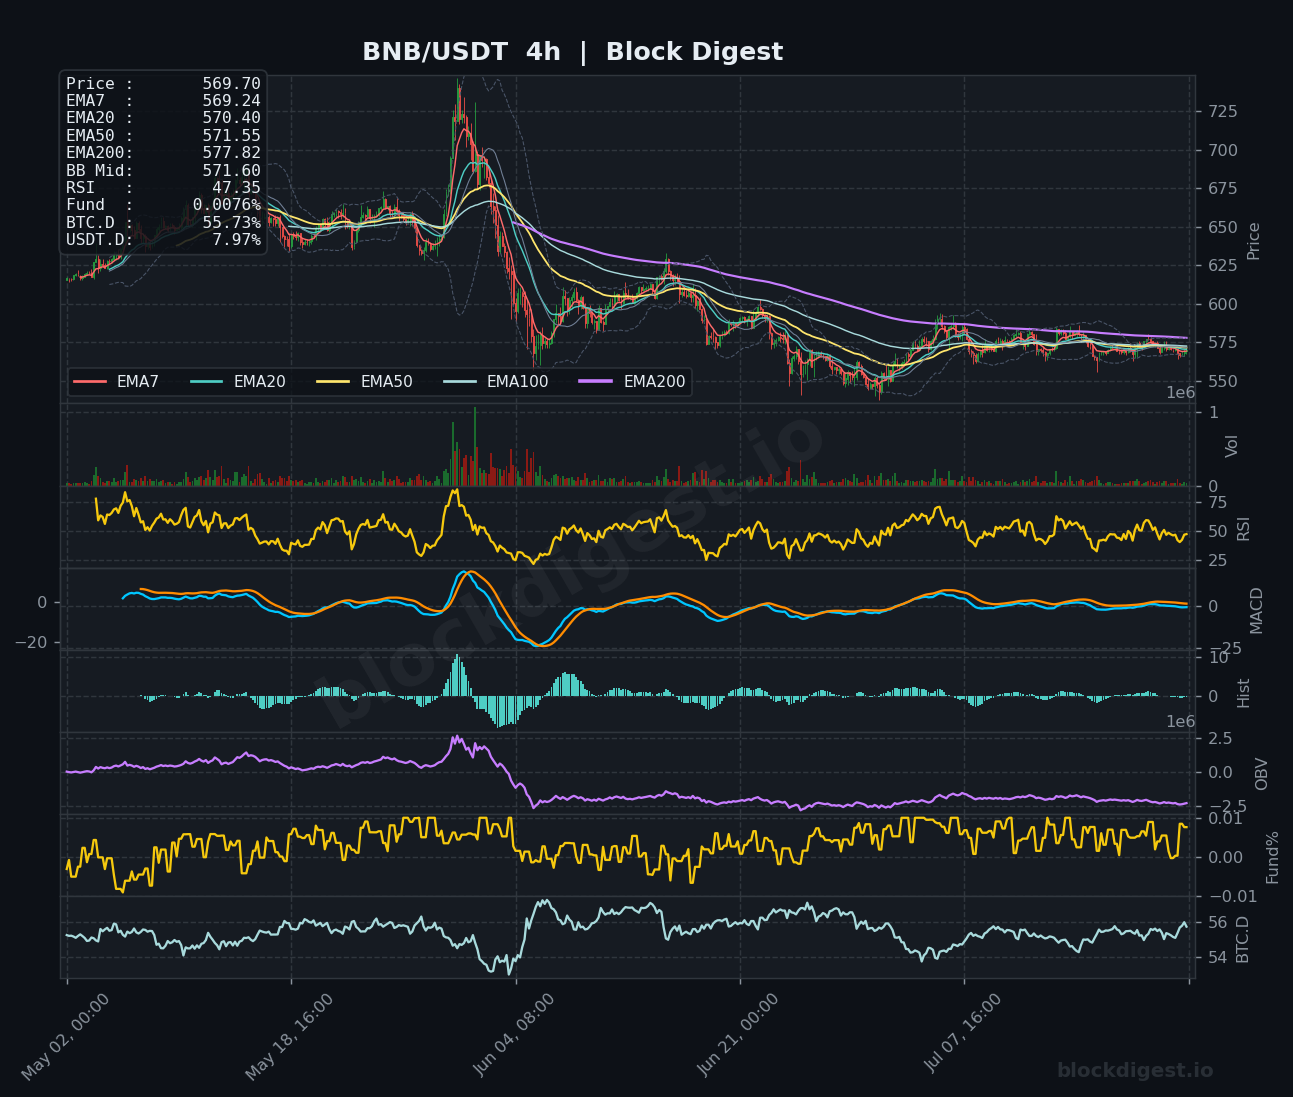
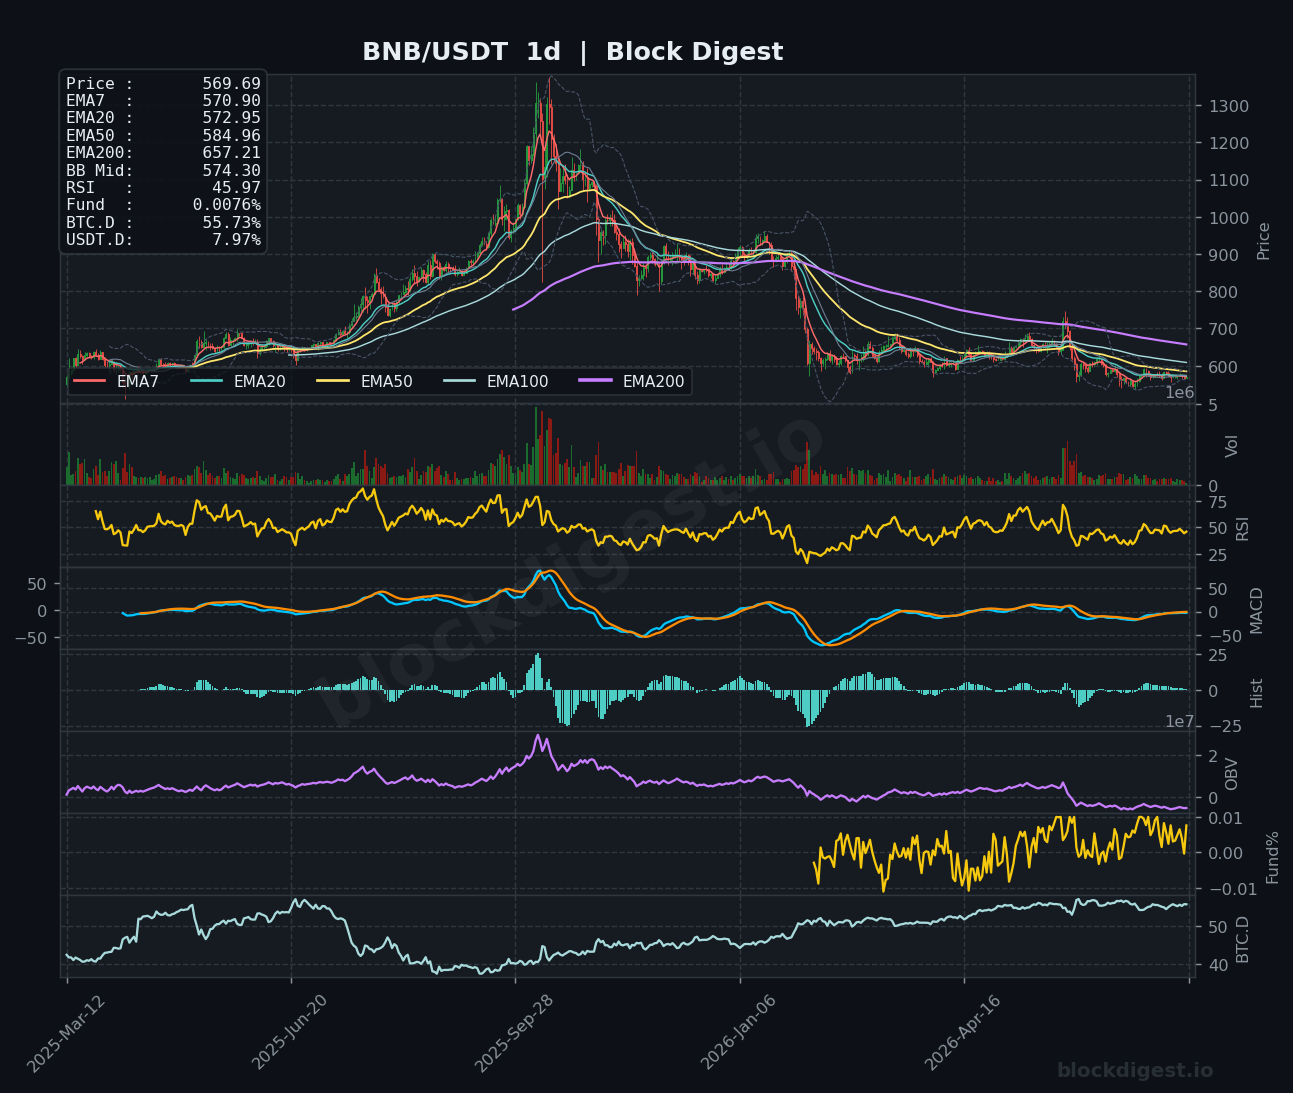
BNB is trading at $569.69, consolidating tightly around its short-term EMAs on the 1h chart — EMA7 at $568.62 and EMA200 at $571.44 forming a narrow band of indecision. The 1h RSI at 54.01 is the healthiest reading among the coins covered today, suggesting BNB is relatively less oversold and has been the most resilient during this broader altcoin pullback. However, the 4h chart shows RSI at 47.35 with MACD barely positive and OBV flat, suggesting upside momentum is limited. On the daily, price remains below the EMA50 at $584.96 and well beneath the EMA200 at $657.21, keeping the macro structure bearish; the $560 area is a key support level to watch on any further weakness.
Dogecoin (DOGE)
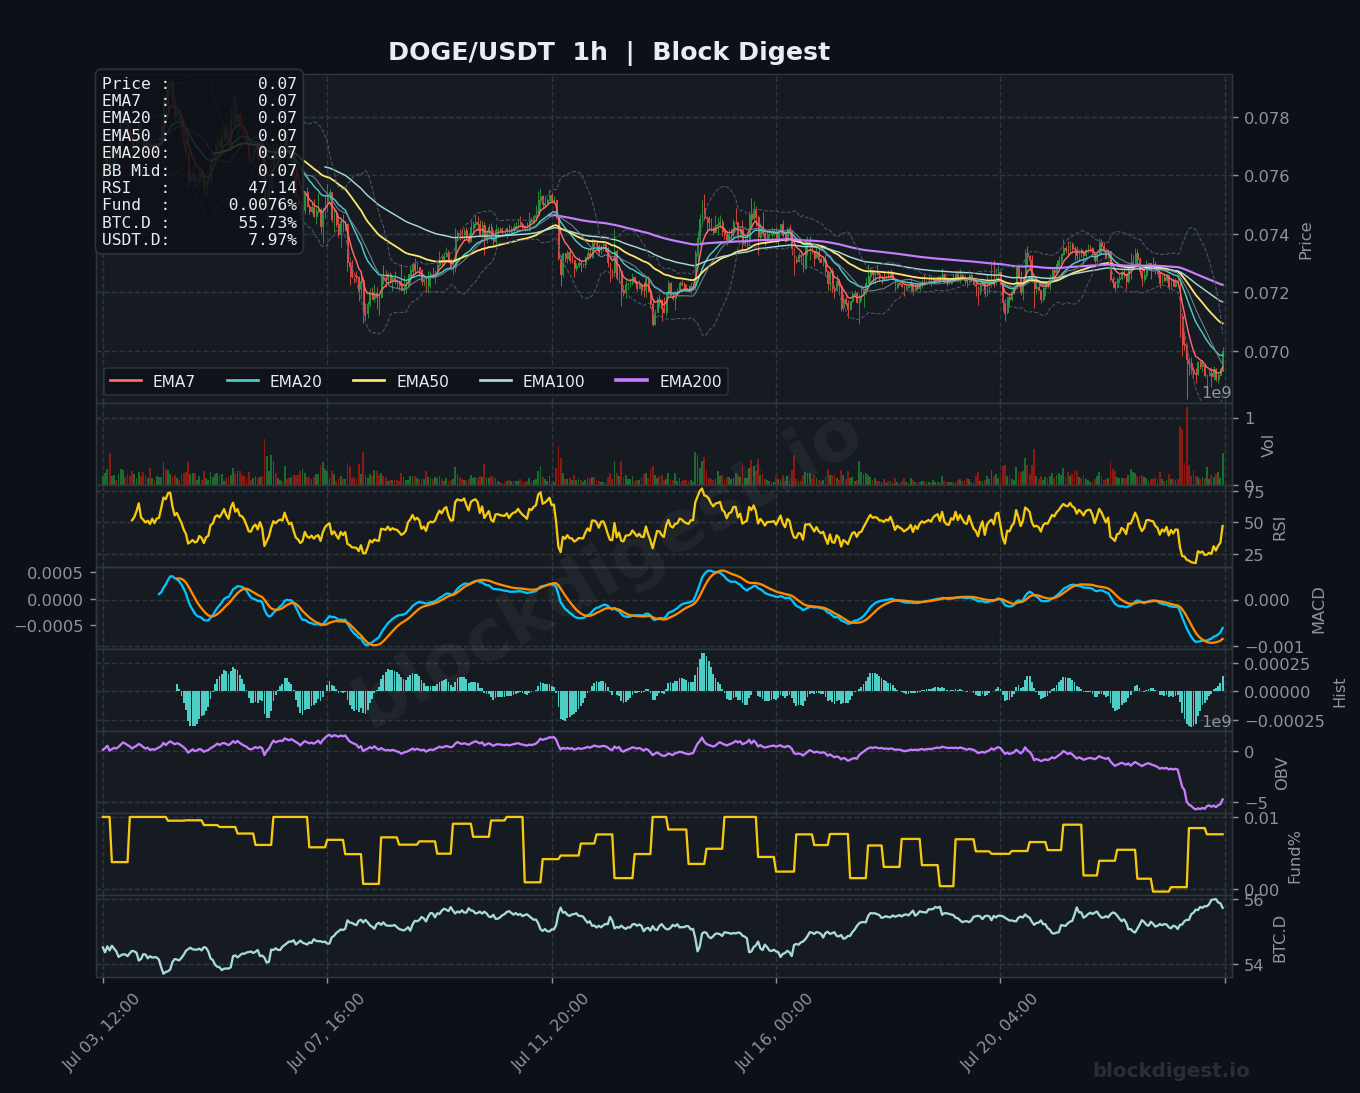
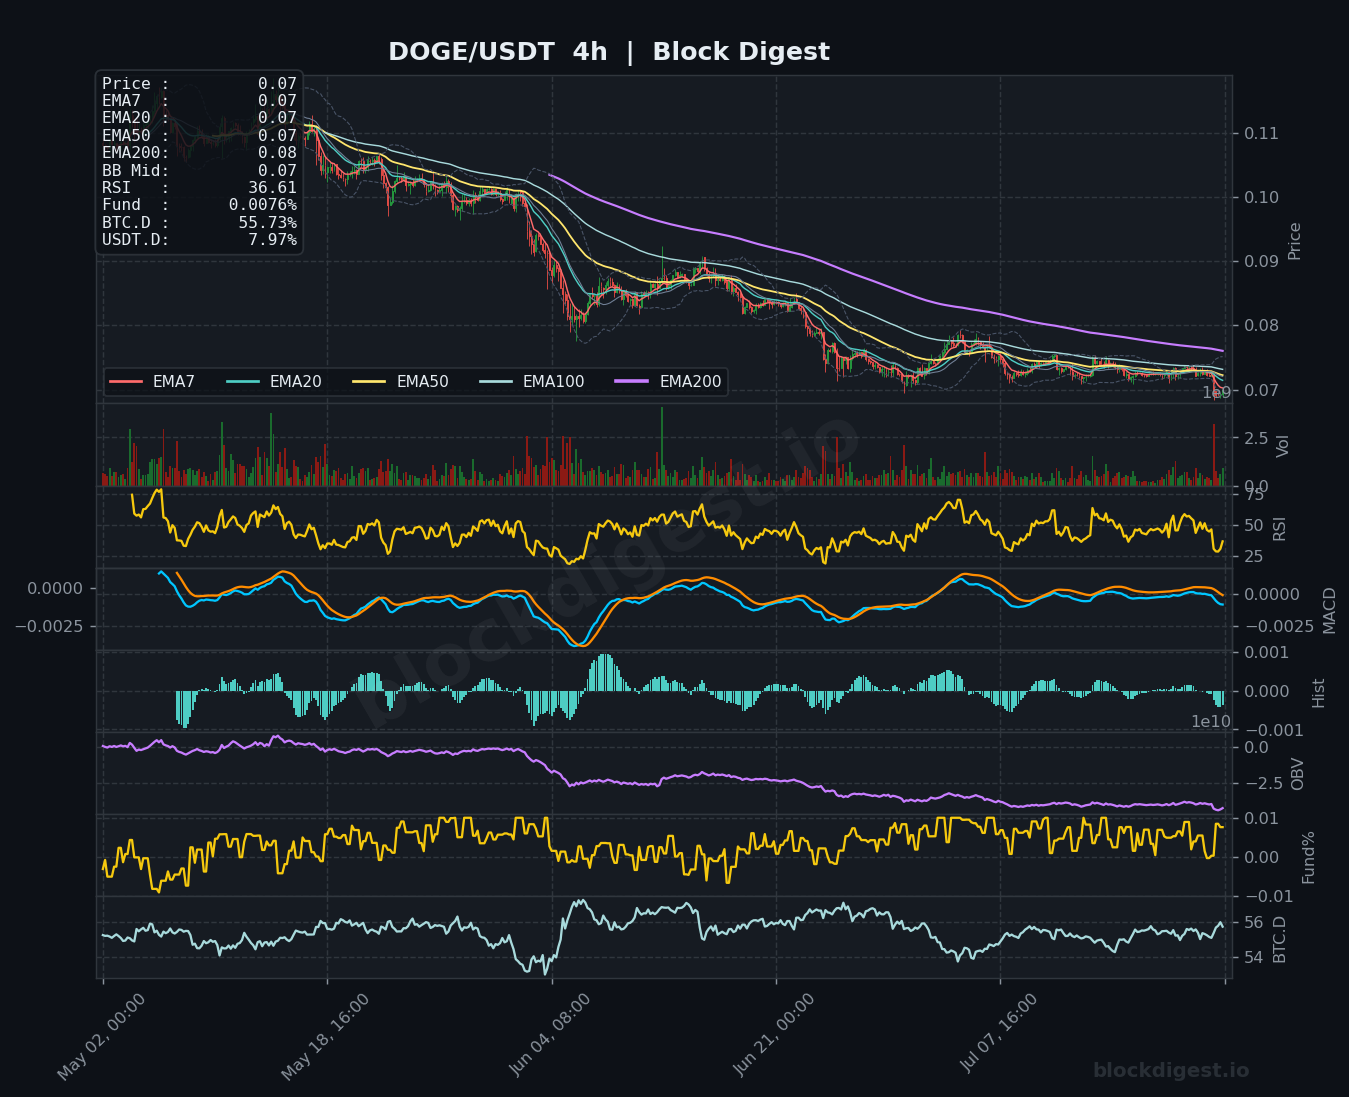
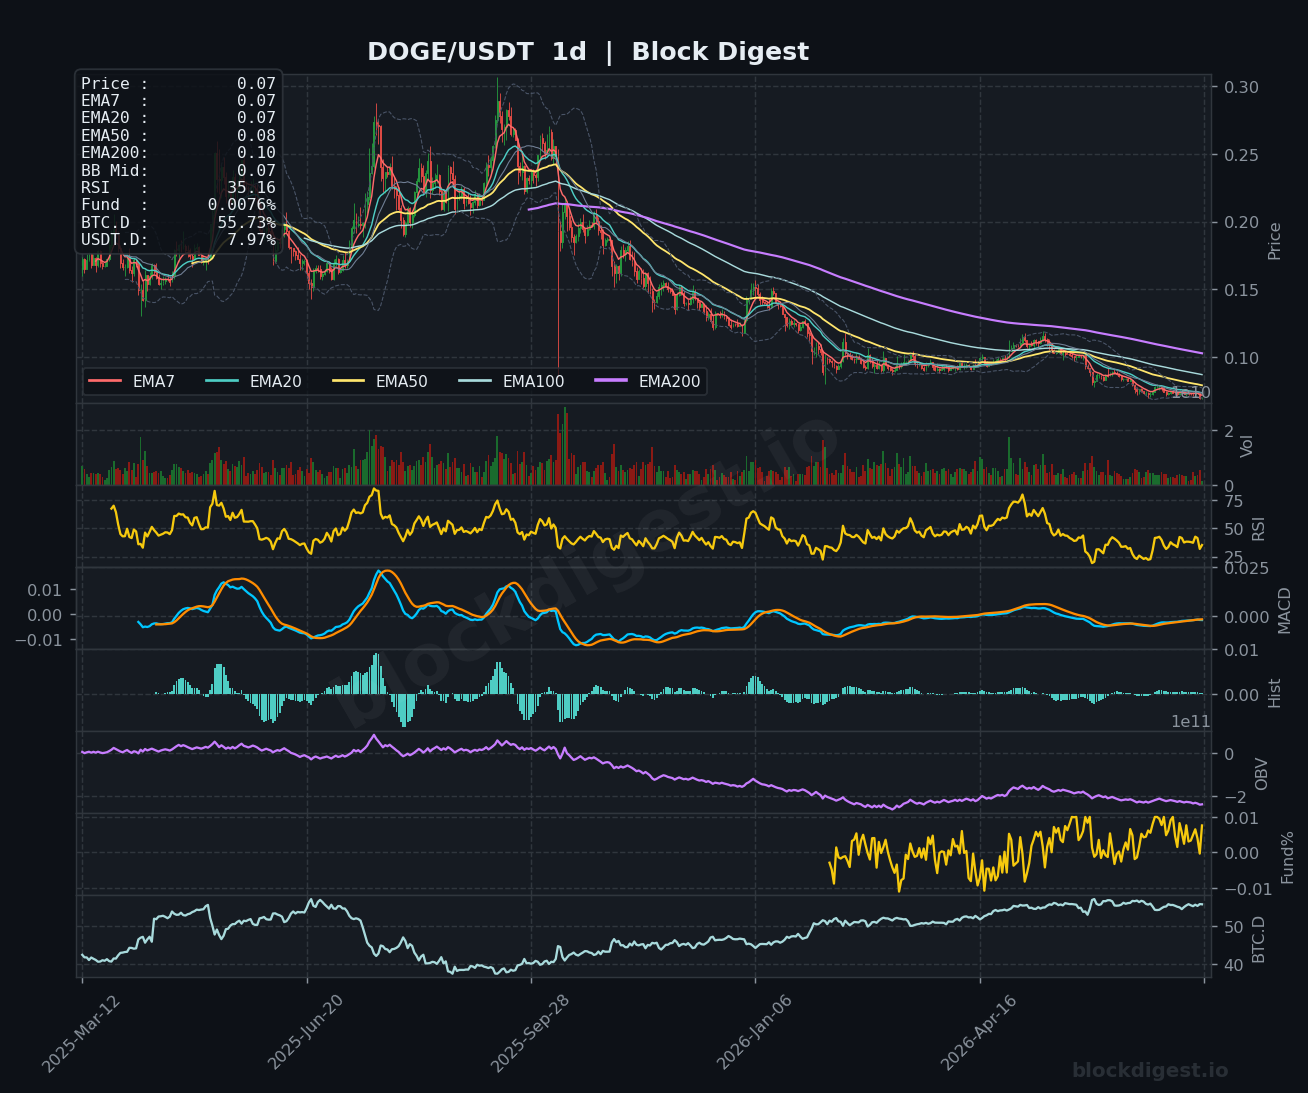
DOGE is the weakest performer in today’s roundup, trading at $0.07 and sitting beneath every major moving average across all three timeframes — the daily EMA200 at $0.10 remains a distant ceiling. The 4h RSI has collapsed to 36.61 and the daily RSI reads 35.16, approaching oversold territory but without yet showing any meaningful divergence that would signal a reversal. The BD Pulse BD Extreme Index reading of +1.03σ — flagging aggregate market positioning as stretched — is particularly relevant here, as DOGE is exhibiting exactly the kind of momentum breakdown that tends to accelerate when broader positioning unwinds. OBV on both the 4h and daily charts is sharply declining, confirming heavy sell-side pressure; the next meaningful support zone sits near $0.065–$0.067.
Litecoin (LTC)
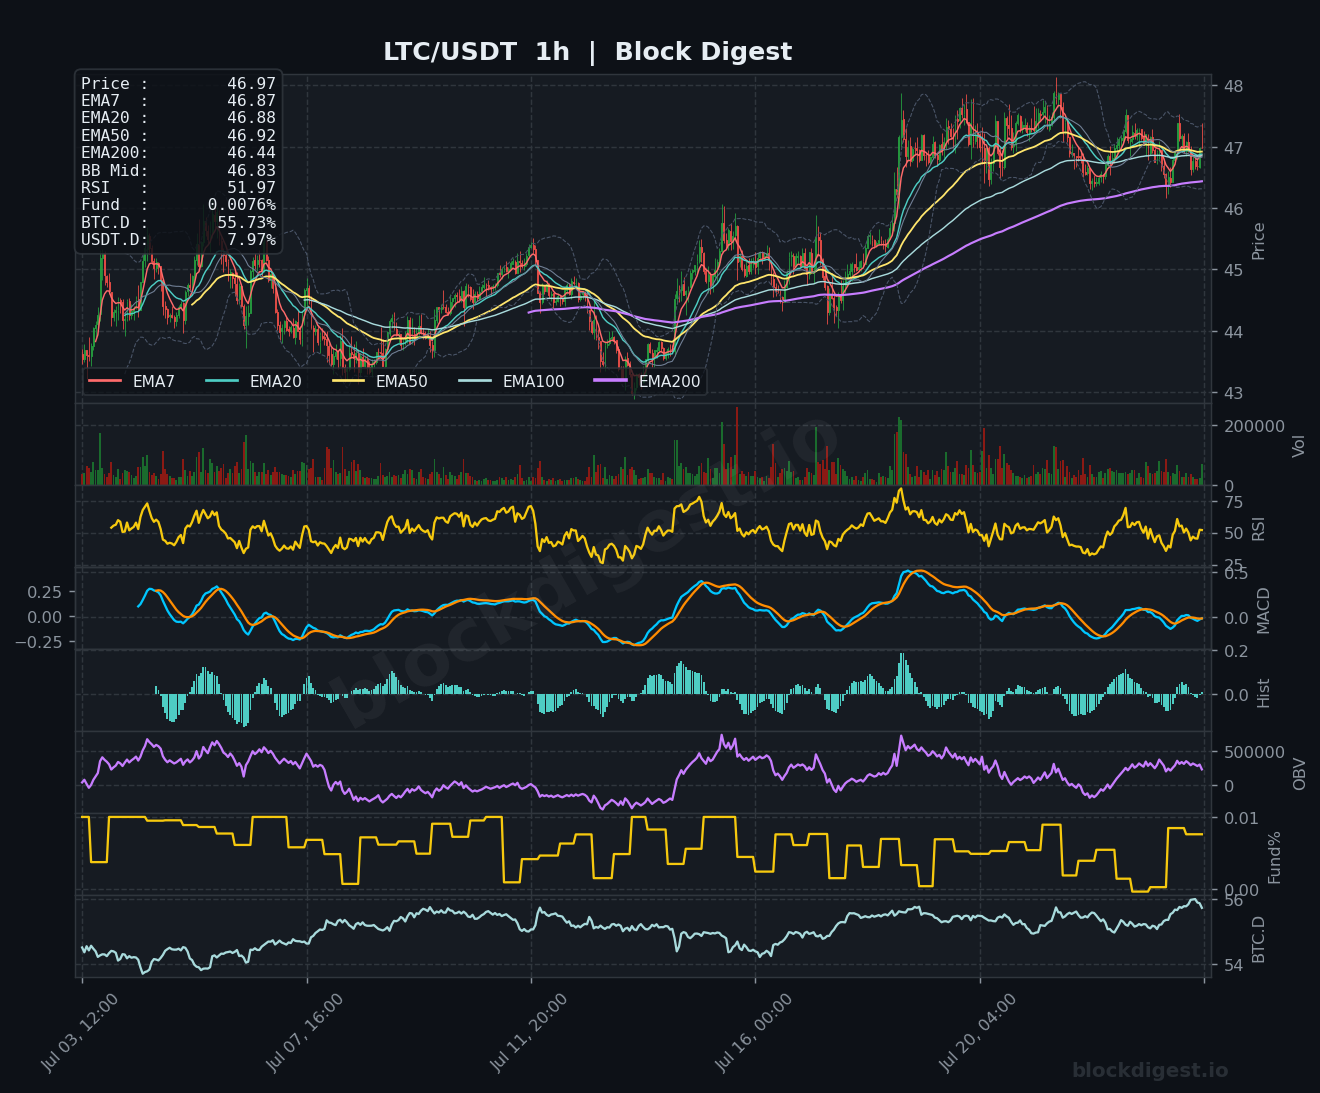
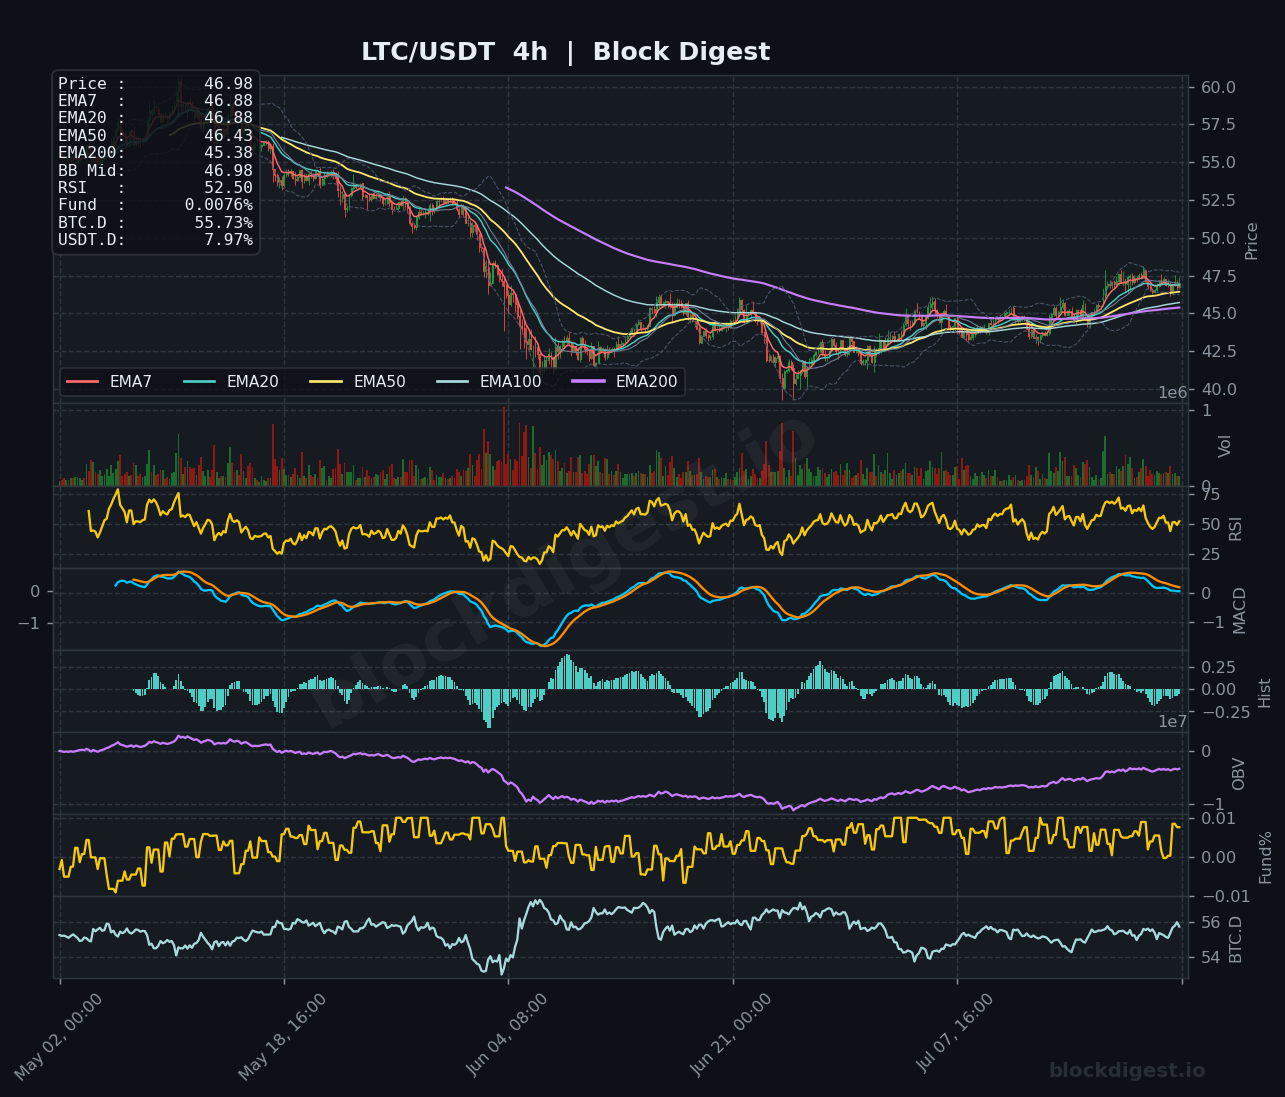
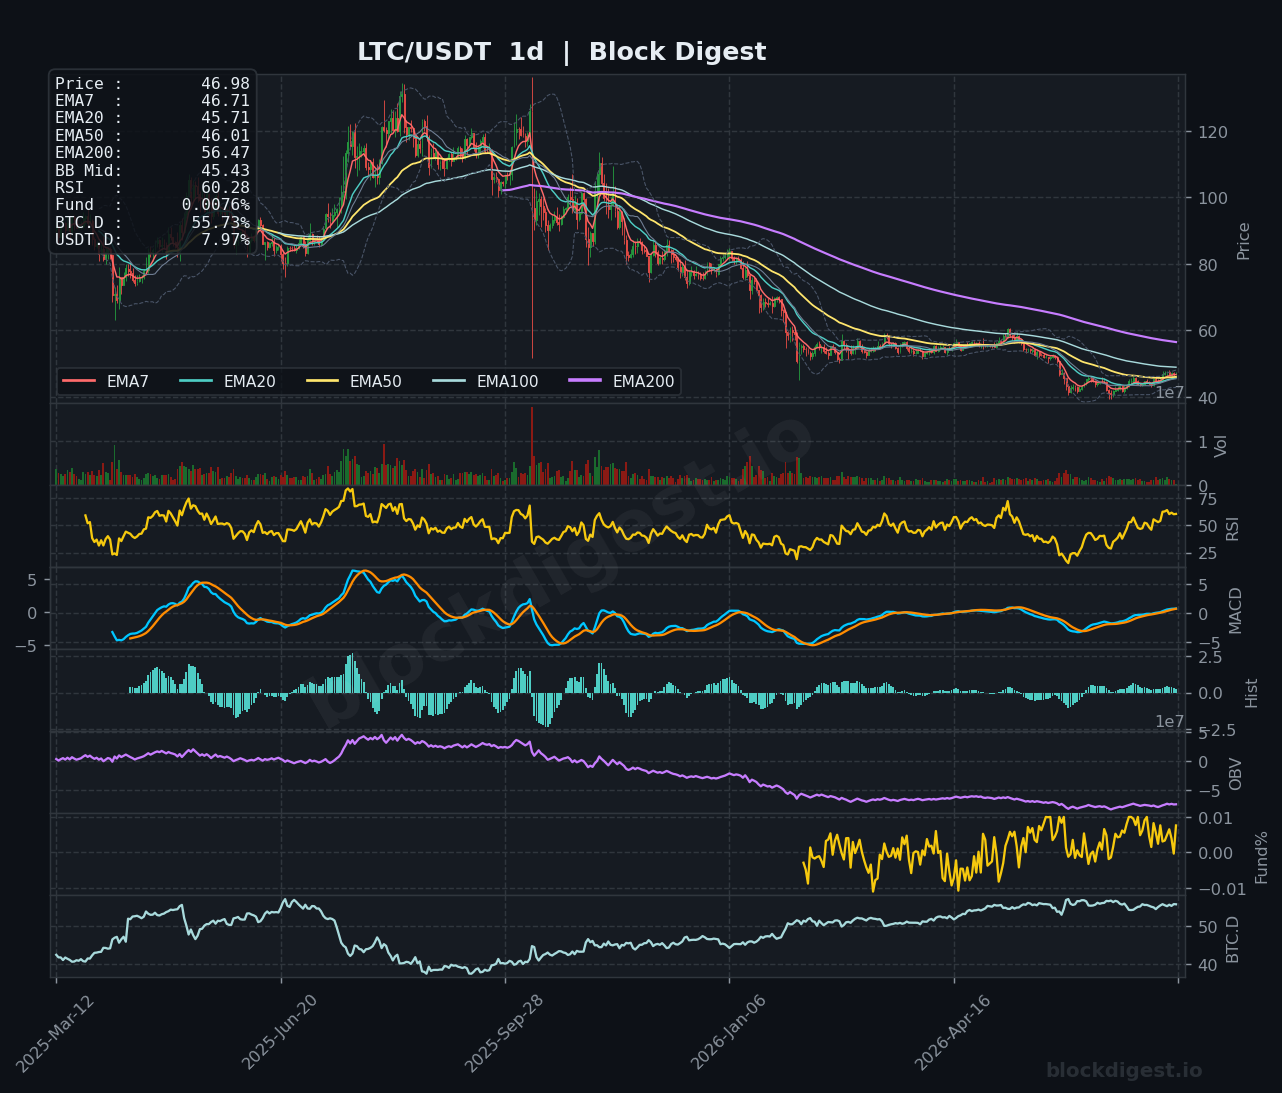
LTC stands out as the relative outperformer across today’s coverage, trading at $46.97 with the daily RSI at 60.28 — the only coin in this roundup with a daily RSI above 60, reflecting genuine structural recovery momentum. On the 4h chart, price has broken back above all short-term EMAs with the EMA50 at $46.43 and EMA200 at $45.38 now acting as dynamic support, while OBV on the 4h has been trending upward — a constructive divergence from peers. The 1h chart shows RSI at 51.97 and MACD hovering near zero, indicating a brief consolidation rather than a trend reversal after the recent run from the low-$40s. Key resistance sits at $48.00, and the setup remains cautiously bullish as long as $45.50 holds on pullbacks.
TRON (TRX)
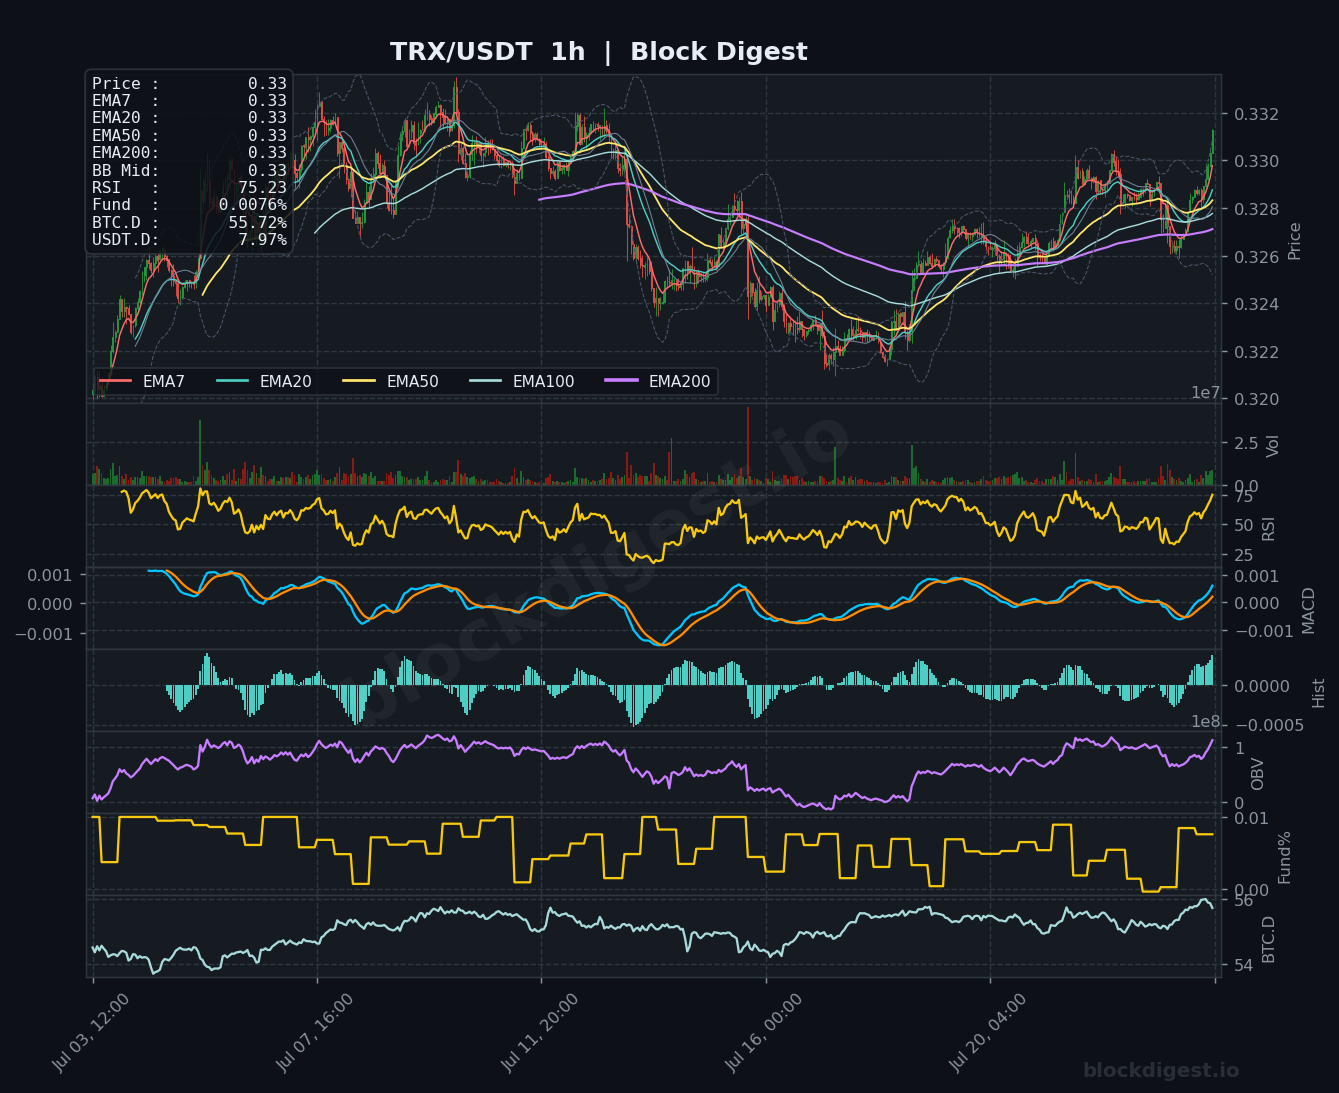
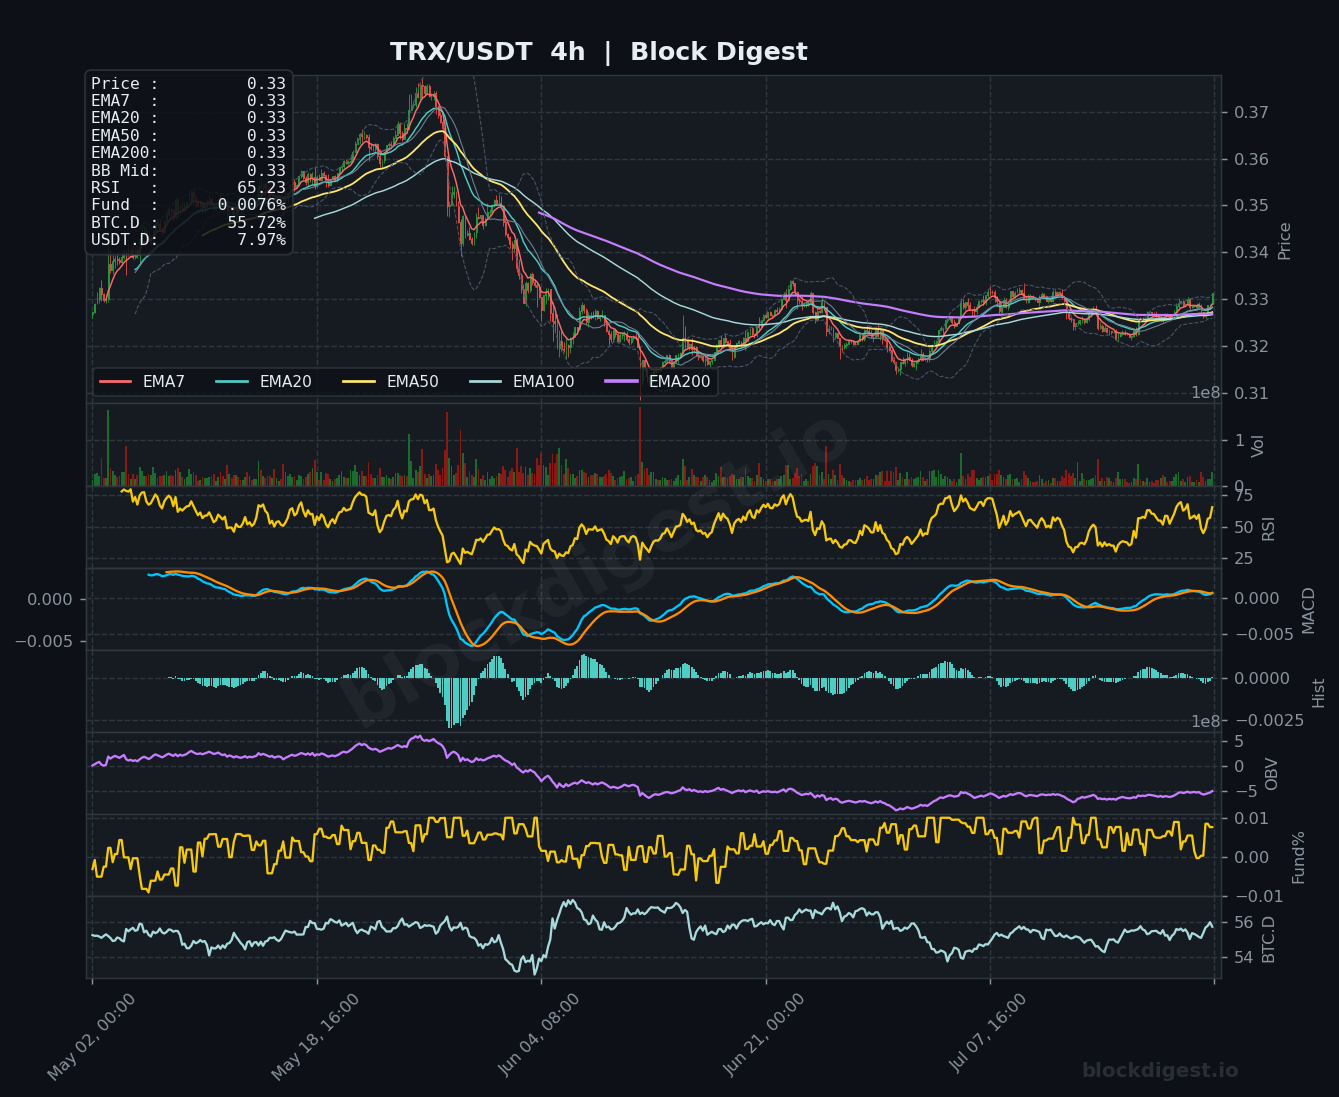
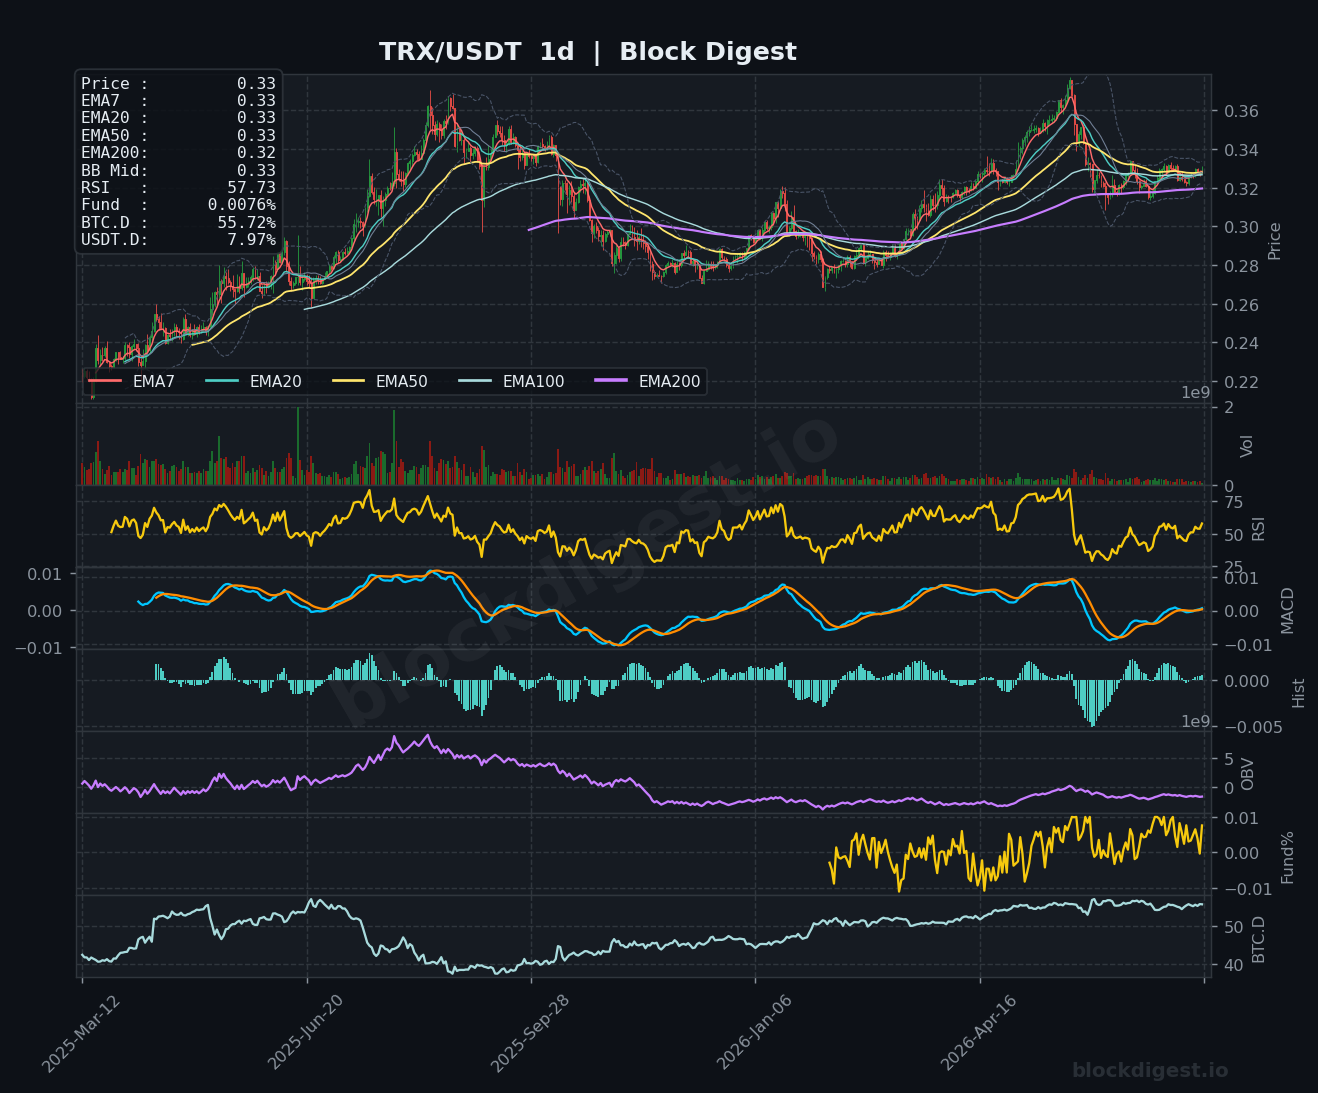
TRX is trading at $0.33, and its 1h RSI at 75.23 is flashing overbought conditions — the sharpest near-term overbought reading among all six coins covered today. The 4h RSI at 65.23 confirms that bullish momentum has been strong and sustained, with price trading above all EMAs on the 4h chart in a tight cluster around $0.33, and OBV trending steadily higher on both the 1h and 4h. The daily chart shows RSI at 57.73 with the EMA200 at $0.32 now providing solid base support, and the daily MACD histogram remains positive — a structurally cleaner picture than most of its peers. However, with the 1h RSI this elevated during a broader market selloff, a short-term pullback toward the $0.326–$0.328 support zone is likely before any continuation higher.
Altcoin Outlook
Today’s altcoin landscape is sharply bifurcated: TRX and LTC are demonstrating relative strength with rising OBV and constructive momentum structures, while SOL, XRP, DOGE, and to a lesser extent BNB, continue to face meaningful technical headwinds and deteriorating momentum. With the BD Pulse Long/Short Account Ratio at 1.48 — roughly 59.6% of accounts positioned long — there remains a notable long-side squeeze risk if BTC dominance continues to climb and macro sentiment stays sour. Traders should watch whether SOL can defend the $74.50 level and whether XRP can hold $1.08, as breaks below those thresholds could accelerate broader altcoin selling. The one condition that would flip this setup more constructively is a pullback in BTC dominance below 54%, which would signal capital rotation back into alts with enough force to clear the heavy supply zones stacked above current prices.
—
Disclaimer: This analysis is for informational purposes only and does not constitute financial advice. Cryptocurrency markets are highly volatile and unpredictable. All trading decisions should be made based on your own research and risk tolerance. Block Digest is not responsible for any financial losses incurred as a result of acting on this content.